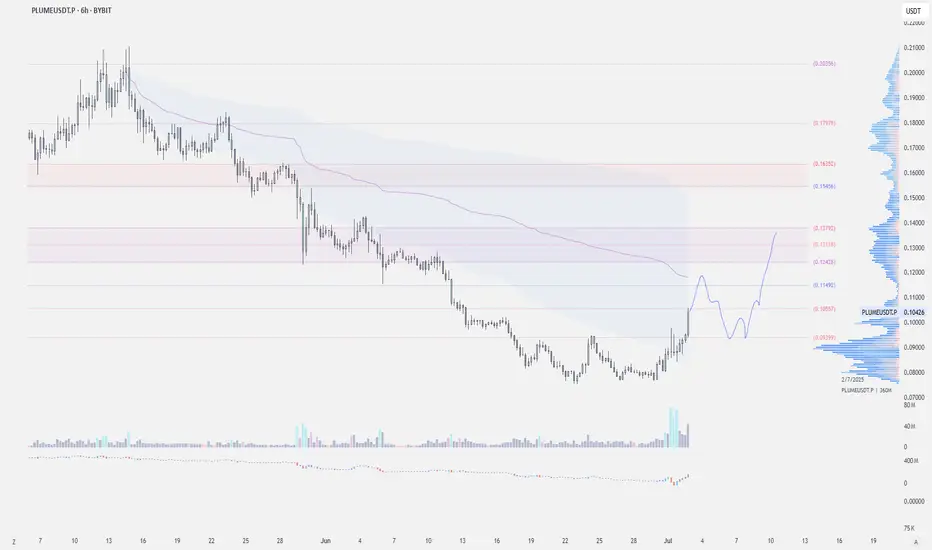
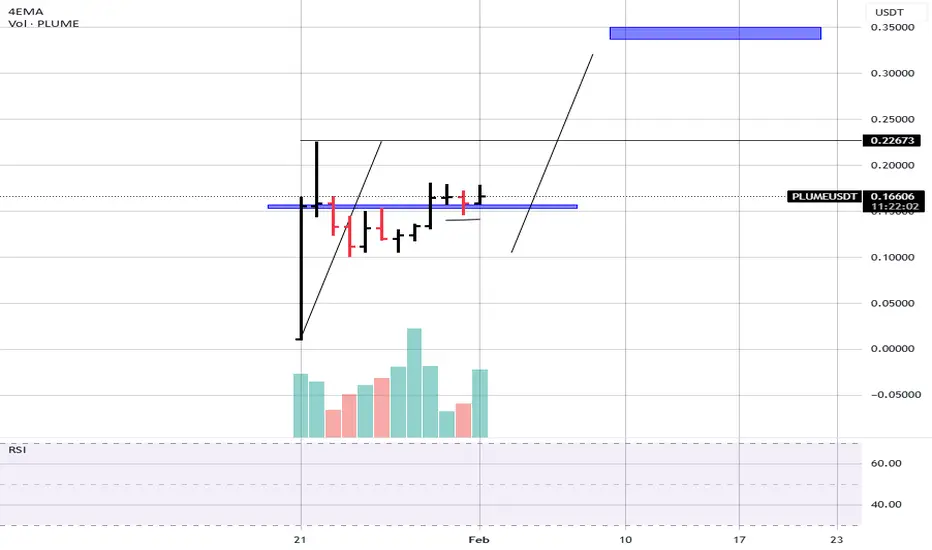
$PLUME - Scalp Long Trade$PLUME | 6h
You can risk at current price or wait for a rejection at vwap, and enter on pullback
Might tag .12–.125 first, possible pullback into .105-.094
Stoploss just below .082
TPs:
.12 to .125
.132 to .138
.154 to .163
PLUMEUSDT.P trade ideas
PLUME/USDTKey Level Zone: 0.1030 - 0.1060
LMT v2.0 detected.
The setup looks promising—price previously trended upward with rising volume and momentum, then retested this zone cleanly. This presents an excellent reward-to-risk opportunity if momentum continues to align.
Introducing LMT (Levels & Momentum Trading)
- Over the past 3 years, I’ve refined my approach to focus more sharply on the single most important element in any trade: the KEY LEVEL.
- While HMT (High Momentum Trading) served me well—combining trend, momentum, volume, and structure across multiple timeframes—I realized that consistently identifying and respecting these critical price zones is what truly separates good trades from great ones.
- That insight led to the evolution of HMT into LMT – Levels & Momentum Trading.
Why the Change? (From HMT to LMT)
Switching from High Momentum Trading (HMT) to Levels & Momentum Trading (LMT) improves precision, risk control, and confidence by:
- Clearer Entries & Stops: Defined key levels make it easier to plan entries, stop-losses, and position sizing—no more guesswork.
- Better Signal Quality: Momentum is now always checked against a support or resistance zone—if it aligns, it's a stronger setup.
- Improved Reward-to-Risk: All trades are anchored to key levels, making it easier to calculate and manage risk effectively.
- Stronger Confidence: With clear invalidation points beyond key levels, it's easier to trust the plan and stay disciplined—even in tough markets.
Whenever I share a signal, it’s because:
- A high‐probability key level has been identified on a higher timeframe.
- Lower‐timeframe momentum, market structure and volume suggest continuation or reversal is imminent.
- The reward‐to‐risk (based on that key level) meets my criteria for a disciplined entry.
***Please note that conducting a comprehensive analysis on a single timeframe chart can be quite challenging and sometimes confusing. I appreciate your understanding of the effort involved.
Important Note: The Role of Key Levels
- Holding a key level zone: If price respects the key level zone, momentum often carries the trend in the expected direction. That’s when we look to enter, with stop-loss placed just beyond the zone with some buffer.
- Breaking a key level zone: A definitive break signals a potential stop‐out for trend traders. For reversal traders, it’s a cue to consider switching direction—price often retests broken zones as new support or resistance.
My Trading Rules (Unchanged)
Risk Management
- Maximum risk per trade: 2.5%
- Leverage: 5x
Exit Strategy / Profit Taking
- Sell at least 70% on the 3rd wave up (LTF Wave 5).
- Typically sell 50% during a high‐volume spike.
- Move stop‐loss to breakeven once the trade achieves a 1.5:1 R:R.
- Exit at breakeven if momentum fades or divergence appears.
The market is highly dynamic and constantly changing. LMT signals and target profit (TP) levels are based on the current price and movement, but market conditions can shift instantly, so it is crucial to remain adaptable and follow the market's movement.
If you find this signal/analysis meaningful, kindly like and share it.
Thank you for your support~
Sharing this with love!
From HMT to LMT: A Brief Version History
HM Signal :
Date: 17/08/2023
- Early concept identifying high momentum pullbacks within strong uptrends
- Triggered after a prior wave up with rising volume and momentum
- Focused on healthy retracements into support for optimal reward-to-risk setups
HMT v1.0:
Date: 18/10/2024
- Initial release of the High Momentum Trading framework
- Combined multi-timeframe trend, volume, and momentum analysis.
- Focused on identifying strong trending moves high momentum
HMT v2.0:
Date: 17/12/2024
- Major update to the Momentum indicator
- Reduced false signals from inaccurate momentum detection
- New screener with improved accuracy and fewer signals
HMT v3.0:
Date: 23/12/2024
- Added liquidity factor to enhance trend continuation
- Improved potential for momentum-based plays
- Increased winning probability by reducing entries during peaks
HMT v3.1:
Date: 31/12/2024
- Enhanced entry confirmation for improved reward-to-risk ratios
HMT v4.0:
Date: 05/01/2025
- Incorporated buying and selling pressure in lower timeframes to enhance the probability of trending moves while optimizing entry timing and scaling
HMT v4.1:
Date: 06/01/2025
- Enhanced take-profit (TP) target by incorporating market structure analysis
HMT v5 :
Date: 23/01/2025
- Refined wave analysis for trending conditions
- Incorporated lower timeframe (LTF) momentum to strengthen trend reliability
- Re-aligned and re-balanced entry conditions for improved accuracy
HMT v6 :
Date : 15/02/2025
- Integrated strong accumulation activity into in-depth wave analysis
HMT v7 :
Date : 20/03/2025
- Refined wave analysis along with accumulation and market sentiment
HMT v8 :
Date : 16/04/2025
- Fully restructured strategy logic
HMT v8.1 :
Date : 18/04/2025
- Refined Take Profit (TP) logic to be more conservative for improved win consistency
LMT v1.0 :
Date : 06/06/2025
- Rebranded to emphasize key levels + momentum as the core framework
LMT v2.0
Date: 11/06/2025
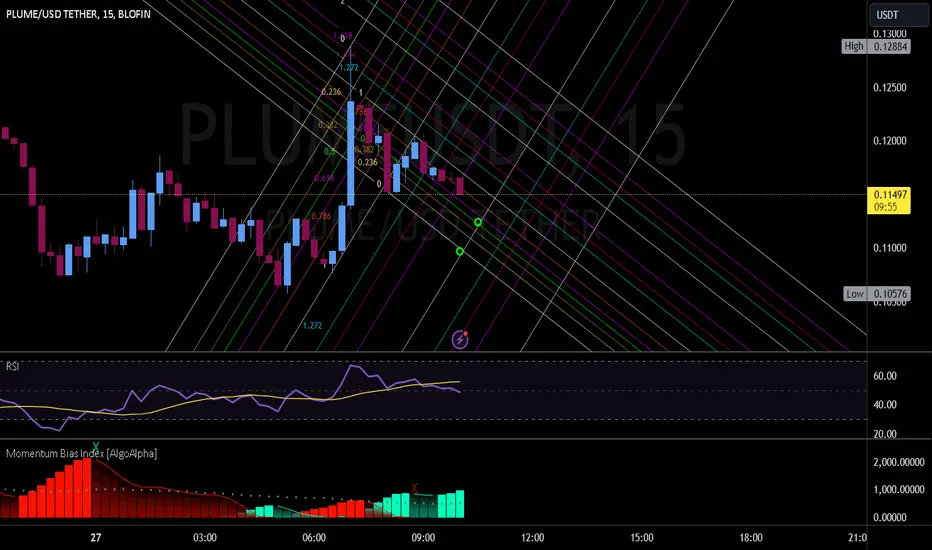
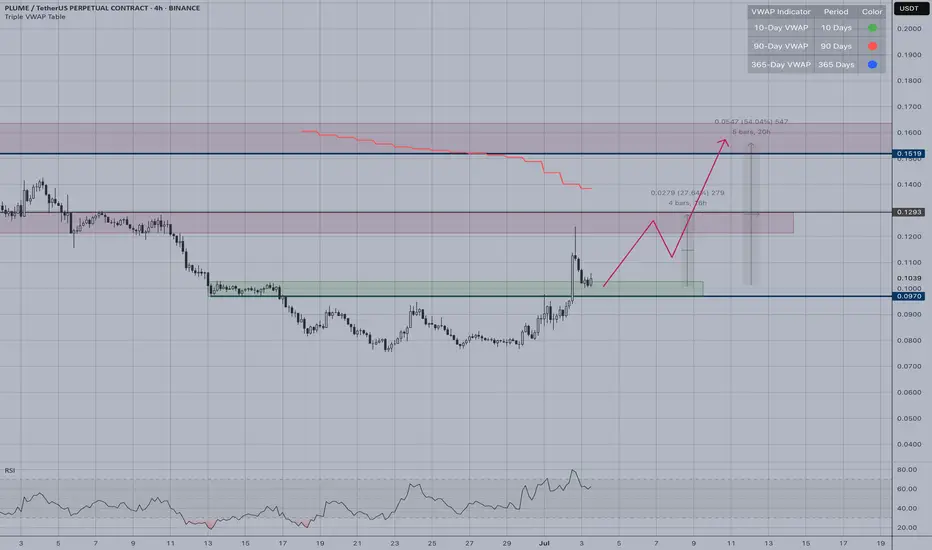
PLUME | Level to LevelPLUME is displaying a strong bullish pattern with a clear "level to level" trading structure. The chart shows:
Key Observations:
Price has successfully broken above the blue support zone around $0.097
Currently testing the next resistance level at $0.1293
The projected path (pink arrow) suggests continuation toward $0.1519 resistance
RSI shows healthy momentum above 50, indicating bullish strength
Trading Levels:
Current Support: $0.1000 (blue zone)
Next Target: $0.1519 (upper resistance)
Stop Loss: Below $0.097 support zone
Market Bias:
Bullish
The technical setup favors continued upward movement as price respects the established support and resistance levels. The breakout from the consolidation phase suggests buyers are in control.
Risk Consideration:
Watch for rejection at $0.1293 resistance - a failure to break could lead to a pullback toward the support zone.
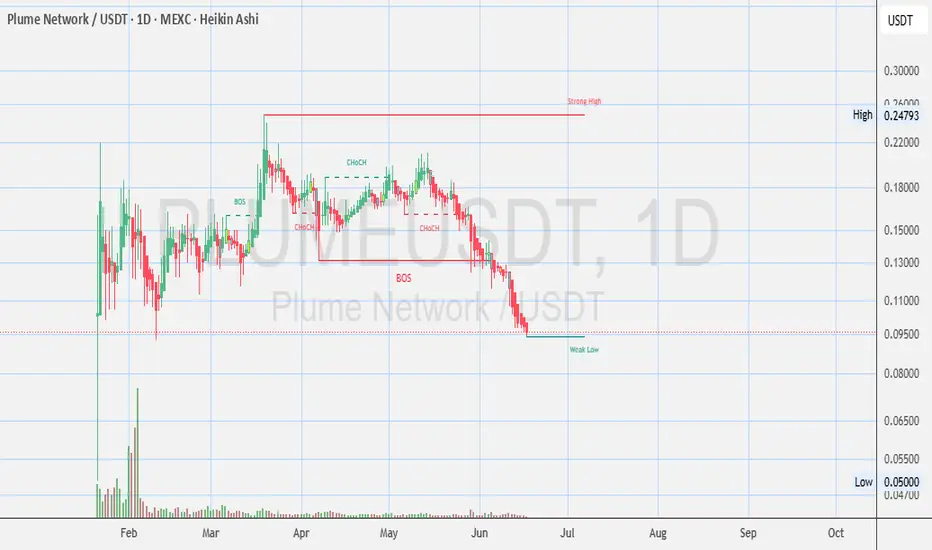
Plume Network $PLUME – Daily (1D) chart - Opinions? technical analysis of the Plume Network (PLUME/USDT) – Daily (1D) chart on MEXC with Heikin Ashi candles:
📉 Overview & Current Market Conditions
Price: ~$0.13566
Change: -2.17% (down today)
Chart Type: Heikin Ashi (smoothed candle view)
Trend: Clear downtrend in place since mid-May
Market Structure Tools: BOS, CHoCH, EQH, Weak/Strong Highs & Lows
🔍 Key Observations
📉 Trend Analysis
Primary Trend: Bearish
Lower highs and lower lows are clearly established.
Multiple Breaks of Structure (BOS) confirm continued downward momentum.
The recent Change of Character (CHoCH) attempts around late April and early May failed, indicating no sustained bullish control.
🟦 Support & Resistance Zones
Support (Weak Low): Around $0.095 – $0.096
Price is currently sitting at or just above this level.
If it breaks below, the next zone is likely $0.075 or even sub-$0.05
Resistance:
Nearest: ~$0.15 – $0.16 (former structure level)
Mid-range: ~$0.18 – $0.20 (clustered range rejections)
Major Resistance (Strong High): ~$0.24
📊 Volume Insight
Volume spikes are mostly associated with sell candles, particularly in the recent dump from ~$0.16 to ~$0.13.
Buy volume is not notable enough to suggest reversal strength.
⚠️ Risk Assessment
Weak low label suggests liquidity grab or potential for further drop.
No confirmed reversal signal.
Price could enter price discovery mode to the downside if $0.095 breaks convincingly.
🧭 Trading Scenarios
✅ Bullish Case (Speculative Reversal)
Hold above $0.095 + strong volume bounce = possible short-term reversal.
Confirmation needed through a CHoCH back above $0.15 and reclaim of market structure.
❌ Bearish Case (Dominant)
Breakdown below $0.095 with volume = likely continuation to next liquidity pocket below $0.075
No major support levels visible until historical lows.
📝 Summary for Plume Network (PLUME/USDT)
Plume Network (PLUME) remains in a strong bearish trend, now testing a critical weak support zone around $0.095. Despite earlier bullish structure changes, sellers have regained control since May. If the current support breaks, price could explore significantly lower levels. Buyers must wait for a clear structure shift and volume confirmation before considering upside potential.
--
Disclosures:
This analysis is for informational purposes only and is not financial advice. It does not constitute a recommendation to buy, sell, or trade any securities, cryptocurrencies, or stocks. Trading involves significant risk, and you should consult with a qualified financial advisor before making any investment decisions. Past performance is not indicative of future results.
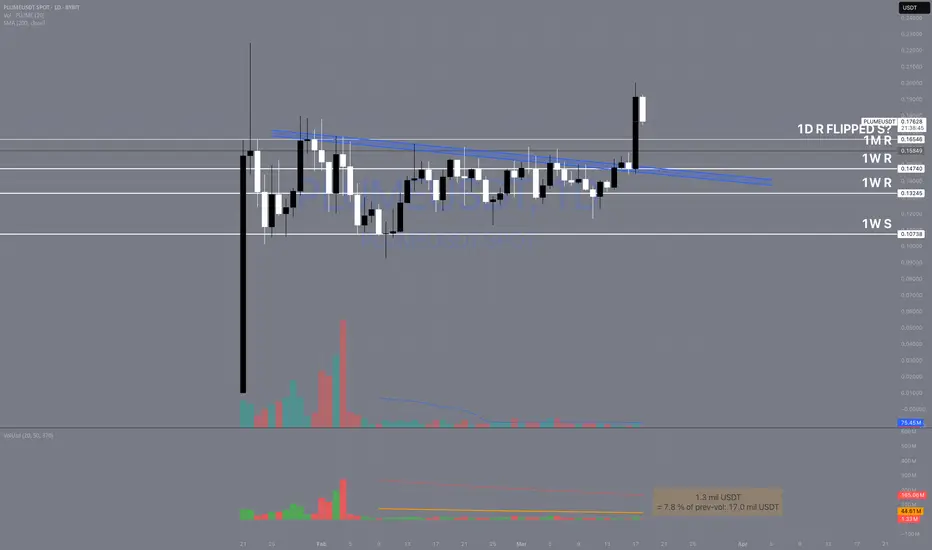
PLUME - Plume Network Daily ChartPlume Network (PLUME/USDT) on the 1D Heikin Ashi chart is currently trading at $0.17229, showing a modest gain of +1.05%.
The market is consolidating just above a critical demand zone around $0.155, which has acted as a floor multiple times, marked by CHoCH (Change of Character) events.
The price action remains range-bound between the $0.15 support and the $0.19–$0.20 resistance area, with weak bullish attempts failing to break the overhead structure.
A key observation is the bullish divergence forming on the Stochastic RSI — while price has retested the lows, the oscillator is curving up from oversold territory.
This suggests potential exhaustion in bearish momentum. Volume remains relatively low, indicating sellers are not aggressively pushing lower, which further supports the likelihood of a short-term bounce.
If bulls can hold the $0.155 support and push past the minor CHoCH resistance, the next target could be the $0.20 zone, followed by a breakout toward the $0.247 weak high.
On the downside, a breakdown below $0.155 would expose the next major support around $0.1086 (marked as Weak Low), which could trigger a steeper correction.
Overall, the market shows early signs of a potential reversal, but confirmation is needed via a strong bullish candle and a volume uptick.
SQRB $100K on PROBIT
$RNB $310K
$HTS $1.9M
$STBU $3.5M
LAND $3.6M
-----
Not for recommendations to BUY SELL any stocks, cryptos, FX or securities
Not for Financial Advise
DYOR

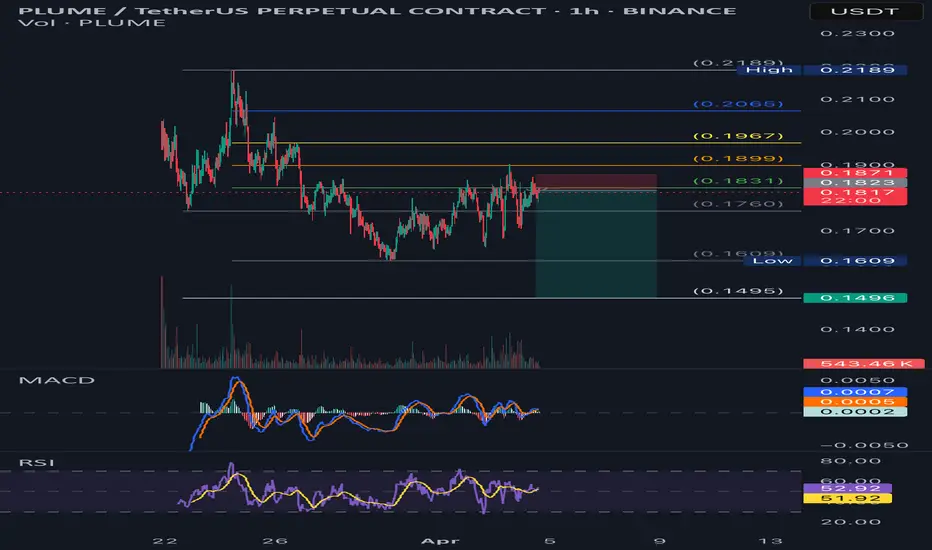
PLUMEUSDT.P ShortPLUMEUSDT.P Short
Entry - 0.1823
Quick Target - 0.1721
Final TP - 0.1495
#DYOR #TYOR
Use low margin and leverage only!
Happy trading!
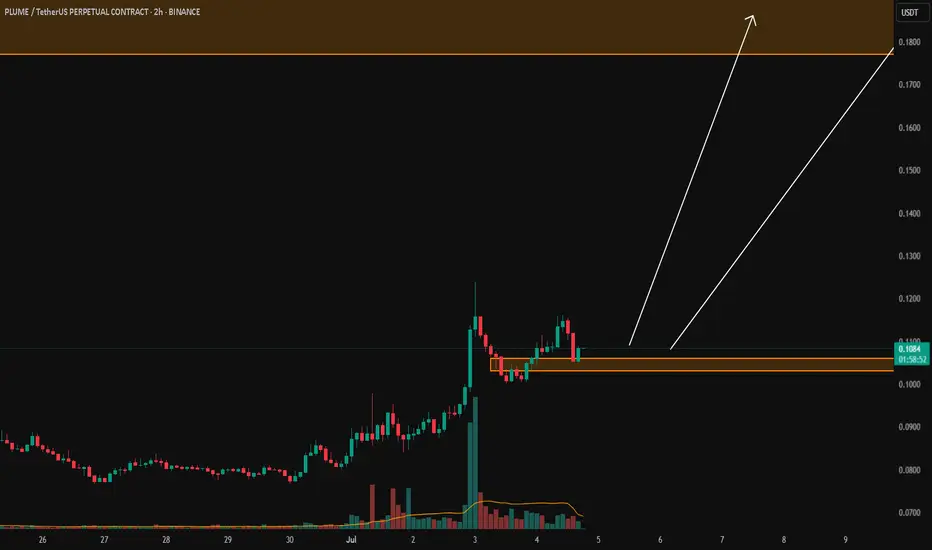
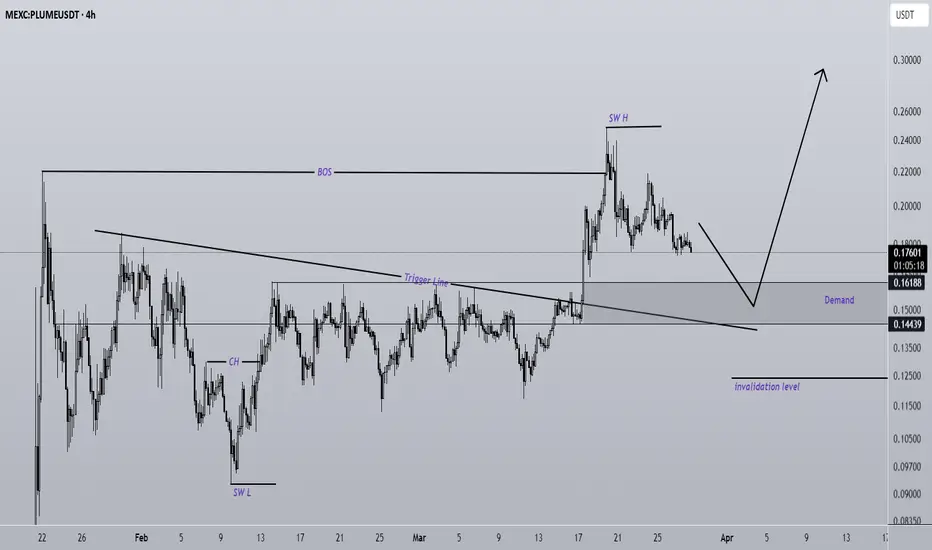
PLUME looks bullish (4H)A key trigger level has been broken, followed by a strong upward move.
The structure is bullish. We will look for buy/long positions in areas with high trading volume.
A daily candle closing below the invalidation level will invalidate this analysis.
Do not enter the position without capital management and stop setting
Comment if you have any questions
thank you
Trade idea- PLUMEUSDTPLUME has been resilient throughout the bearish phase of January end to March. It has partened with major players of industry including ONDO. Recently CZ also tweeted about it. With RWA Sector gaining momentum this can be the next great play with mcap below 400M. Target at least 5x from current price with resistance shown in the chart. #BITCOIN #RWA #BKACKROCK

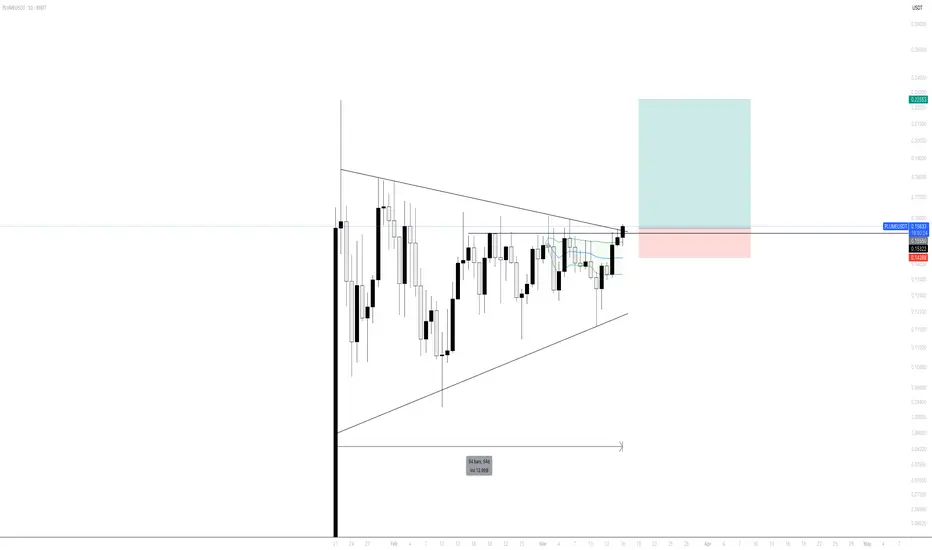
PLUME 1D: Breakout After 54-Day ConsolidationPLUME has finally broken out of a 54-day consolidation phase on the daily timeframe, forming a clear triangle pattern. This breakout could signal the start of a new upward trend, making it an interesting spot market buy opportunity. Are you watching PLUME? Let’s discuss the potential! Share your thoughts below!
DO NOT FOMO IN HERE$PLUME just announced a partnership with Binance Labs, but this bad news, let me explain.
This announcement happens to come just 4 days before a token unlock of over 100 Million $PLUME and what makes it worse it that they have token unlocks every month on the 21st, which doubles from July onwards.
This is why you should never just FOMO in or buy a massive green candle, if you don't know the full story.
It is common for VCs to engineer exit liquidity so that they have a broad market to sell on.
Your job is to become smart enough to avoid this and not be exit liquidity!
For more follow my page!
PLUME looking for a breakout. PLUME is looking for a breakout of a symmetrical triangle. Technically it is a continuation pattern and given that the price is about 70% towards the structure's apex, it is likely to get a breakout soon. Momentum is also trending upwards.
Goons are accumulating within the volume range in preparation.

Hopefully price breaks through the trend line to the upside There seems to be a descending trend line. If price can break through then we can hope for some more upward price action. Good luck

PLUME (EXPERIMENTAL)$PLUME is a public blockchain optimized for the rapid adoption and demand-driven integration of real world assets (RWAs). We recognize that the core driver of the RWA revolution is tangible demand, particularly for yield-bearing assets that offer stability, transparency, and income generation.

PLUME an RWA new leader!
This is a promising coin!
It has formed a mini cup&handle!
From a technical point of view the price has broken the 0,16$ level which was a major turning point, a kind of rotation pivot.
We are watching closer how this coin will react with the overall crypto momentum.
The first possible potential target is around 0.23 and the second we aim to go is around 0.33$ level.
but if the industry - momentum and volumes will sustain the price action, we could see this coin going around 0,7$ - 1$
hey, let's see ;-)
good trading!!
TARGET PRACTICEif i can pinpoint where i will limit order pickup this asset in the future is that impressive?