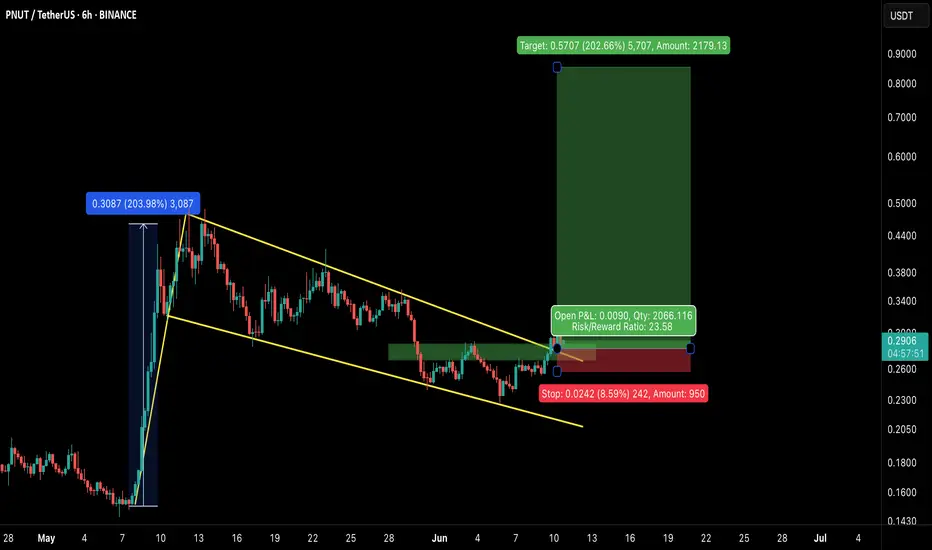
PNUT/USDT – Bullish Breakout from Falling Channel!PNUT Breakout Alert – 200% Potential on the Table
Hey Traders — if you're into high-conviction setups with real momentum, this one’s for you.
PNUT has officially broken out of a textbook falling channel after a healthy consolidation. This pattern often signals trend reversal and renewed bullish mo
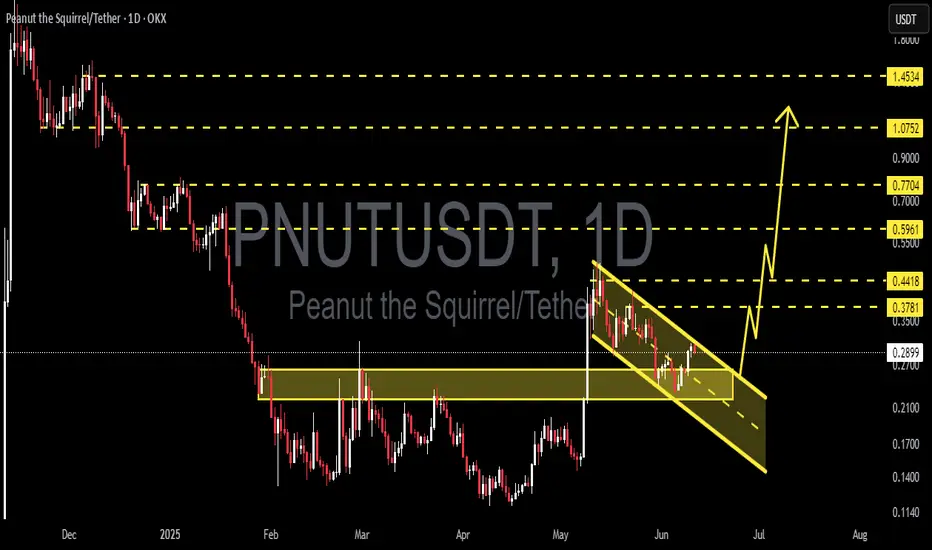
PNUTUSDT 1D Analysis PNUT ~ 1D Analysis
#PNUT Buy when retesting this support block or buy after successfully breaking this resistance line with a short-term target of at least 15%++
$PNUT/USDT Breakout Trade Setup$PNUT / USDT - Breakout Trade Setup.
Entry: $0.2963 - $0.3002
Stop Loss: $0.2682
Targets: $0.3603 / $0.4305 / $0.4891
Breakout & retest of descending trendline
60 %+ upside potential
DYOR | NFA

$PNUT in Freefall – Can $0.20 Hold as Support?$PNUT is dropping like a falling knife!🚨
Technically, we have support around $0.22 and $0.20.
According to the Fibonacci levels, the 0.786 level may
act as strong support near $0.20, making that area a key zone to watch.
So unless this support range is reached, the price may continue to drop tow
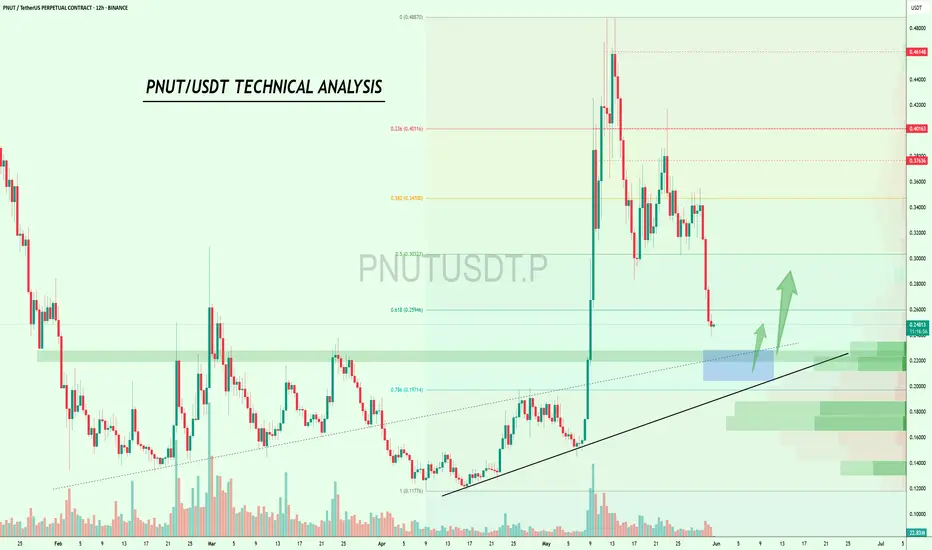
PNUT - LONG SET-UPBINANCE:PNUTUSDT
𝐏𝐍𝐔𝐓/𝐔𝐒𝐃𝐓
PnuT is forming a bullish base above support and pushing against descending trendline resistance. A breakout above $0.3275 could ignite a 100% move higher. Setup looks clean and coiled

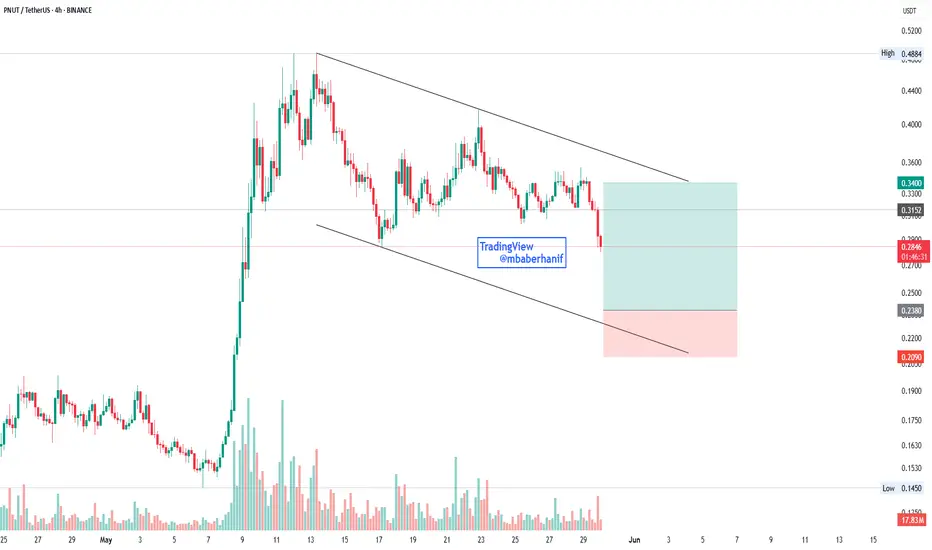
PNUT/USDT (4H) – Bull Flag Breakout Setup PNUT/USDT (4H) – Bull Flag Breakout Setup
Pattern: Bull Flag 📉📈
Timeframe: 4-Hour ⏱️
Pair: PNUT/USDT 💱
Published: June 10, 2025 📅
Technical Overview:
PNUT/USDT is forming a classic bull flag on the 4-hour chart following a strong impulsive rally. The price has been consolidating inside a descend

PNUT | Is This A Flag Pattern?PNUT shows a descending channel pattern, indicating a downtrend. The price recently broke below mid-channel support and is currently trading at $0.2839, down 3.11%. The descending trendlines suggest continued bearish pressure. A long position is marked on the chart, with an entry near the current le
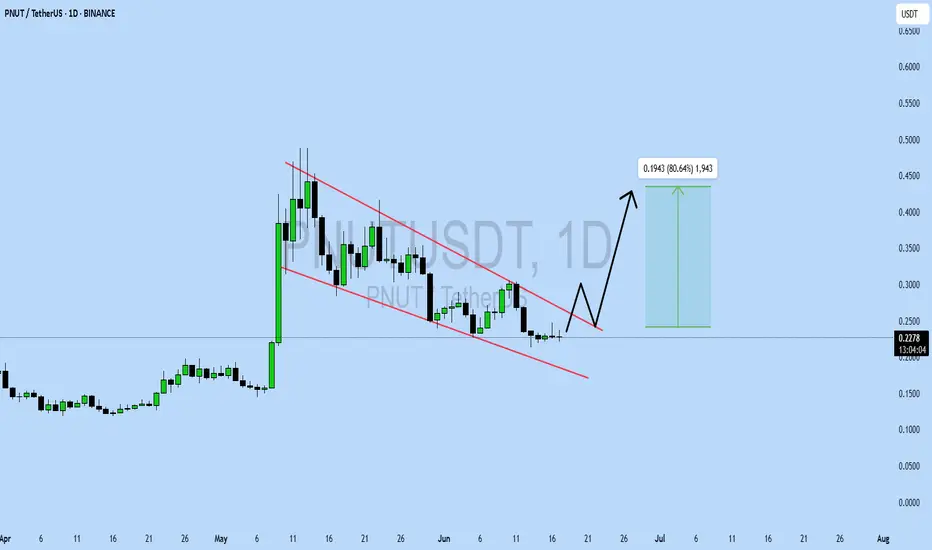
PNUTUSDT UPDATEPattern: Falling Wedge
Current Price: $0.2276
Target Price: $0.42
Target % Gain: 80.64%
Technical Analysis: PNUT is forming a falling wedge on the 1D chart, showing signs of a potential breakout. A breakout above the wedge resistance could trigger an 80% move. Monitor volume and candle structure
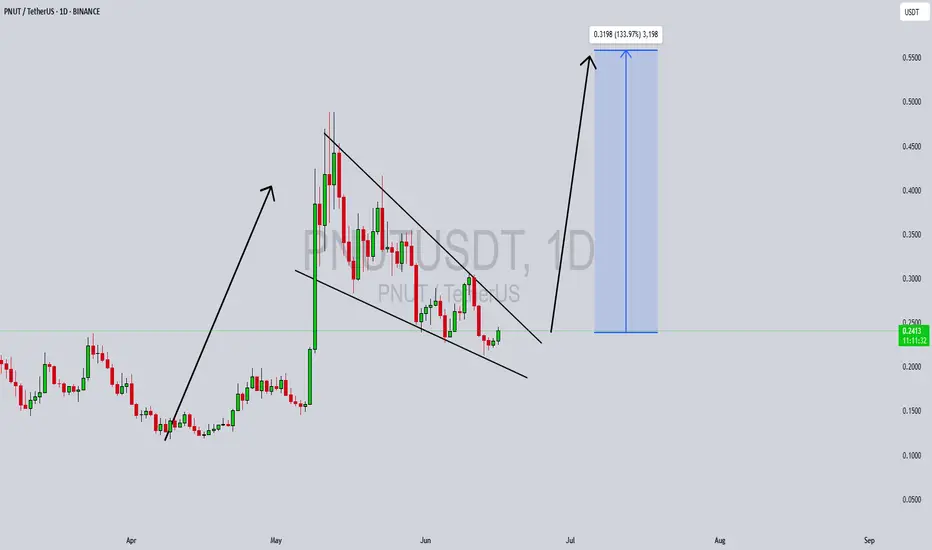
PNUTUSDT Forming Falling WedgePNUTUSDT is presenting a compelling falling wedge pattern, signaling a high-probability bullish reversal. This technical formation typically occurs after a sustained downtrend and is characterized by converging trendlines sloping downward. In the case of PNUTUSDT, the wedge is nearing its apex, indi
See all ideas
Summarizing what the indicators are suggesting.
Oscillators
Neutral
SellBuy
Strong sellStrong buy
Strong sellSellNeutralBuyStrong buy
Oscillators
Neutral
SellBuy
Strong sellStrong buy
Strong sellSellNeutralBuyStrong buy
Summary
Neutral
SellBuy
Strong sellStrong buy
Strong sellSellNeutralBuyStrong buy
Summary
Neutral
SellBuy
Strong sellStrong buy
Strong sellSellNeutralBuyStrong buy
Summary
Neutral
SellBuy
Strong sellStrong buy
Strong sellSellNeutralBuyStrong buy
Moving Averages
Neutral
SellBuy
Strong sellStrong buy
Strong sellSellNeutralBuyStrong buy
Moving Averages
Neutral
SellBuy
Strong sellStrong buy
Strong sellSellNeutralBuyStrong buy
Displays a symbol's price movements over previous years to identify recurring trends.