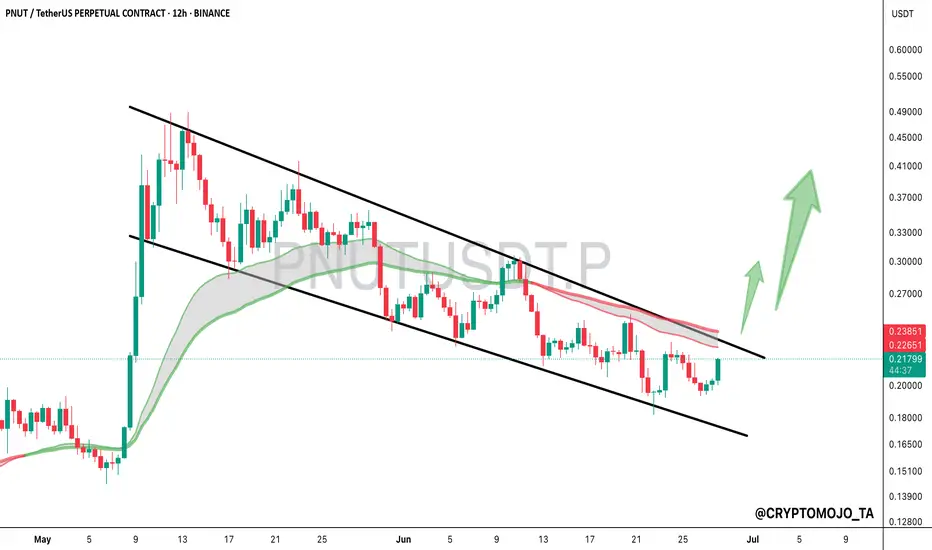
$PNUT Bull Flag in Play, Breakout Loading?$PNUT is forming a clean bull flag on the 12H chart after a strong move up in early May.
Price is respecting the flag structure and just bounced from the lower boundary.
A breakout above $0.238 could trigger the next leg toward $0.35, nearly 60% potential upside.
Momentum building.
Flag breakout in
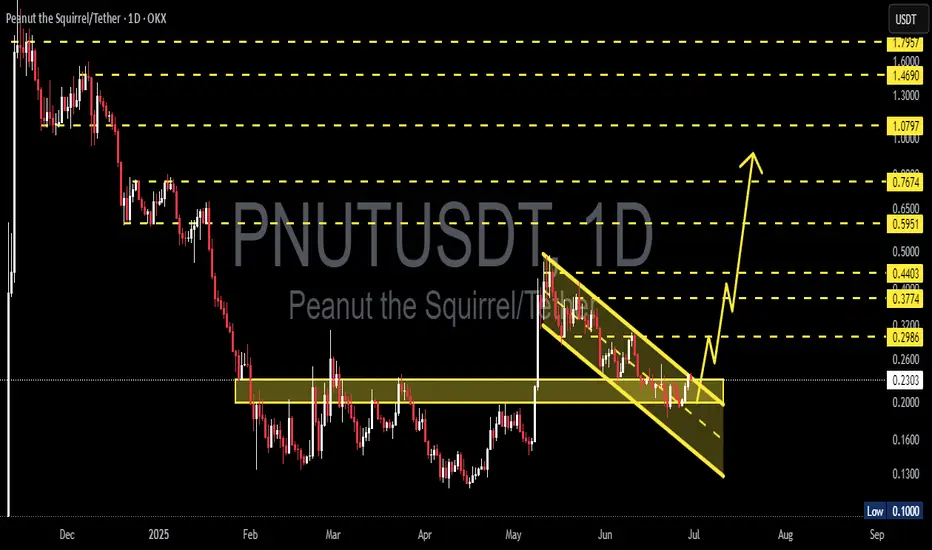
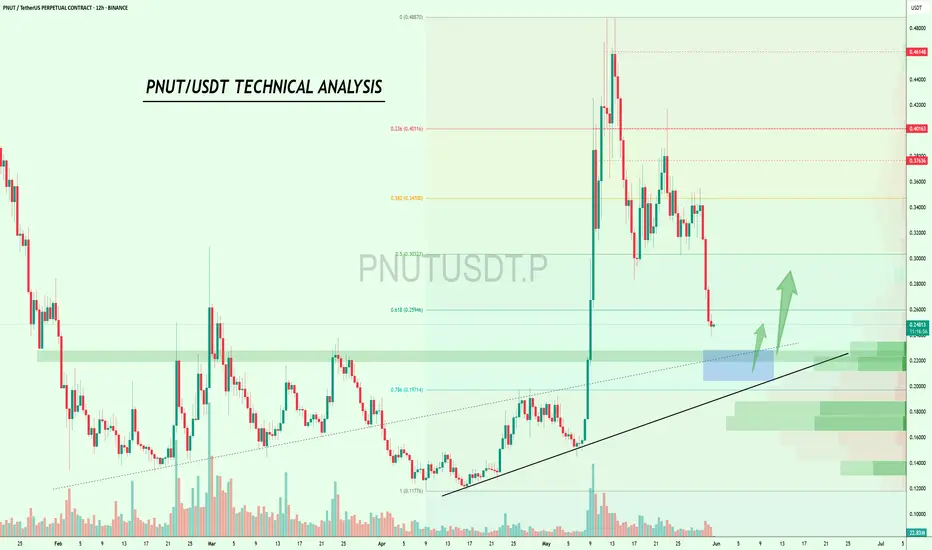
Falling Channel Breakout on PNUT/USDT – Next Stop: $0.76?📊 Pattern Analysis:
Falling Channel (Descending Channel): PNUT formed a clear falling channel from early May to late June 2025. This pattern typically signals a potential bullish reversal once a breakout occurs.
Confirmed Breakout: The price has successfully broken above the upper boundary of the
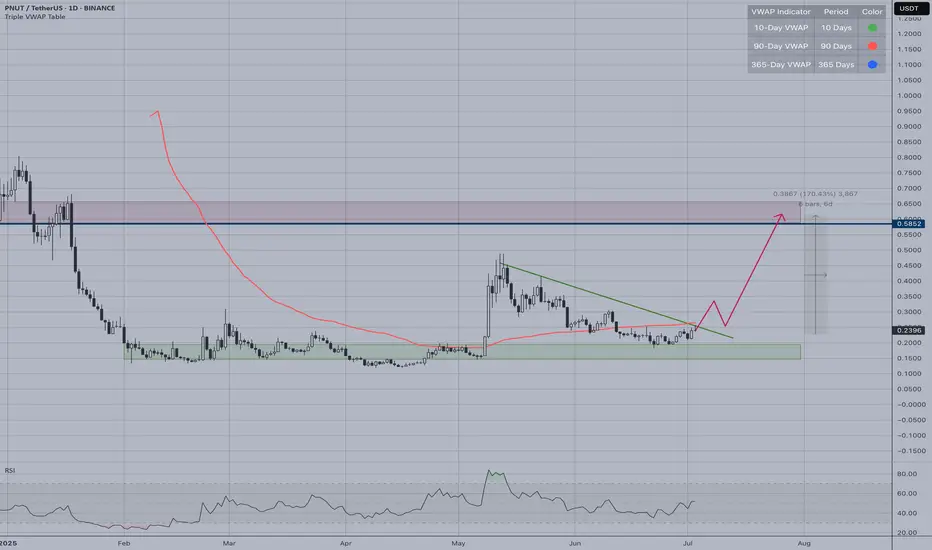
PNUT | Meme Mania Soon?PNUT/USDT presents a compelling bullish setup on the daily timeframe. The price has been consolidating within a strong support zone (green box) and is now approaching two critical breakout levels:
Key Technical Factors:
- Price trading near descending trendline resistance
- 90-day VWAP (red line)
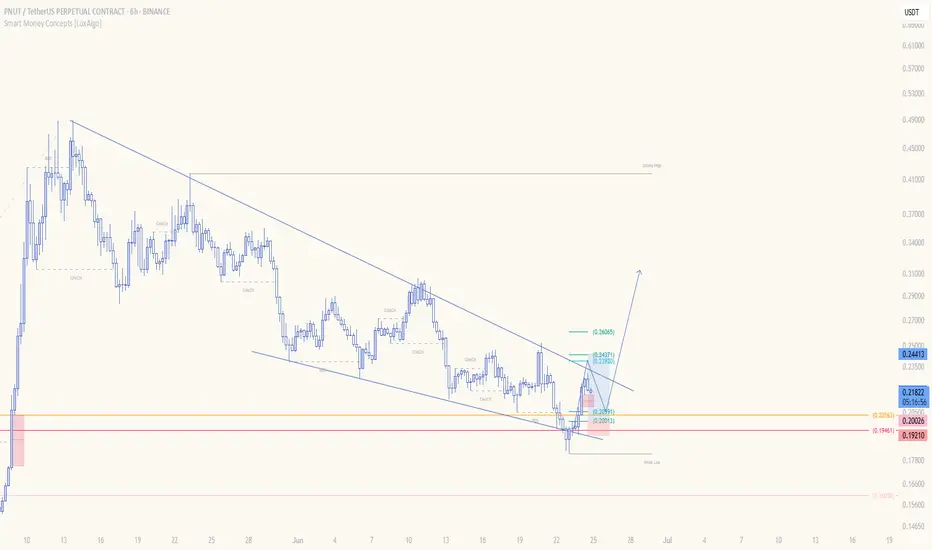
PNUTUSDT Forming Falling Wedge — Breakout Incoming?NUTUSDT is forming a falling wedge pattern, a classic bullish reversal setup. Price action is tightening, and if momentum builds, a breakout to the upside could follow. Traders are watching closely to see if PNUT can break resistance and push toward higher targets, signaling a potential trend shif
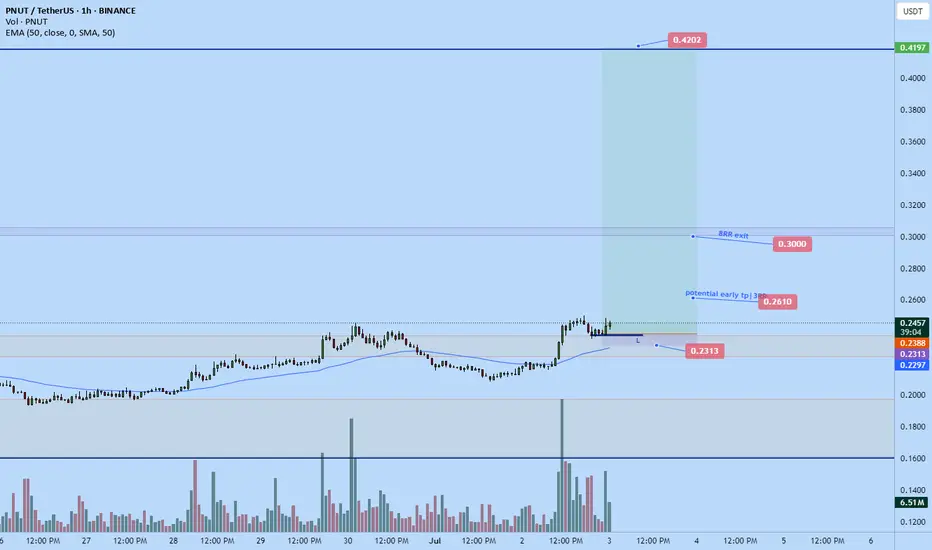
PNUT BIG BIG LONGTIme sensitive. whales are accumulating pnut, about to take off.
Based on my analysis we could pump as high as 0.42 but for today am just aiming for $0.3 which is roughly 8 RR from my entry. More than happy with that
Manage risk if following long though one could size up a little on this setup as
PNUT/USDT – Breakout Watch from Symmetrical TrianglePNUT/USDT – Breakout Watch from Symmetrical Triangle
Chart pattern: Symmetrical Triangle
Timeframe: 4-Hour
Published: June 20, 2025
PNUT/USDT is nearing the apex of a symmetrical triangle that has been forming over several weeks. The price is tightening between rising support and descending resista

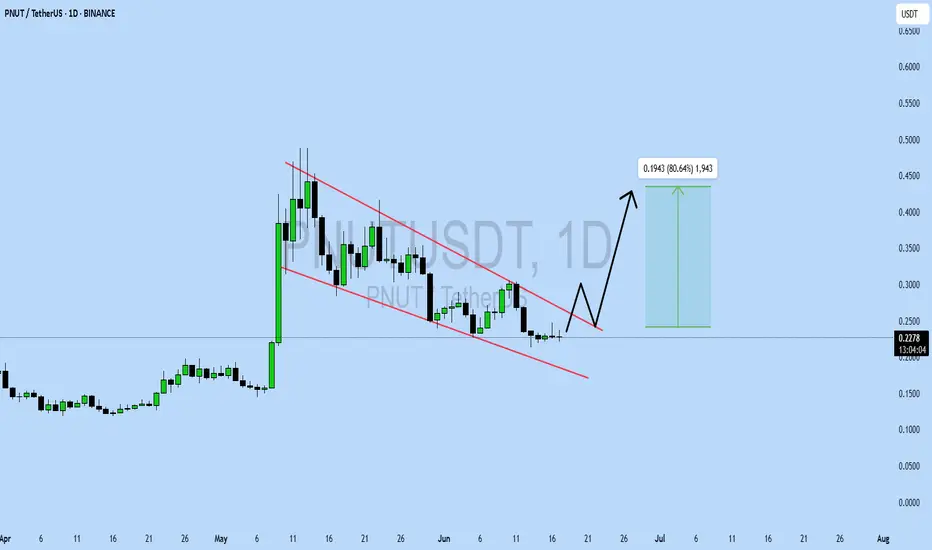
PNUTUSDT UPDATEPattern: Falling Wedge
Current Price: $0.2276
Target Price: $0.42
Target % Gain: 80.64%
Technical Analysis: PNUT is forming a falling wedge on the 1D chart, showing signs of a potential breakout. A breakout above the wedge resistance could trigger an 80% move. Monitor volume and candle structure
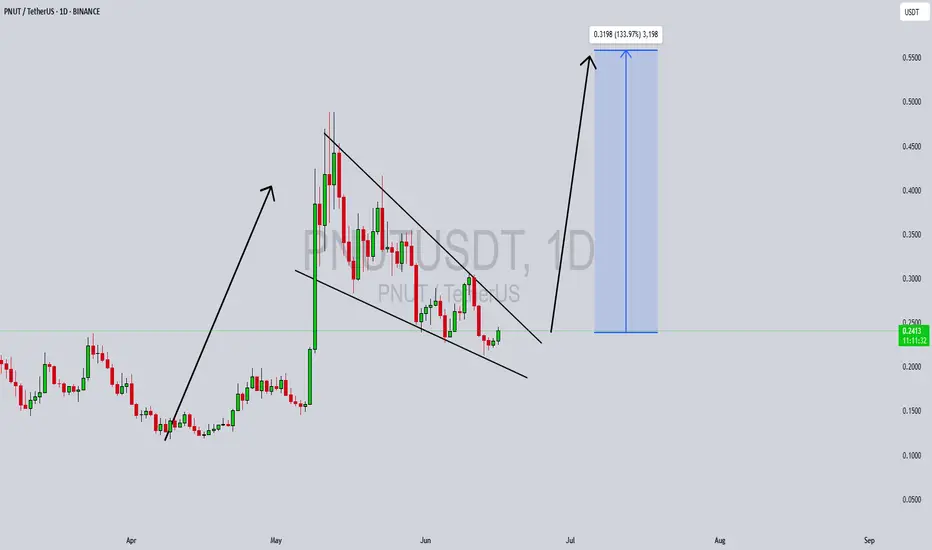
PNUTUSDT Forming Falling WedgePNUTUSDT is presenting a compelling falling wedge pattern, signaling a high-probability bullish reversal. This technical formation typically occurs after a sustained downtrend and is characterized by converging trendlines sloping downward. In the case of PNUTUSDT, the wedge is nearing its apex, indi
$PNUT/USDT Breakout Trade Setup$PNUT / USDT - Breakout Trade Setup.
Entry: $0.2963 - $0.3002
Stop Loss: $0.2682
Targets: $0.3603 / $0.4305 / $0.4891
Breakout & retest of descending trendline
60 %+ upside potential
DYOR | NFA

$PNUT in Freefall – Can $0.20 Hold as Support?$PNUT is dropping like a falling knife!🚨
Technically, we have support around $0.22 and $0.20.
According to the Fibonacci levels, the 0.786 level may
act as strong support near $0.20, making that area a key zone to watch.
So unless this support range is reached, the price may continue to drop tow
See all ideas
Summarizing what the indicators are suggesting.
Oscillators
Neutral
SellBuy
Strong sellStrong buy
Strong sellSellNeutralBuyStrong buy
Oscillators
Neutral
SellBuy
Strong sellStrong buy
Strong sellSellNeutralBuyStrong buy
Summary
Neutral
SellBuy
Strong sellStrong buy
Strong sellSellNeutralBuyStrong buy
Summary
Neutral
SellBuy
Strong sellStrong buy
Strong sellSellNeutralBuyStrong buy
Summary
Neutral
SellBuy
Strong sellStrong buy
Strong sellSellNeutralBuyStrong buy
Moving Averages
Neutral
SellBuy
Strong sellStrong buy
Strong sellSellNeutralBuyStrong buy
Moving Averages
Neutral
SellBuy
Strong sellStrong buy
Strong sellSellNeutralBuyStrong buy
Displays a symbol's price movements over previous years to identify recurring trends.