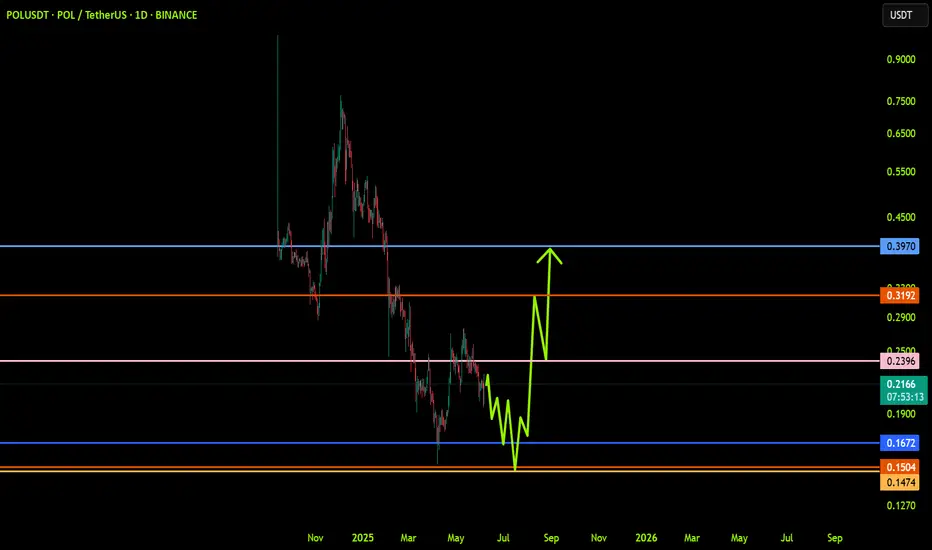
POLUSDT: Trend in daily timeframeThe color levels are very accurate levels of support and resistance in different time frames, and we have to wait for their reaction in these areas.
So, Please pay special attention to the very accurate trend, colored levels, and you must know that SETUP is very sensitive.
Be careful
BEST
MT
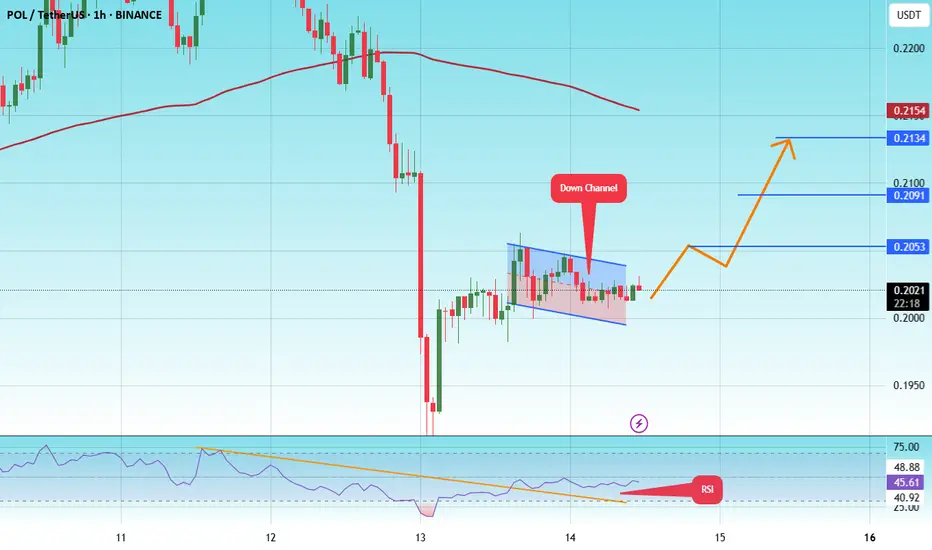
#POL/USDT#POL
The price is moving within a descending channel on the 1-hour frame and is expected to break and continue upward.
We have a trend to stabilize above the 100 moving average once again.
We have a downtrend on the RSI indicator, which supports the upward move by breaking it upward.
We have a s
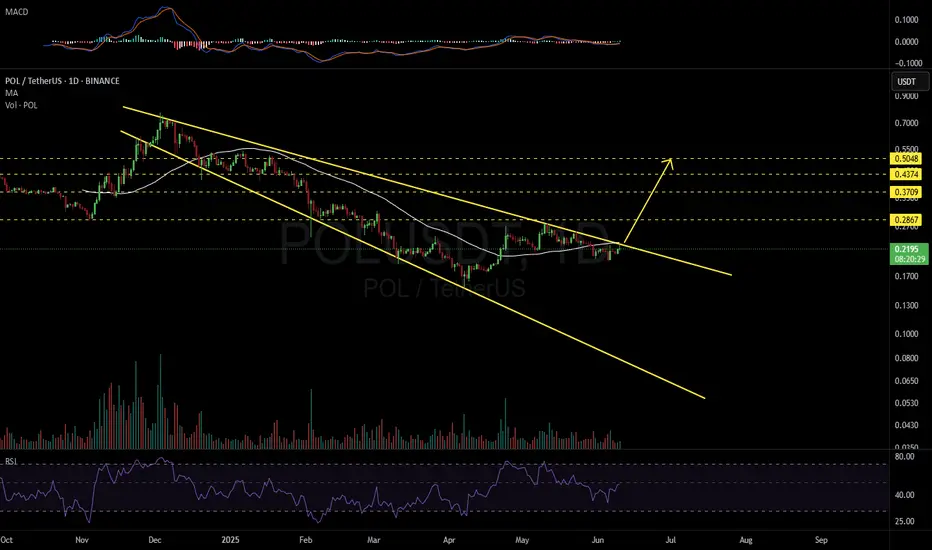
POLUSDT 1D#POL — Bullish Setup on Watch 🔍
#POL is currently moving inside a Descending Broadening Wedge on the daily chart, signaling a potential bullish reversal.
A breakout above the wedge resistance and the daily MA50 could spark a strong upward move. Key targets after breakout:
🎯 $0.2867
🎯 $0.3709
🎯 $0.
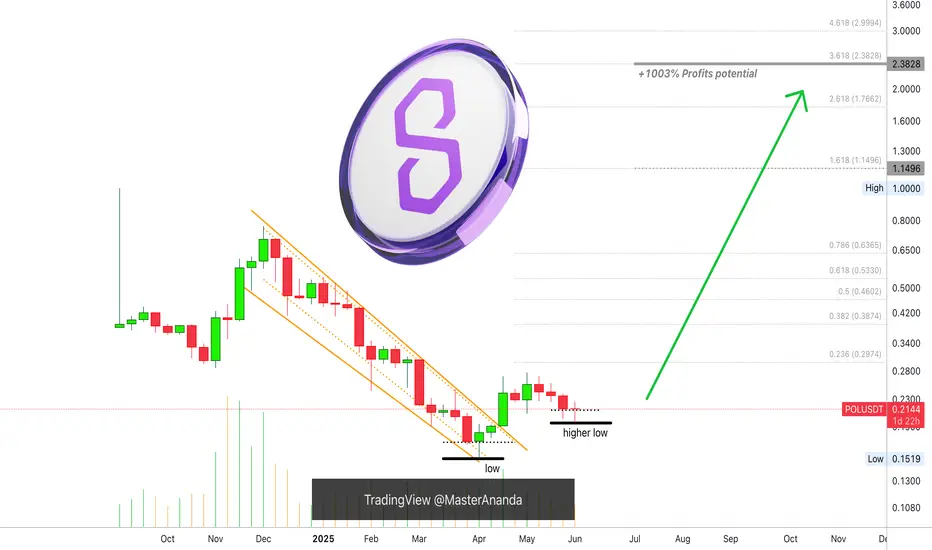
Polygon, Higher Low? Easy 1,000% Profits PotentialFour weeks red! Do you really believe the market will continue moving lower? If the answer is yes; think twice, stop! Think again.
Four weeks red is all that you will get you bearish bastard.
Your time is over. We are taking over, the bulls are entering the game.
You had your fun, you had it for
Polygon (POL): Entering Good Buying Opportunity | June 2025POL coin is entering a good buying opportunity area where we are looking for some good R:R trades that can be taken both on Daily and Hourly timeframes.
More in-depth info is in the video—enjoy!
Swallow Academy

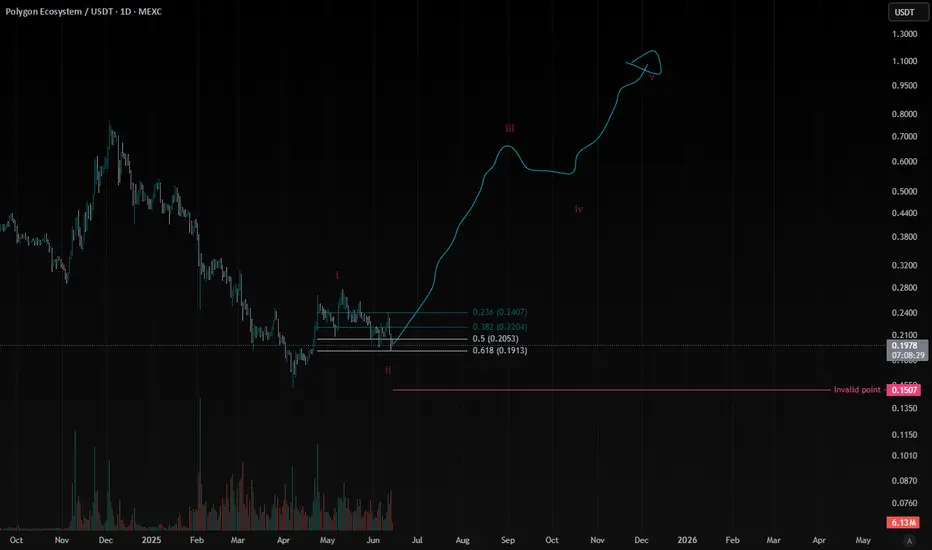
POL Coin Alert: Big Move Incoming!As an analyst, I've identified the completion of Waves 1 & 2 of a major uptrend. Get ready for an explosive Wave 3 in POL!
This looks like a prime accumulation zone, with profit targets eyeing $0.80 to $1.00. My invalidation for this count is $0.15.
Disclaimer: This is my personal Elliott Wave ana
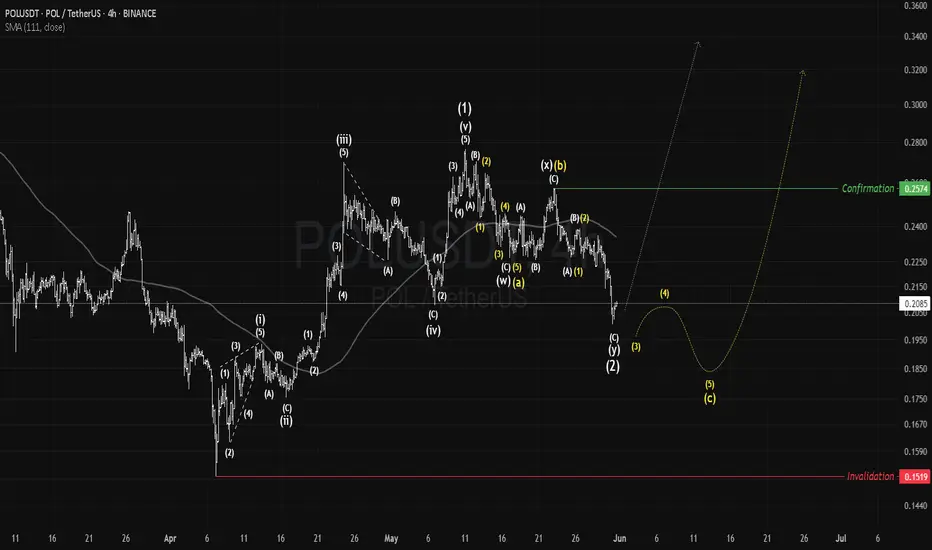
POL: Ideal Bullish SetupDuring early April to mid-May, #POL had one of the strongest bullish rises among top-tier projects.
The ongoing correction appears to be a healthy pullback before the next major leg up.
Holding above $0.15 keeps the setup valid. Passing $0.257 confirms a new rally.
#Polygon
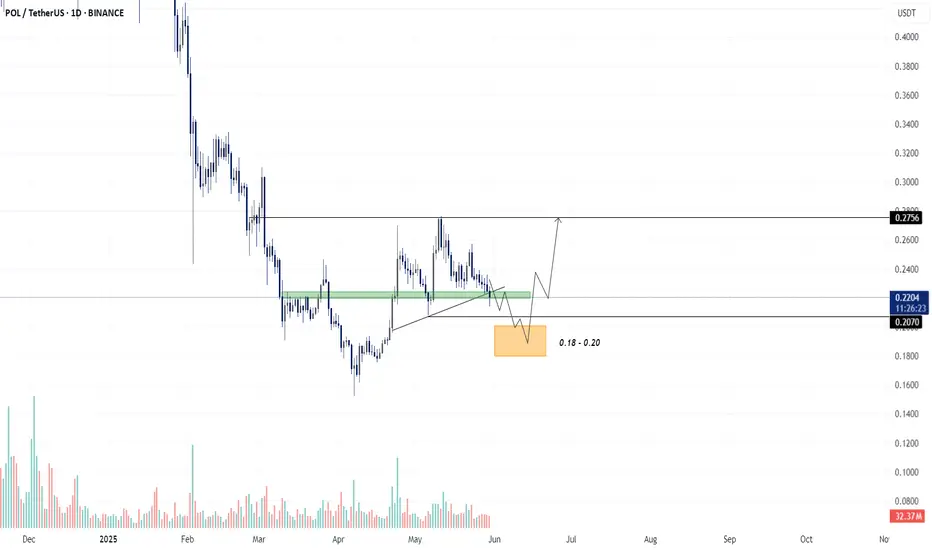
PoL - Long Set-UPBINANCE:POLUSDT
Current Price: ~$0.2207
Support Zone: $0.18 – $0.20 (highlighted in orange)
SL Below: 0.16
Target - 0.22 , 0.25++
Structure: Price recently broke below a trendline and retested a previous support-turned-resistance (green zone).
Volume: Decreasing, suggesting weakening bearish m
Polygon (POL): Good Long Opportunity | May 2025Polygon has done a nice 10% movement since last time, where currently we are seeing yet again the dominance from the buyers. It will be an interesting opportunity that we might be taking soon!
More in-depth info is in the video—enjoy!
Swallow Academy

POL USDT SHORT TRADE SETUPPOL/USDT is currently testing a strong resistance zone , with a high probability of a downward price move. Additionally, the 100 EMA is acting as a significant resistance.

See all ideas
Summarizing what the indicators are suggesting.
Oscillators
Neutral
SellBuy
Strong sellStrong buy
Strong sellSellNeutralBuyStrong buy
Oscillators
Neutral
SellBuy
Strong sellStrong buy
Strong sellSellNeutralBuyStrong buy
Summary
Neutral
SellBuy
Strong sellStrong buy
Strong sellSellNeutralBuyStrong buy
Summary
Neutral
SellBuy
Strong sellStrong buy
Strong sellSellNeutralBuyStrong buy
Summary
Neutral
SellBuy
Strong sellStrong buy
Strong sellSellNeutralBuyStrong buy
Moving Averages
Neutral
SellBuy
Strong sellStrong buy
Strong sellSellNeutralBuyStrong buy
Moving Averages
Neutral
SellBuy
Strong sellStrong buy
Strong sellSellNeutralBuyStrong buy
Displays a symbol's price movements over previous years to identify recurring trends.