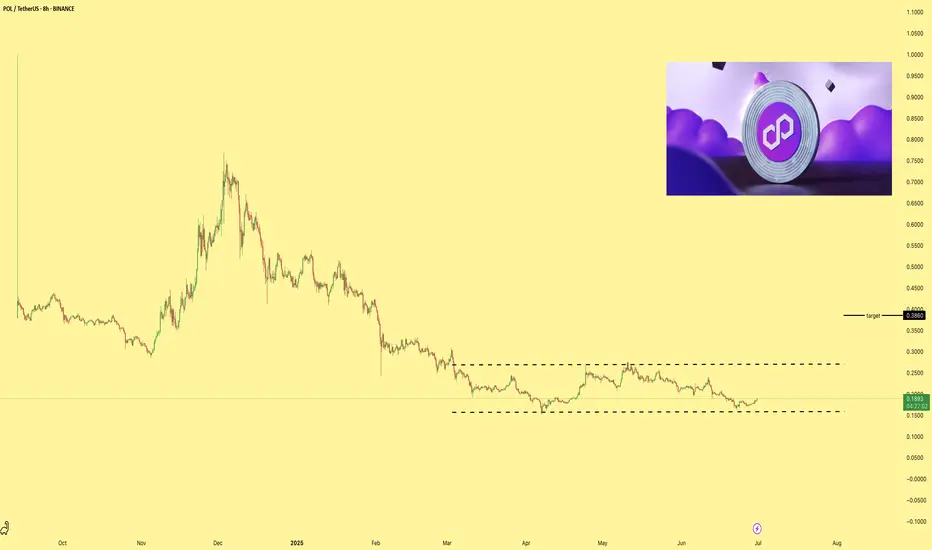
POLPSX:POL has a potential 100% gain from the current price. Right now it is trading inside a horizontal channel which signals accumulation. Expect a strong breakout soon.
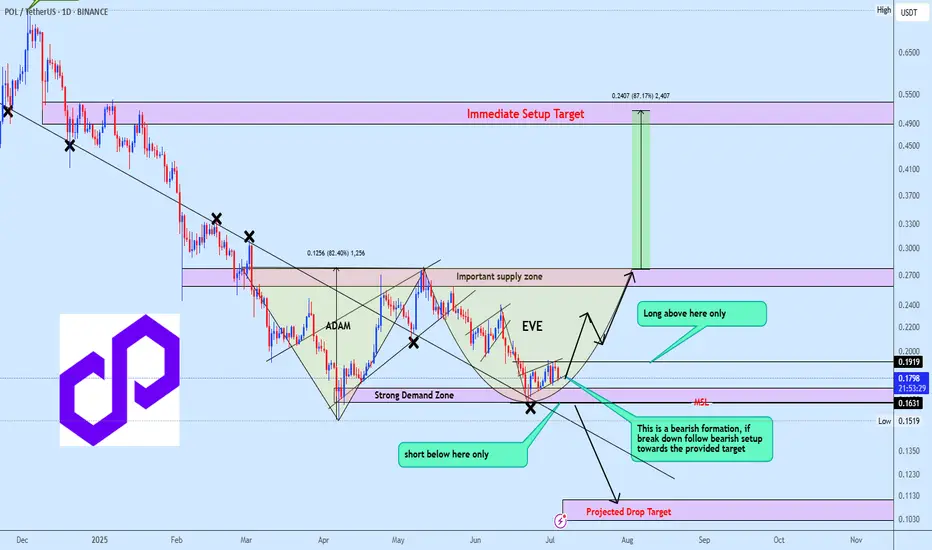
POLUSDT reversal time or bearish ContinuationPOLUSDT is currently shaping a potential Adam and Eve formation, with price consolidating inside a mini bearish flag. A breakdown from the flag would invalidate the bullish setup and likely trigger a continuation toward the projected downside target.
However, if the strong demand zone holds, we cou
Trading plan for Polygon this weekLet's try a new format for ideas. If you like it, I'll post my ideas more often.
BINANCE:POLUSDT This week, we might see a breakout of the local low and a retest of the weekly pivot point, after which we could expect a rise toward resistance number 2
Consider your risks
Wish you successful trad
Polygon (POL): Reaching Re-Test Area | Looking For Sharp MovePolygon coin (previously MATIC) might be in some trouble, where we are seeing high chances of volatile movement to come in the next days. While price is seeing a decline and approaching the retest zone, we are looking for a possible downward movement from here.
Seeing historically how CME gaps hav
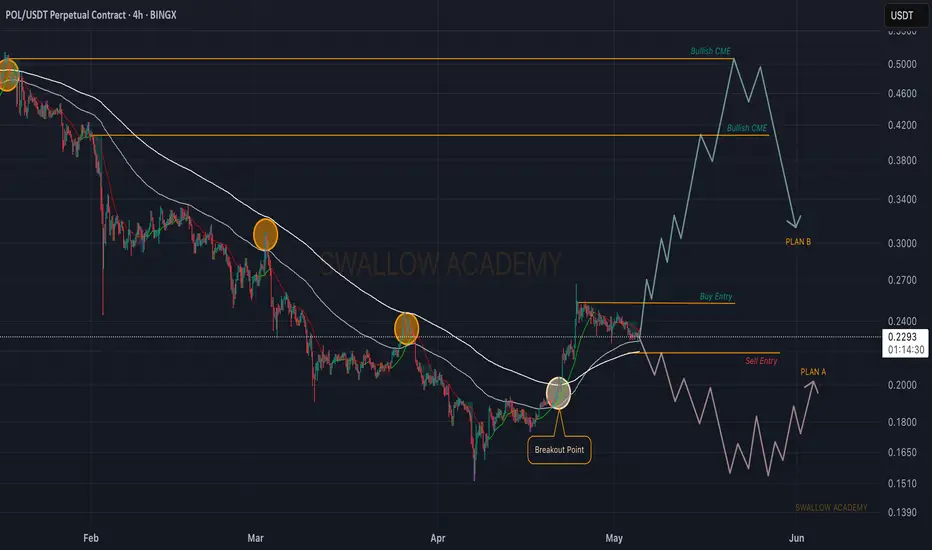
Polygon (POL): Caught 3 Good Potential Trades That Can Be Taken!POL coin will most probably see a breakout soon but we are seeing 2 more trades that can be taken before the breakout happens!
More in-depth info is in the video—enjoy!
Swallow Academy

Polygon (POL): Good Long Opportunity | May 2025Polygon has done a nice 10% movement since last time, where currently we are seeing yet again the dominance from the buyers. It will be an interesting opportunity that we might be taking soon!
More in-depth info is in the video—enjoy!
Swallow Academy

Polygon (POL): Seeing Opportunity For Long Position | Good R:RPolygon coin is showing a strong buy zone for us where we are looking for a buy entry near the current region, which could give us a nice 25% of market price movement from here.
More in-depth info is in the video—enjoy!
Swallow Academy

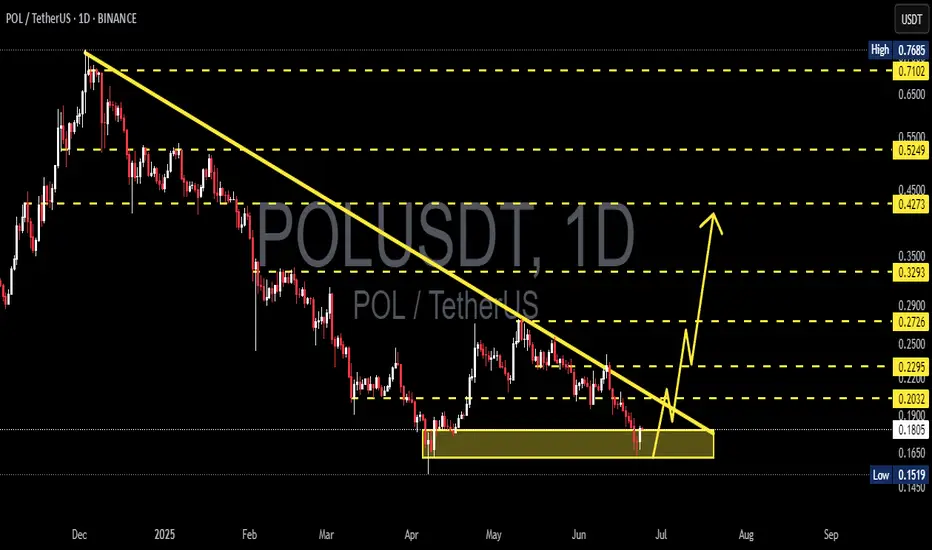
POLUSDT 1D AnalysisPOL ~ 1D Analysis
#POL This coin is currently at its lowest support. Buy if you still have confidence in this coin with a short term target of at least 15%+ from this support.
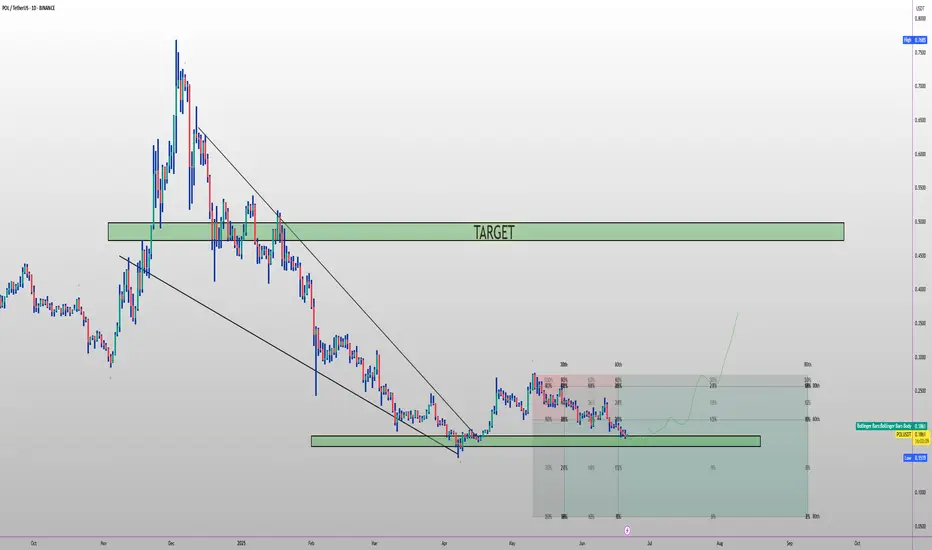
Pol targets for 2025🔥 PSX:POL long setup (1D) 🚀
✅ Entry: $0.16 – $0.18 (launch-base demand)
🎯 Targets
• TP-1: $0.45
• TP-2: $0.58
⛔ Stop-Loss
1 d Close < $0.14
📊 Thesis
Polygon 2.0 migration ✔️. AggLayer mainnet (Feb-25) + Breakout Program → airdrops for POL stakers. Gigagas upgrade aims 1 k + TPS. 2 % annual emi
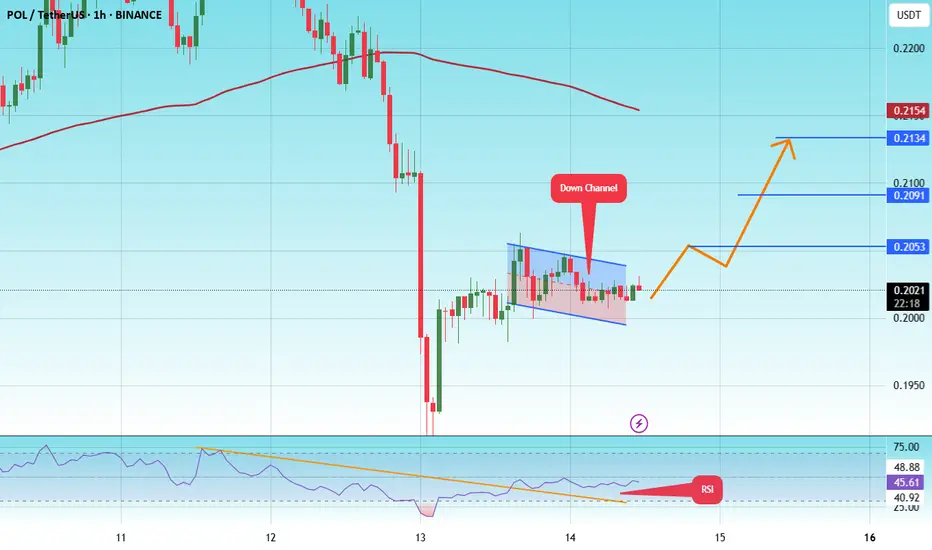
#POL/USDT#POL
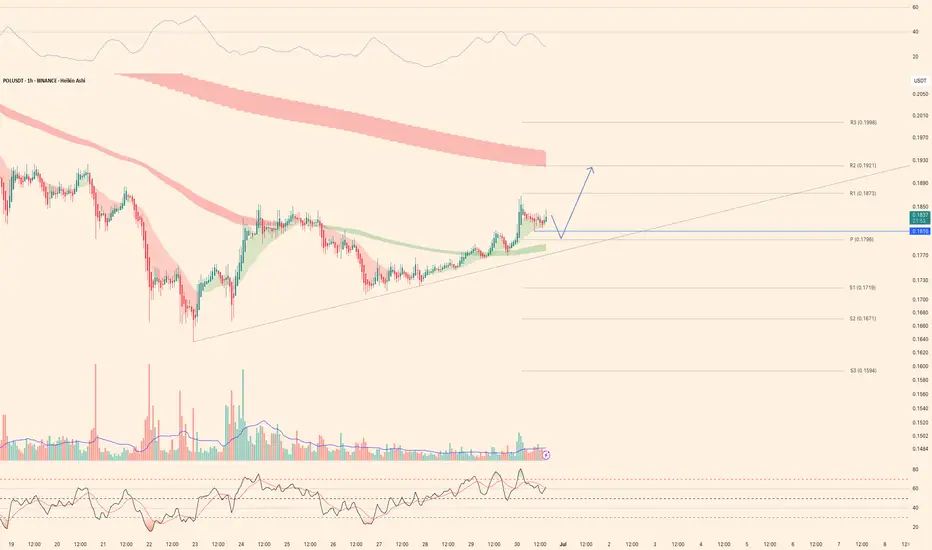
The price is moving within a descending channel on the 1-hour frame and is expected to break and continue upward.
We have a trend to stabilize above the 100 moving average once again.
We have a downtrend on the RSI indicator, which supports the upward move by breaking it upward.
We have a s
See all ideas
Summarizing what the indicators are suggesting.
Oscillators
Neutral
SellBuy
Strong sellStrong buy
Strong sellSellNeutralBuyStrong buy
Oscillators
Neutral
SellBuy
Strong sellStrong buy
Strong sellSellNeutralBuyStrong buy
Summary
Neutral
SellBuy
Strong sellStrong buy
Strong sellSellNeutralBuyStrong buy
Summary
Neutral
SellBuy
Strong sellStrong buy
Strong sellSellNeutralBuyStrong buy
Summary
Neutral
SellBuy
Strong sellStrong buy
Strong sellSellNeutralBuyStrong buy
Moving Averages
Neutral
SellBuy
Strong sellStrong buy
Strong sellSellNeutralBuyStrong buy
Moving Averages
Neutral
SellBuy
Strong sellStrong buy
Strong sellSellNeutralBuyStrong buy
Displays a symbol's price movements over previous years to identify recurring trends.