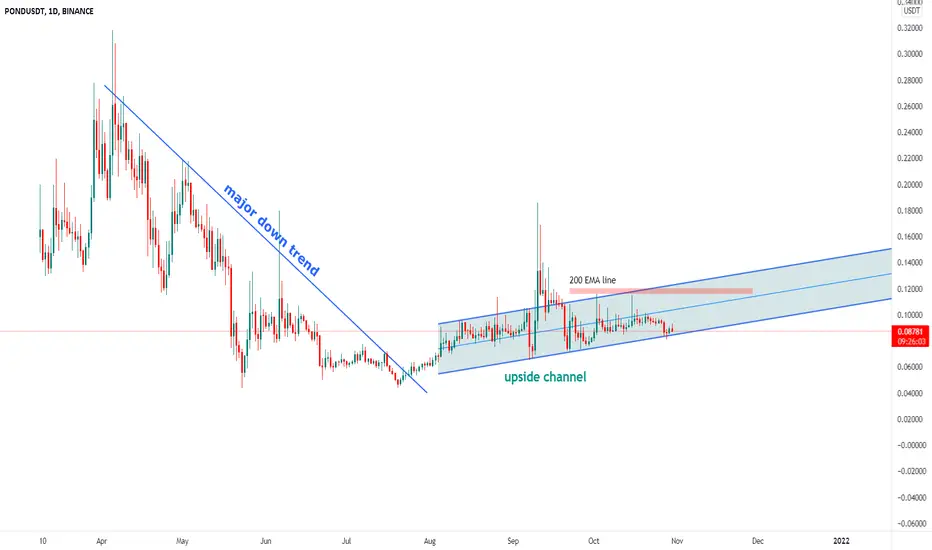
PONDEvery time price has had interaction with these lines there has been rejection. It's getting close to a point where price will have to break this sequence or continue on its path.
Price has been making higher lows since the last 3 touches, which suggests that current price may be a bottom for the next move upwards.
Previous analysis linked.
PONDUSDT.P trade ideas

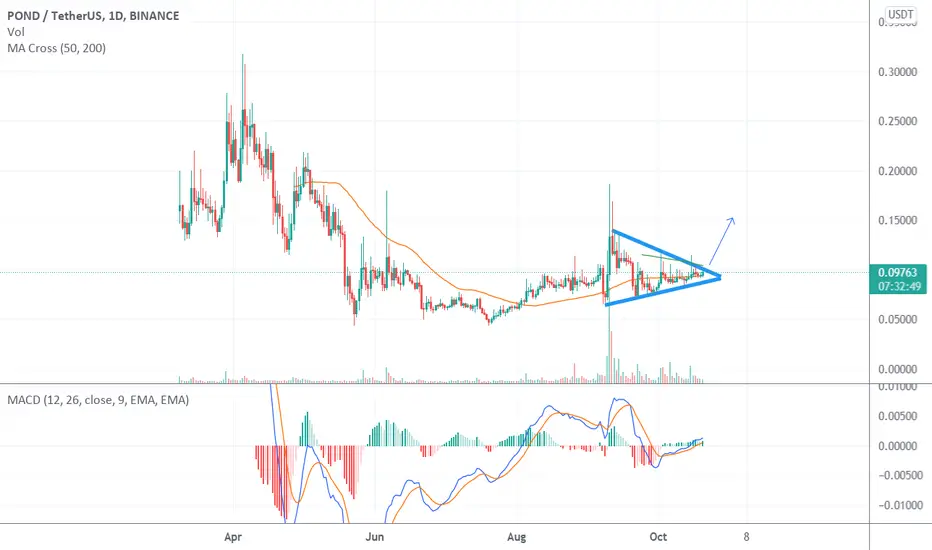
$pond has pumped many times Pond on a daily chart looks good for me , I can easily see 0.09+ .
Also, it has been a long time since we have a pump..
I’m whiting , All in until the market cool down.


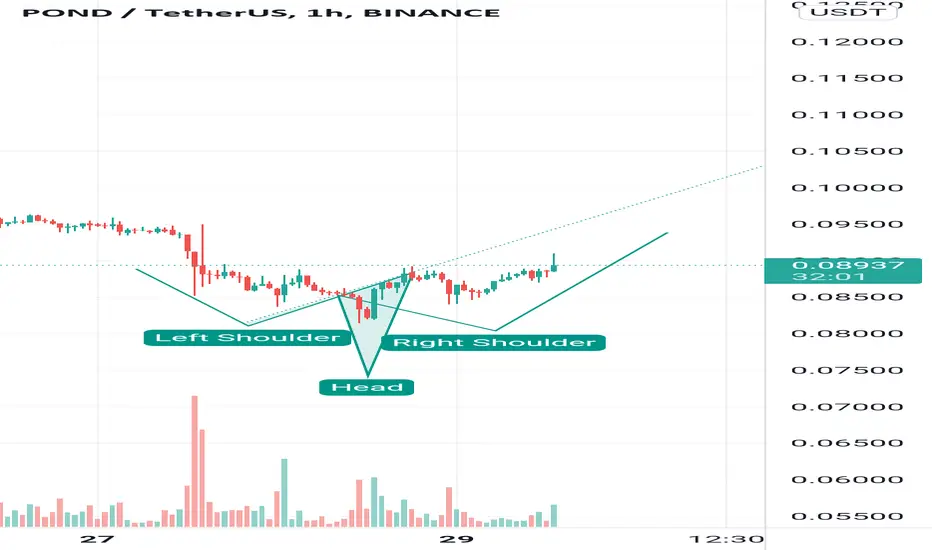
This is pond chart which is forming this pattern Ok so guys be ready for pond pump it's low cap gem and forming head and shoulder so be ready
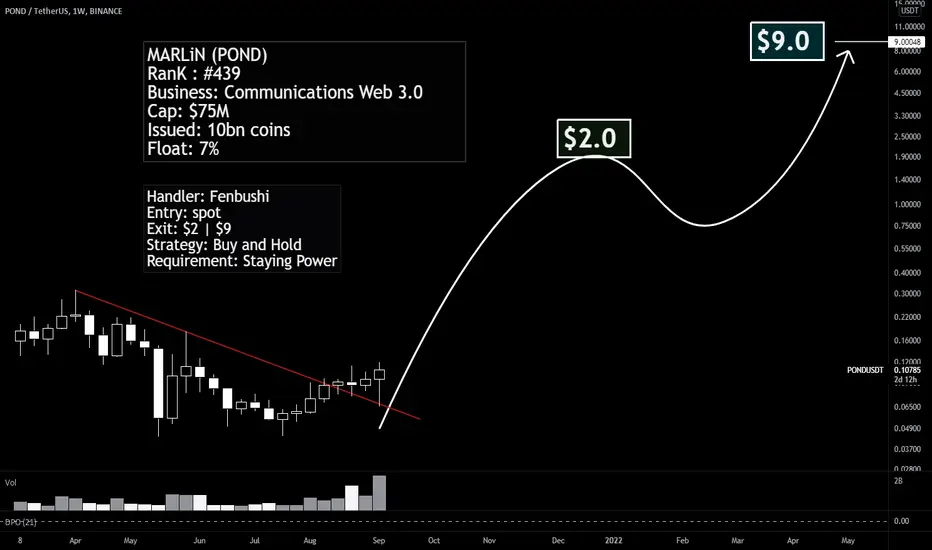
MARLiN: $0.10 | under rated in the communications WEB 3.0 spacewhen the market wants it... this shall have its day in the spotlight
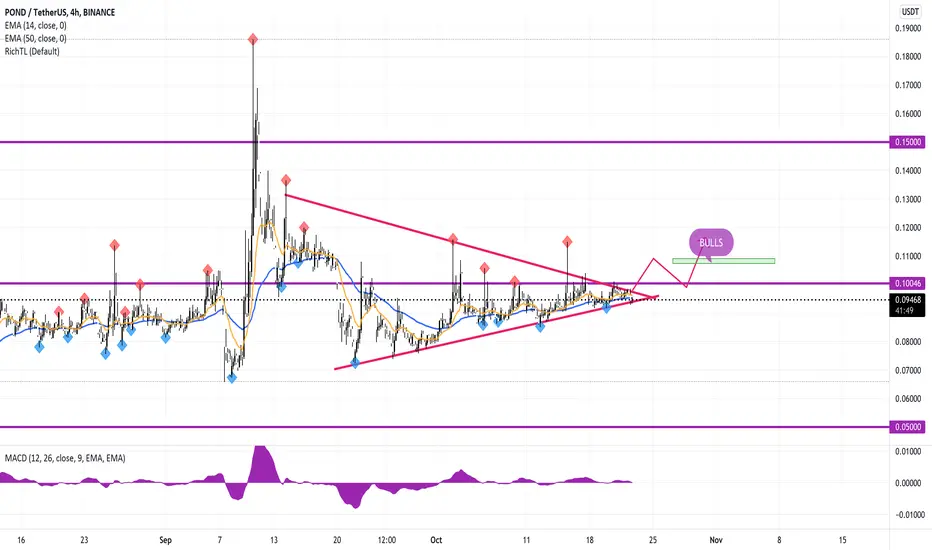
PONDUSDTWhat's up guys!
As price forms an asymmetrical triangle , I'm looking for the buy setups on the break upward of the triangle with momentum candles , what do you guys feel ?
PondUsdtthis coin have chanse for pump ith 1 candle and you should have good targets for dont miss profit
this chart is short on houbi chart is better but for more ppl work on binance :( i use binance chart
i hop can got profit
this analyse for frind ask me
GL
The coins that have a copycat market are usually quickly pumped and dumped fast," these dumps are these days because of bitcoin's powerful moves that accumulate liquidity, and now that Bitcoin is reforming a little bit, they can go back to the rest of the coins.
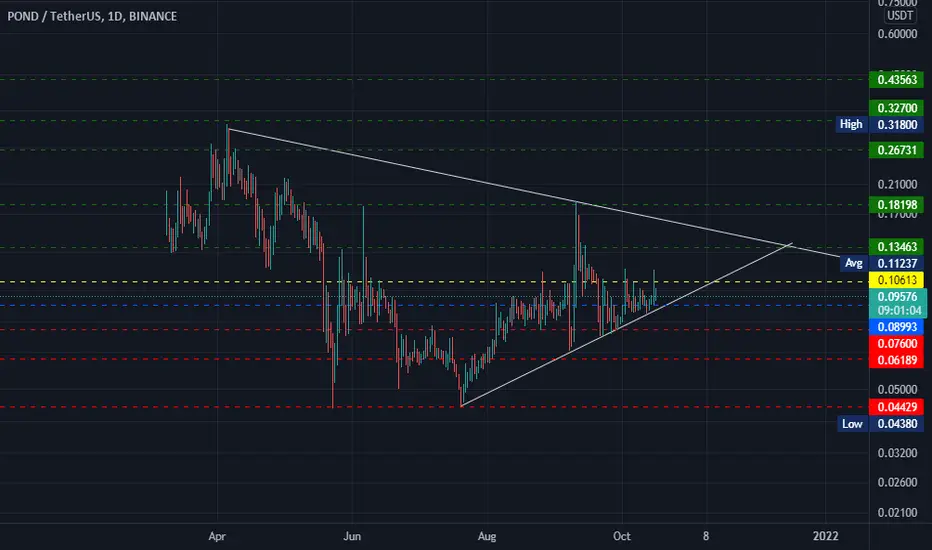
EntryPoint:
0.08993
Support:
0.07600
0.06189
0.04429
Resistance:
0.10613
Targets:
0.13463
0.18198
0.26731
0.32700
0.43563
GL
pond move toward 0.14$ in coming days pond move toward 0.14$ in coming days ................................................

PONDUSDT longRisk warning, disclaimer: the above is a personal market judgment based on published information and historical chart data on Tradingview, all analysis is only subjective. Hope investors consider, I am not responsible for your investment decision. Thank you.
Good luck
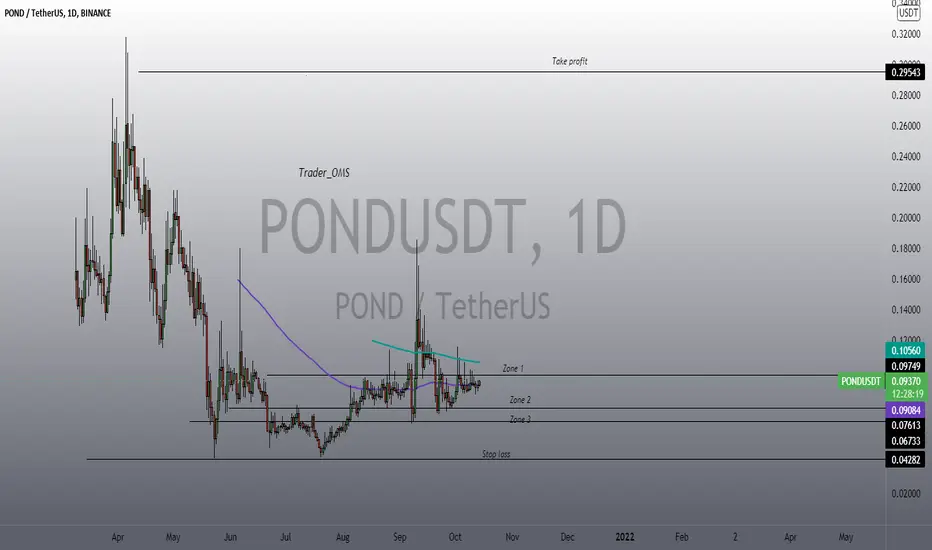
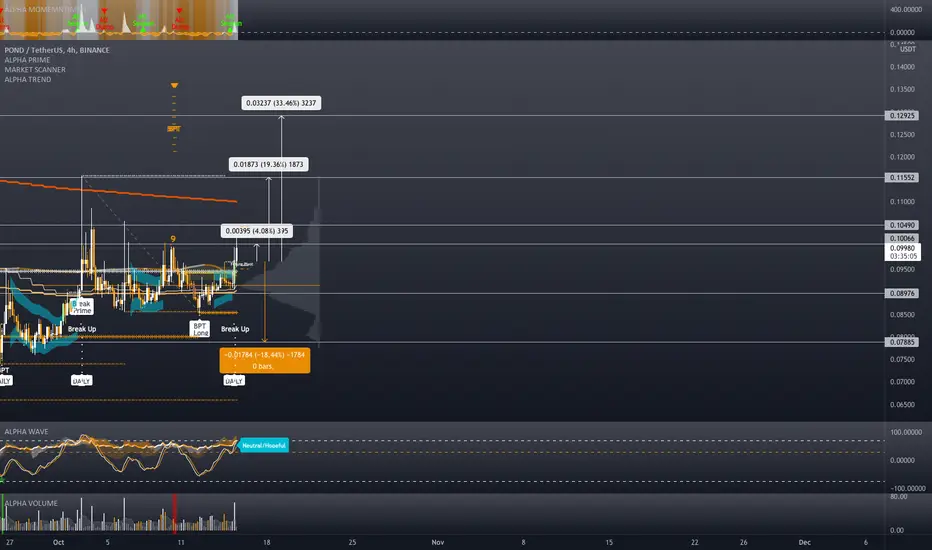
POND/USDT - Long - Potential 33.46%POND/USDT - Long - Potential 33.46%
Exchanges: Huobi.pro, Binance
Signal Type: Regular (Long)
Entry Zone: 0.089760 - 0.099200
Take-Profit Targets:
1) 0.104900
2) 0.115520
3) 0.129250
Stop Targets:
1) 0.078850
Entry Trigger - Active breakout
PONDUSDT - LONG #PONDUSDT Daily
Market Stuck In Bullish Channel And Touch The Support Area Of This Channel
We Are Looking Buy From That Possition.

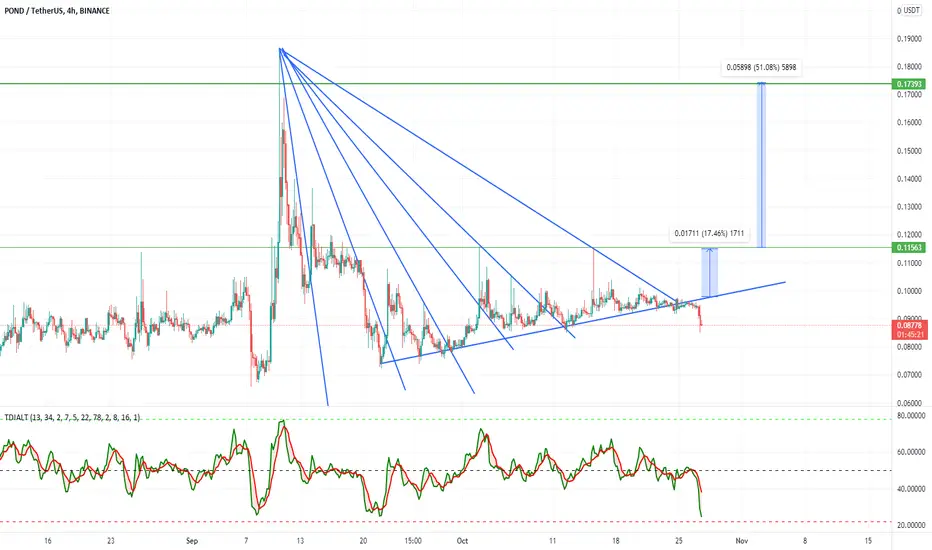
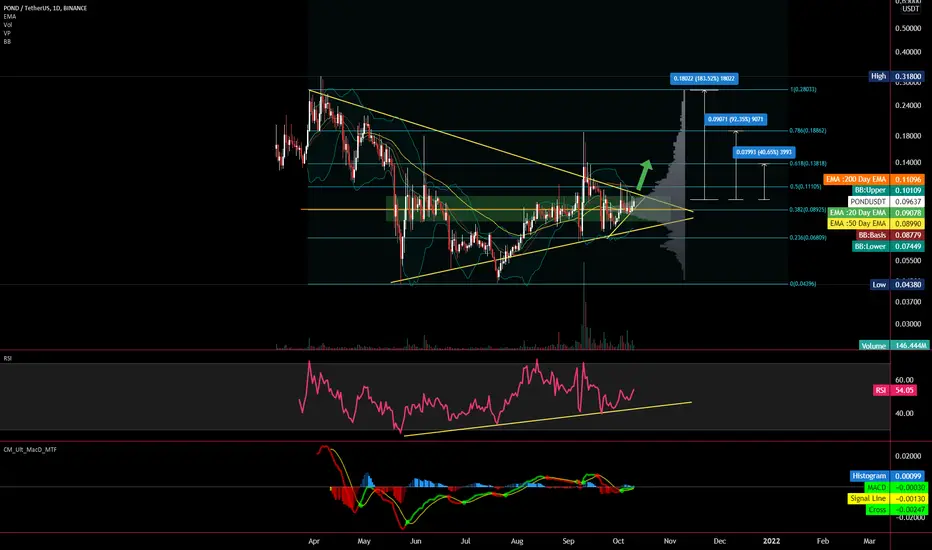
[PONDUSDT] End of symmetrical triangle... bullish!Hi all,
PONDUSDT is doing a great symmetrical triangle on both Daily/Weekly timeframes.
RSI is doing a huge bullish divergence since May (!) and MACD is showing some bullish signs, trading above the signal line for the past couple of days.
POND made a great pump one month ago with a great volume spike as you can see on the chart, then it went back into the triangle. The accumulation was done mostly in the current trading zone as the Volume Profile tool shows (green rectangle).
Bollinger's band are showing a sort of contraction which indicates a ranging zone being consolidated.
I believe POND will explode in upcoming days. 40% to 180% move according Fibonacci's levels (0.618 to 1).
This is not an investment advice, just sharing my thoughts as always.
Good luck everyone! :)
PONDPONDUSDT Forming symmetrical triangle on 1D timeframe and looking very bullish in BTC pair once breakout it can pump hard also BTC looking bullish so we can expect good return from #POND in coming days Buy and hold it for maximum profits

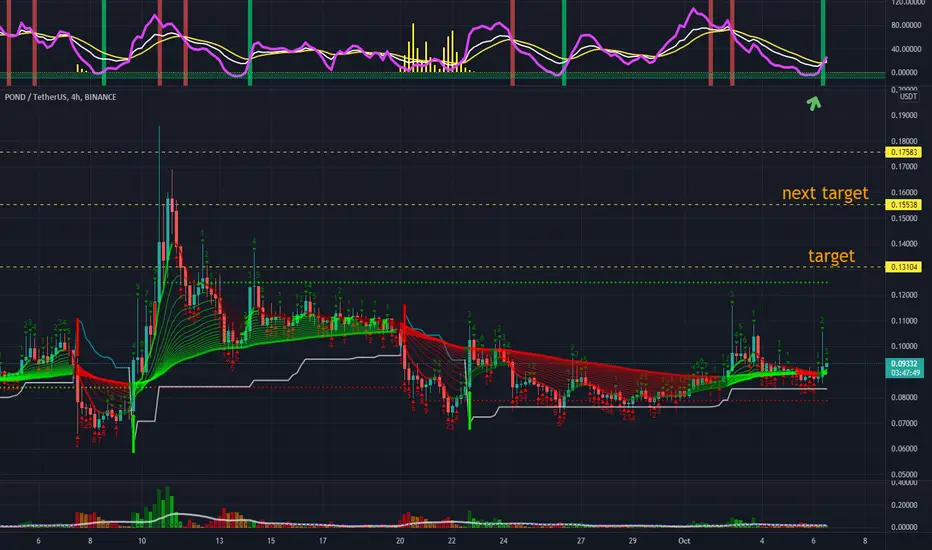
POND bullish momentumAfter a small uptrend of around 10% Pond is having a small correction now testing the lows ,after this is completed we may see a bullish momentum
3 Targets on chart
last target 0.175 = is long term or - super pamp
for other coins/targets you can DM me


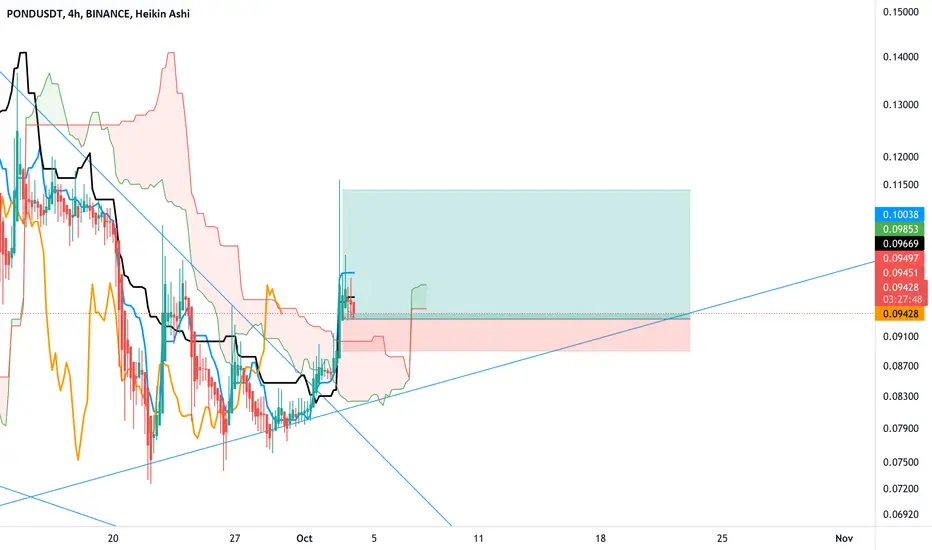
PONDUSDT RR 1:4 TP 0.103 0.108 0.114PONDUSDT
Entry near 0.09350
SL 0.0890 5%
TP 0.103 0.108 0.114
RR 1:4
POND IS ATTRACTIVE FOR MELets see if this is gonna work.. I want to try with as low risk as possible.

Pond hidden bullish divergence. Upwards continuation.Historic bounce off of RSI oversold support line. Hidden BULLISH divergence on MACD to confirm upward trend continuation. Price respecting the upward trendline dating back to JULY. Price fulfilled long term Fibonacci 'ABC' pattern, waiting on price to reach target 'D' (0.22494) - our first take profit. Price also completed a short term Fibonacci sequence, 'ABC', first short term Fibonacci target 'D' (0.21911) aligns nicely with long term Fibonacci target.
Have patience, don't get greedy and not take profits when price reaches our targets :)
Have a nice day.

Long Pond To Target AreasLoad up heavy in the long zone. Hodl until price reaches targets. Easy money.
