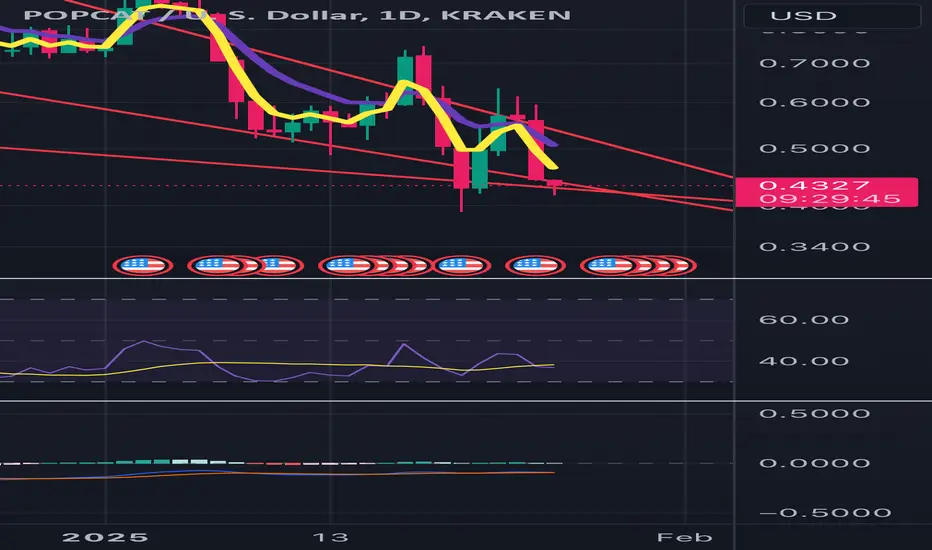
RSI Divergence on DailyStrong hidden bullish divergence on the daily chart for POPCAT.
Meme coins for the last number of months have required strong broad market performance so to some extent the move here will require continued strength from BTC but I see a good risk profile for a long here.
Would target mid $0.7s with

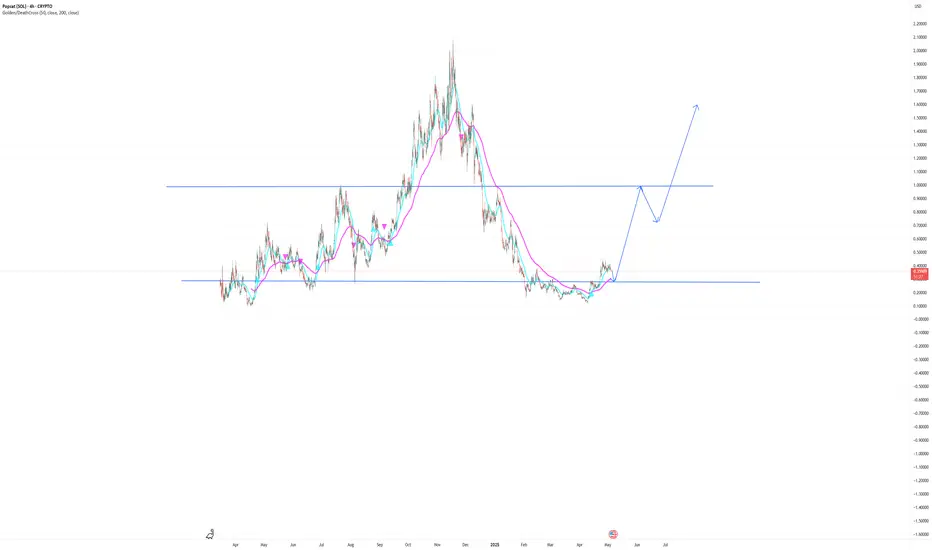
popcat comebackbear market trap to 28-30c then scam pump to $1.. resistance.. drop to 70-80c then back to near aths.. watch and see
$popcat #popcat
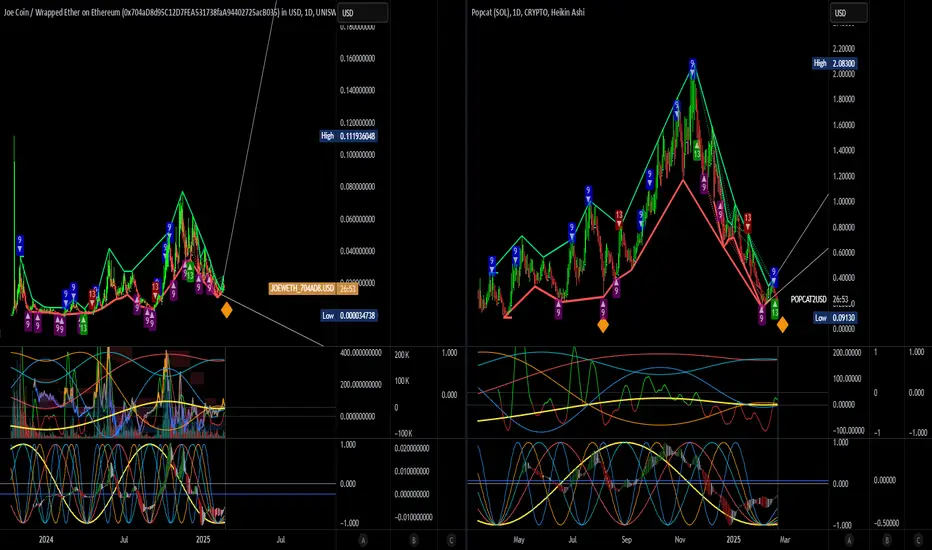
$JOE $JOE compared to $POPCAT PopcatNYSE:JOE NYSE:JOE (MARKET CAP $16.60M)
entry PTs 0.01-ish
Next Target PT 0.16 and higher
Hello my name is joe, some call me Joe.
Comparion chart:
$POPCAT Popcat (TOTAL MKTCAP $242.11M)
re-entry, soon
Pop Cat refers to a series of videos in which using an image of a cat named Oatmeal, the cat i
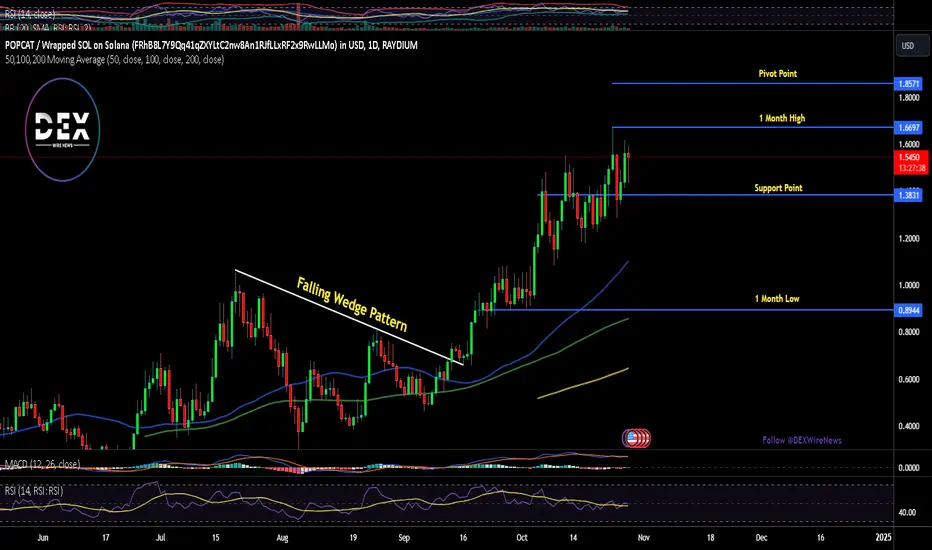
$popcat falling wedge$popcat is getting ready to hit the bottom and explode. Loads of people have been shaken out. The pump before tax season is here before another down cycle for taxes.
Why $POPCAT Could Be a Long-Term Contender in Solana BlockchainPopcat (SOL), a Solana-based meme coin, is grabbing attention within the crypto market due to its recent price performance, robust growth, and high trading activity. The meme coin, based on the widely popular Internet meme featuring the cat 'Oatmeal,' has gained traction with an impressive rise from
See all ideas
Summarizing what the indicators are suggesting.
Oscillators
Neutral
SellBuy
Strong sellStrong buy
Strong sellSellNeutralBuyStrong buy
Oscillators
Neutral
SellBuy
Strong sellStrong buy
Strong sellSellNeutralBuyStrong buy
Summary
Neutral
SellBuy
Strong sellStrong buy
Strong sellSellNeutralBuyStrong buy
Summary
Neutral
SellBuy
Strong sellStrong buy
Strong sellSellNeutralBuyStrong buy
Summary
Neutral
SellBuy
Strong sellStrong buy
Strong sellSellNeutralBuyStrong buy
Moving Averages
Neutral
SellBuy
Strong sellStrong buy
Strong sellSellNeutralBuyStrong buy
Moving Averages
Neutral
SellBuy
Strong sellStrong buy
Strong sellSellNeutralBuyStrong buy
Displays a symbol's price movements over previous years to identify recurring trends.