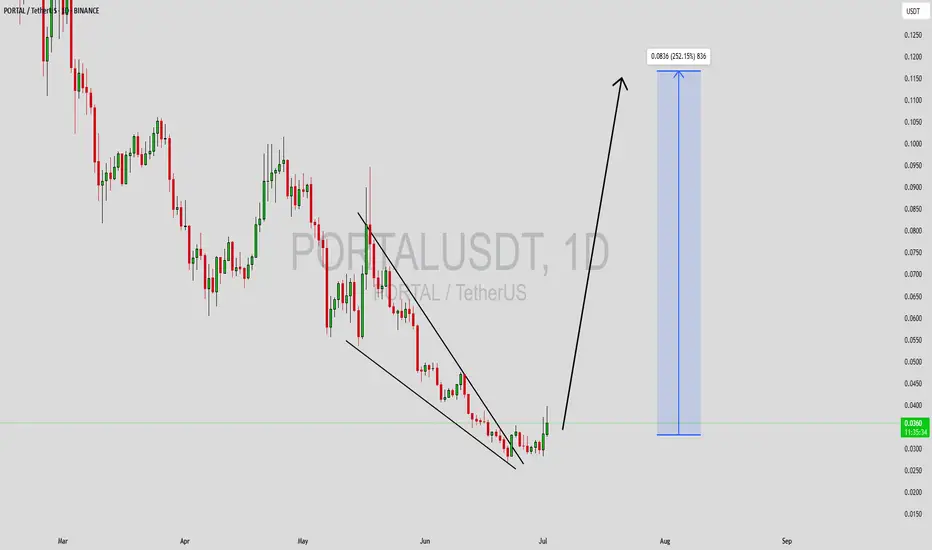
PORTALUSDT Forming Descending TrianglePORTALUSDT is catching traders’ eyes as it forms a classic descending triangle pattern, which is known for its clear breakout potential. While this pattern is typically seen as a bearish continuation, in certain market conditions with strong volume and investor backing, a descending triangle can fli
#PORTALbullish confirmation#PORTAL
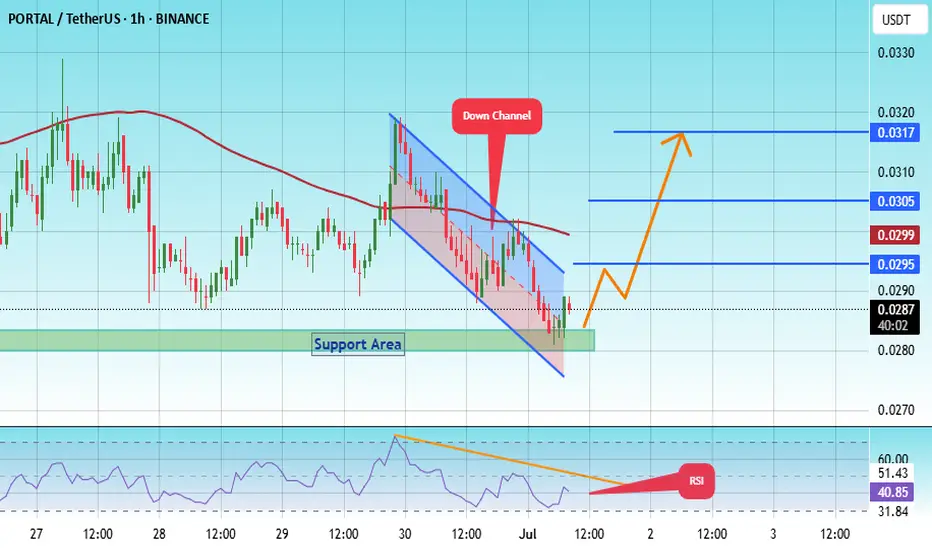
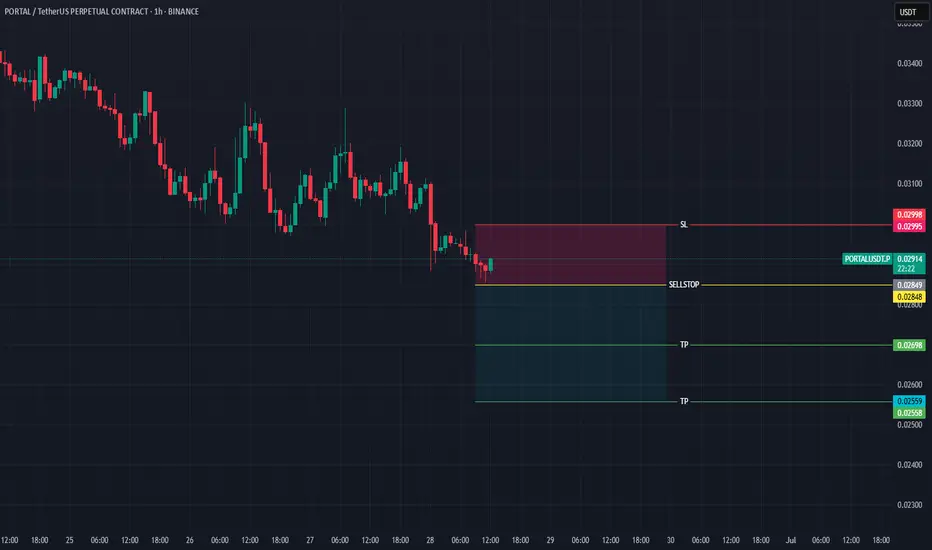
The price is moving within a descending channel on the 1-hour frame, adhering well to it, and is on its way to breaking it strongly upwards and retesting it.
We have a bounce from the lower boundary of the descending channel. This support is at 0.0283.
We have a downtrend on the RSI indic
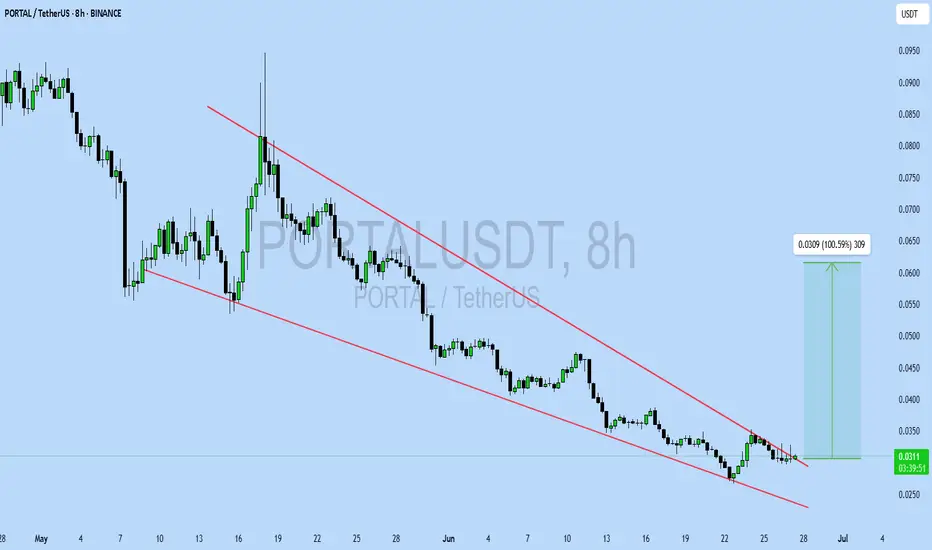
PORTALUSDT UPDATE
Pattern: Falling Wedge Breakout
Current Price: \$0.0311
Target Price: \$0.0620
Target % Gain: 100.59%
Technical Analysis: PORTAL has broken out of a falling wedge pattern on the 8H chart, showing strong bullish momentum. Breakout is supported by increasing volume and clean retest confirmation.
T
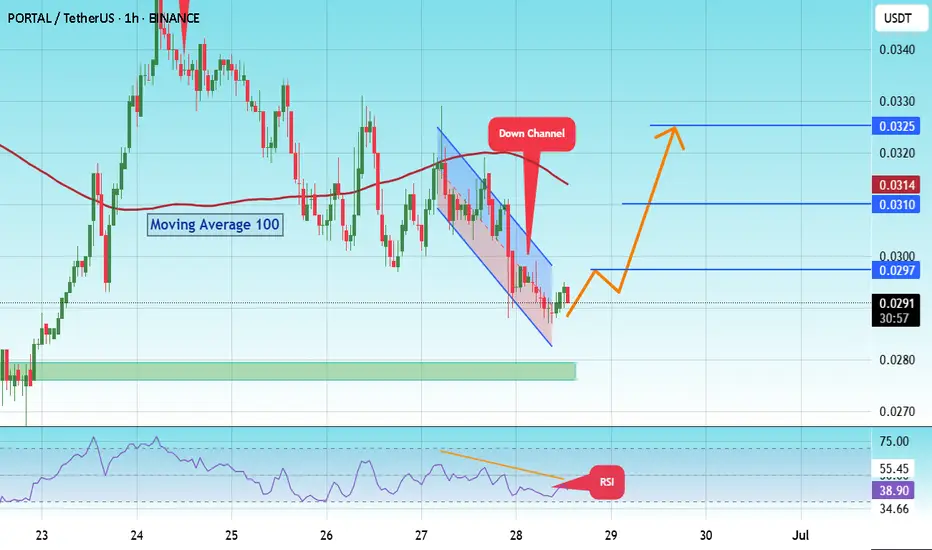
#PORTALUSDT NEXT MOVE ?#PORTAL
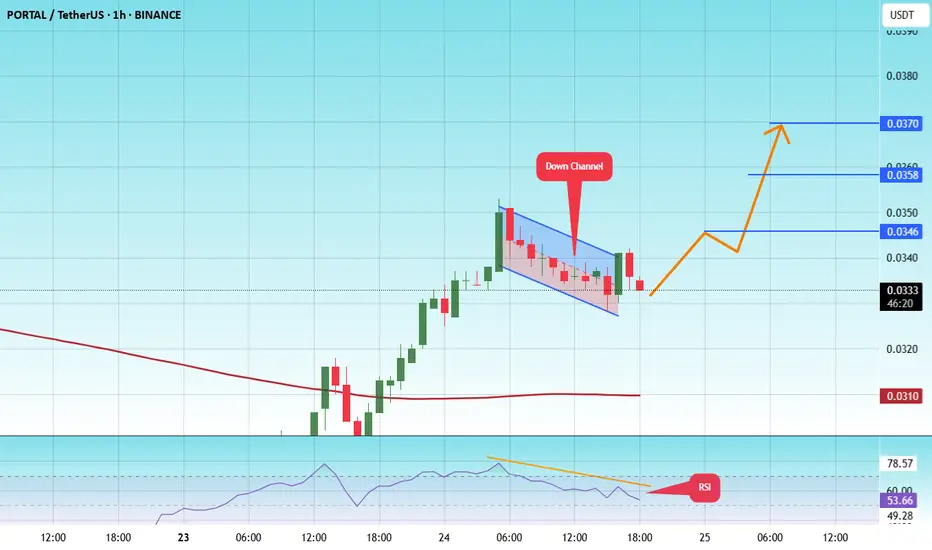
The price is moving within a descending channel on the 1-hour frame and is expected to break and continue upward.
We have a trend to stabilize above the 100 moving average once again.
We have a downtrend on the RSI indicator that supports the upward break.
We have a support area at the l
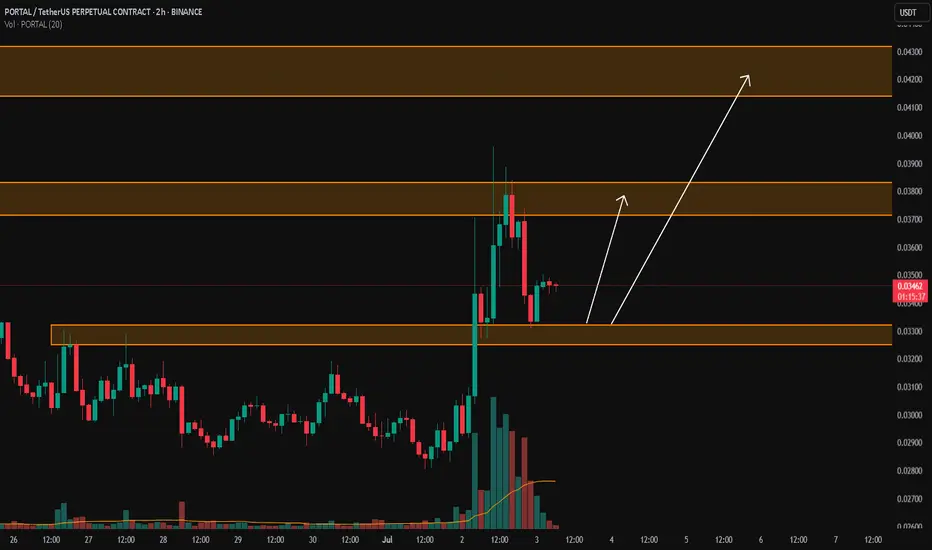
PORTAL/USDTKey Level Zone: 0.03250 - 0.03320
LMT v2.0 detected.
The setup looks promising—price previously trended upward with rising volume and momentum, then retested this zone cleanly. This presents an excellent reward-to-risk opportunity if momentum continues to align.
Introducing LMT (Levels & Momentum
#PORTAL/USDT#PORTAL
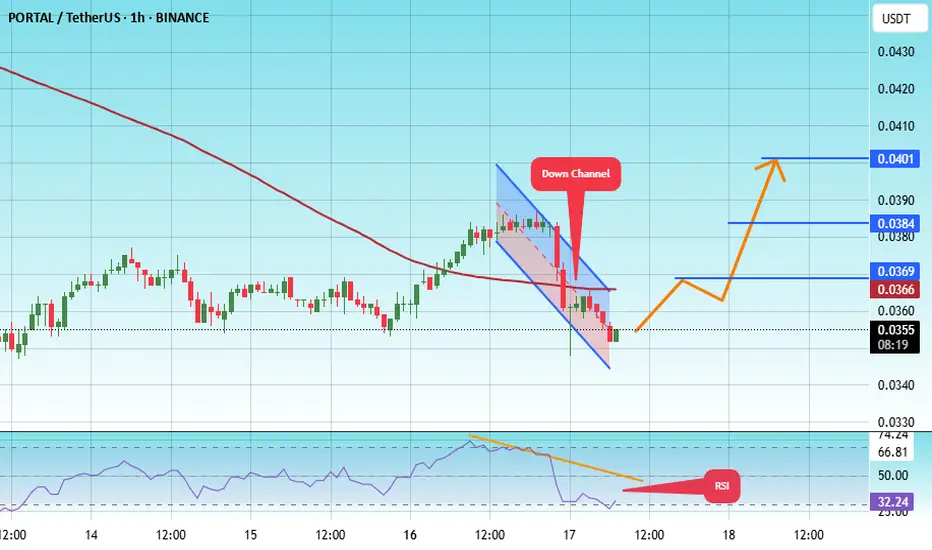
The price is moving within a descending channel on the 1-hour frame and is expected to break and continue upward.
We have a trend to stabilize above the 100 moving average once again.
We have a downtrend on the RSI indicator, which supports the upward move by breaking it upward.
We have
#PORTAL/USDT#PORTAL
The price is moving within a descending channel on the 1-hour frame, adhering well to it, and is heading for a strong breakout and retest.
We are experiencing a rebound from the lower boundary of the descending channel. This support is at 0.0347.
We are experiencing a downtrend on the RSI
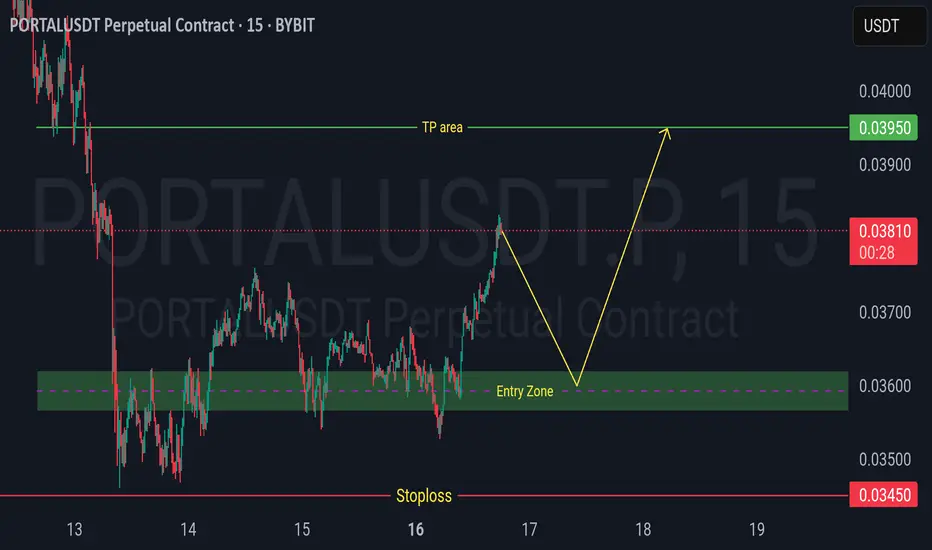
PORTAL bullish confirmationA potential long entry can be considered if the price holds above the support level. The suggested entry range is between 0.03565 and 0.03620. To manage risk, a stop loss should be placed below 0.03450. The first target for taking profit is set at 0.03950.
PORTAL waiting gameWaiting for confirmation:
If price reclaims and holds 0.0362 with volume, look for a long.
If price rejects and breaks down below 0.0354, short bias resumes.
I will post my position entry point upon comfirmation.

See all ideas
Summarizing what the indicators are suggesting.
Oscillators
Neutral
SellBuy
Strong sellStrong buy
Strong sellSellNeutralBuyStrong buy
Oscillators
Neutral
SellBuy
Strong sellStrong buy
Strong sellSellNeutralBuyStrong buy
Summary
Neutral
SellBuy
Strong sellStrong buy
Strong sellSellNeutralBuyStrong buy
Summary
Neutral
SellBuy
Strong sellStrong buy
Strong sellSellNeutralBuyStrong buy
Summary
Neutral
SellBuy
Strong sellStrong buy
Strong sellSellNeutralBuyStrong buy
Moving Averages
Neutral
SellBuy
Strong sellStrong buy
Strong sellSellNeutralBuyStrong buy
Moving Averages
Neutral
SellBuy
Strong sellStrong buy
Strong sellSellNeutralBuyStrong buy
Displays a symbol's price movements over previous years to identify recurring trends.