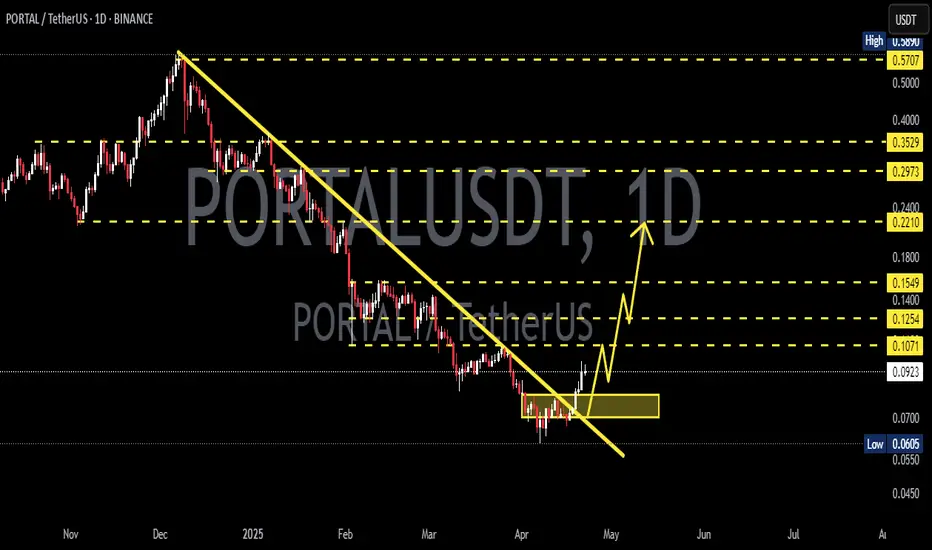
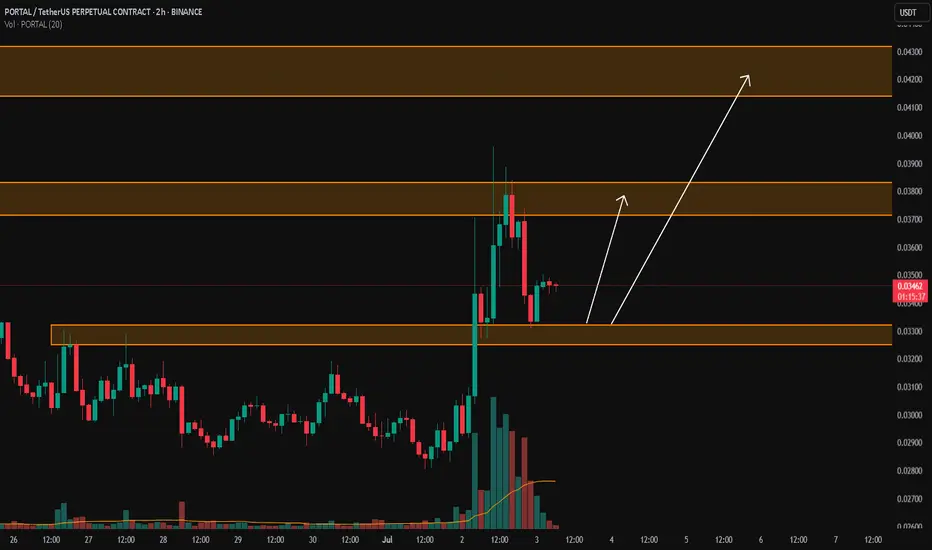
PORTALUSDT Forming Descending TrianglePORTALUSDT is catching traders’ eyes as it forms a classic descending triangle pattern, which is known for its clear breakout potential. While this pattern is typically seen as a bearish continuation, in certain market conditions with strong volume and investor backing, a descending triangle can flip to produce explosive bullish moves. The good volume levels seen recently suggest that large players are accumulating positions quietly, setting the stage for a major breakout that could deliver impressive returns.
Technical traders watching PORTALUSDT should keep an eye on the horizontal support line of the triangle and the downward-sloping trendline acting as resistance. A confirmed breakout above this resistance with strong volume could unlock a massive price surge, with an expected gain ranging from 190% to 200%+. Such setups attract both pattern traders and momentum investors looking to capitalize on sharp moves.
Fundamentally, investors are showing renewed interest in the PORTAL project, adding more credibility to the technical setup. Positive sentiment and fresh capital flowing into the project can be the driving force behind a big breakout rally. For swing traders and position traders, this could be an ideal setup to ride the next big move with clearly defined risk levels below the support zone.
✅ Show your support by hitting the like button and
✅ Leaving a comment below! (What is You opinion about this Coin)
Your feedback and engagement keep me inspired to share more insightful market analysis with you!
PORTALUSDT.P trade ideas
PORTALUSDT UPDATE
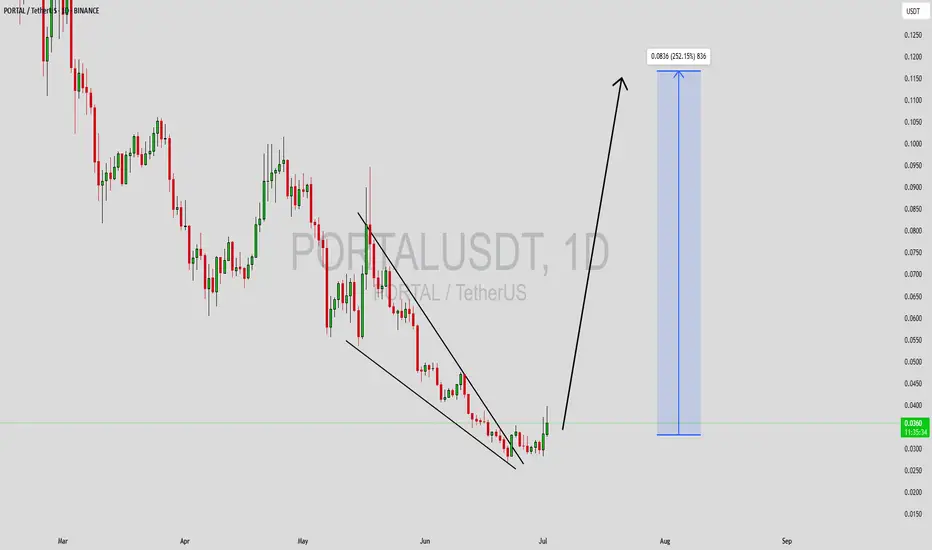
Pattern: Falling Wedge Breakout
Current Price: \$0.0311
Target Price: \$0.0620
Target % Gain: 100.59%
Technical Analysis: PORTAL has broken out of a falling wedge pattern on the 8H chart, showing strong bullish momentum. Breakout is supported by increasing volume and clean retest confirmation.
Time Frame: 8H
#PORTALbullish confirmation#PORTAL
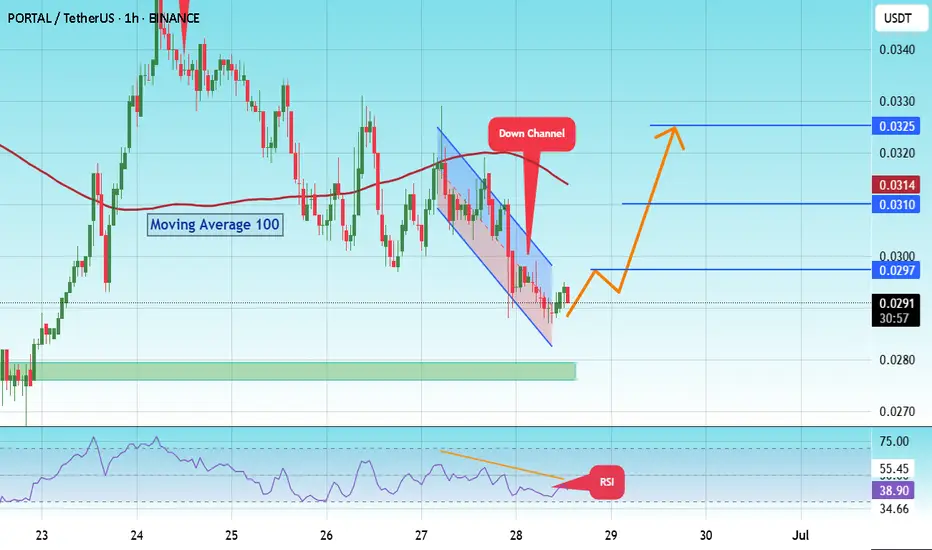
The price is moving within a descending channel on the 1-hour frame, adhering well to it, and is on its way to breaking it strongly upwards and retesting it.
We have a bounce from the lower boundary of the descending channel. This support is at 0.0283.
We have a downtrend on the RSI indicator that is about to break and retest, supporting the upside.
There is a major support area in green at 0.0281, which represents a strong basis for the upside.
Don't forget a simple thing: ease and capital.
When you reach the first target, save some money and then change your stop-loss order to an entry order.
For inquiries, please leave a comment.
We have a trend to hold above the 100 Moving Average.
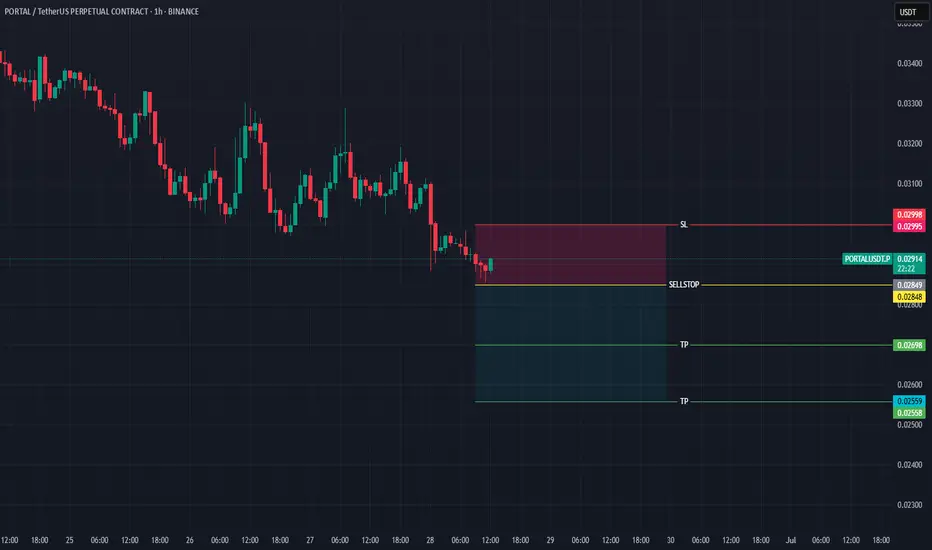
Entry price: 0.0317
First target: 0.0295
Second target: 0.0305
Third target: 0.0317
Don't forget a simple thing: ease and capital.
When you reach the first target, save some money and then change your stop-loss order to an entry order.
For inquiries, please leave a comment.
Thank you.
PORTAL/USDTKey Level Zone: 0.03250 - 0.03320
LMT v2.0 detected.
The setup looks promising—price previously trended upward with rising volume and momentum, then retested this zone cleanly. This presents an excellent reward-to-risk opportunity if momentum continues to align.
Introducing LMT (Levels & Momentum Trading)
- Over the past 3 years, I’ve refined my approach to focus more sharply on the single most important element in any trade: the KEY LEVEL.
- While HMT (High Momentum Trading) served me well—combining trend, momentum, volume, and structure across multiple timeframes—I realized that consistently identifying and respecting these critical price zones is what truly separates good trades from great ones.
- That insight led to the evolution of HMT into LMT – Levels & Momentum Trading.
Why the Change? (From HMT to LMT)
Switching from High Momentum Trading (HMT) to Levels & Momentum Trading (LMT) improves precision, risk control, and confidence by:
- Clearer Entries & Stops: Defined key levels make it easier to plan entries, stop-losses, and position sizing—no more guesswork.
- Better Signal Quality: Momentum is now always checked against a support or resistance zone—if it aligns, it's a stronger setup.
- Improved Reward-to-Risk: All trades are anchored to key levels, making it easier to calculate and manage risk effectively.
- Stronger Confidence: With clear invalidation points beyond key levels, it's easier to trust the plan and stay disciplined—even in tough markets.
Whenever I share a signal, it’s because:
- A high‐probability key level has been identified on a higher timeframe.
- Lower‐timeframe momentum, market structure and volume suggest continuation or reversal is imminent.
- The reward‐to‐risk (based on that key level) meets my criteria for a disciplined entry.
***Please note that conducting a comprehensive analysis on a single timeframe chart can be quite challenging and sometimes confusing. I appreciate your understanding of the effort involved.
Important Note: The Role of Key Levels
- Holding a key level zone: If price respects the key level zone, momentum often carries the trend in the expected direction. That’s when we look to enter, with stop-loss placed just beyond the zone with some buffer.
- Breaking a key level zone: A definitive break signals a potential stop‐out for trend traders. For reversal traders, it’s a cue to consider switching direction—price often retests broken zones as new support or resistance.
My Trading Rules (Unchanged)
Risk Management
- Maximum risk per trade: 2.5%
- Leverage: 5x
Exit Strategy / Profit Taking
- Sell at least 70% on the 3rd wave up (LTF Wave 5).
- Typically sell 50% during a high‐volume spike.
- Move stop‐loss to breakeven once the trade achieves a 1.5:1 R:R.
- Exit at breakeven if momentum fades or divergence appears.
The market is highly dynamic and constantly changing. LMT signals and target profit (TP) levels are based on the current price and movement, but market conditions can shift instantly, so it is crucial to remain adaptable and follow the market's movement.
If you find this signal/analysis meaningful, kindly like and share it.
Thank you for your support~
Sharing this with love!
From HMT to LMT: A Brief Version History
HM Signal :
Date: 17/08/2023
- Early concept identifying high momentum pullbacks within strong uptrends
- Triggered after a prior wave up with rising volume and momentum
- Focused on healthy retracements into support for optimal reward-to-risk setups
HMT v1.0:
Date: 18/10/2024
- Initial release of the High Momentum Trading framework
- Combined multi-timeframe trend, volume, and momentum analysis.
- Focused on identifying strong trending moves high momentum
HMT v2.0:
Date: 17/12/2024
- Major update to the Momentum indicator
- Reduced false signals from inaccurate momentum detection
- New screener with improved accuracy and fewer signals
HMT v3.0:
Date: 23/12/2024
- Added liquidity factor to enhance trend continuation
- Improved potential for momentum-based plays
- Increased winning probability by reducing entries during peaks
HMT v3.1:
Date: 31/12/2024
- Enhanced entry confirmation for improved reward-to-risk ratios
HMT v4.0:
Date: 05/01/2025
- Incorporated buying and selling pressure in lower timeframes to enhance the probability of trending moves while optimizing entry timing and scaling
HMT v4.1:
Date: 06/01/2025
- Enhanced take-profit (TP) target by incorporating market structure analysis
HMT v5 :
Date: 23/01/2025
- Refined wave analysis for trending conditions
- Incorporated lower timeframe (LTF) momentum to strengthen trend reliability
- Re-aligned and re-balanced entry conditions for improved accuracy
HMT v6 :
Date : 15/02/2025
- Integrated strong accumulation activity into in-depth wave analysis
HMT v7 :
Date : 20/03/2025
- Refined wave analysis along with accumulation and market sentiment
HMT v8 :
Date : 16/04/2025
- Fully restructured strategy logic
HMT v8.1 :
Date : 18/04/2025
- Refined Take Profit (TP) logic to be more conservative for improved win consistency
LMT v1.0 :
Date : 06/06/2025
- Rebranded to emphasize key levels + momentum as the core framework
LMT v2.0
Date: 11/06/2025
#PORTALUSDT NEXT MOVE ?#PORTAL
The price is moving within a descending channel on the 1-hour frame and is expected to break and continue upward.
We have a trend to stabilize above the 100 moving average once again.
We have a downtrend on the RSI indicator that supports the upward break.
We have a support area at the lower boundary of the channel at 0.0284, acting as strong support from which the price can rebound.
We have a major support area in green that pushed the price upward at 0.02750.
Entry price: 0.0288.
First target: 0.0297.
Second target: 0.0310.
Third target: 0.0325.
To manage risk, don't forget stop loss and capital management.
When you reach the first target, save some profits and then change the stop order to an entry order.
For inquiries, please comment.
Thank you.
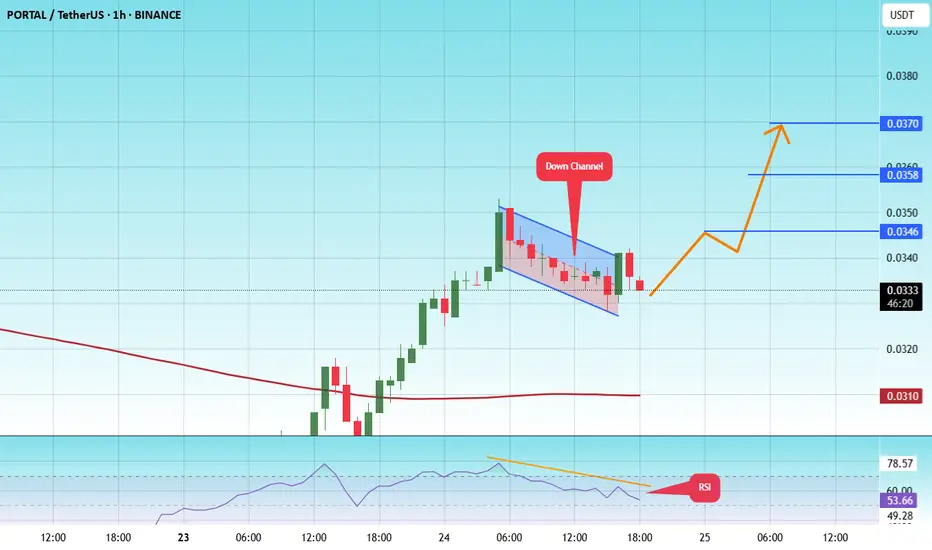
#PORTAL/USDT#PORTAL
The price is moving within a descending channel on the 1-hour frame and is expected to break and continue upward.
We have a trend to stabilize above the 100 moving average once again.
We have a downtrend on the RSI indicator, which supports the upward move by breaking it upward.
We have a support area at the lower limit of the channel at 0.0328, acting as strong support from which the price can rebound.
Entry price: 0.0335
First target: 0.0346
Second target: 0.0358
Third target: 0.0370
#PORTAL/USDT#PORTAL
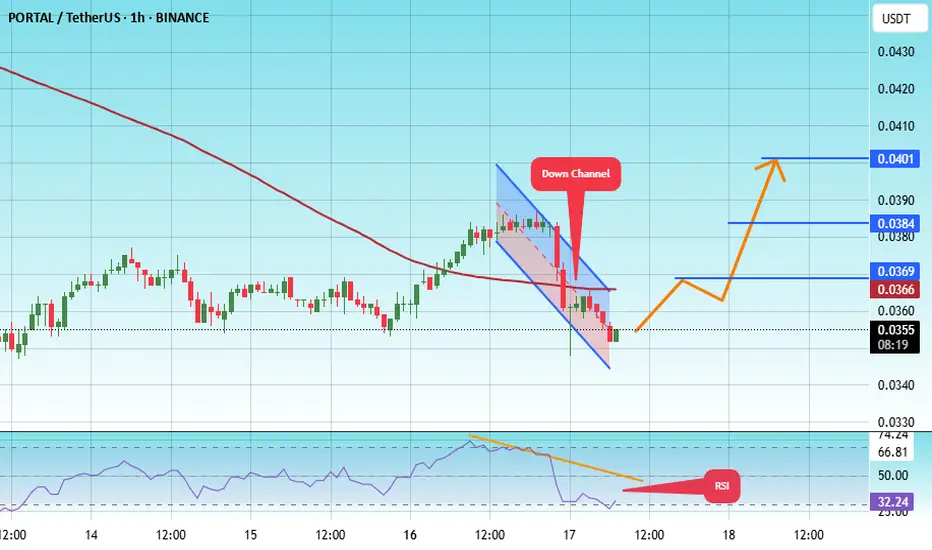
The price is moving within a descending channel on the 1-hour frame, adhering well to it, and is heading for a strong breakout and retest.
We are experiencing a rebound from the lower boundary of the descending channel. This support is at 0.0347.
We are experiencing a downtrend on the RSI indicator, which is about to break and retest, supporting the upward trend.
We are heading for stability above the 100 Moving Average.
Entry price: 0.0355
First target: 0.0366
Second target: 0.0384
Third target: 0.0400
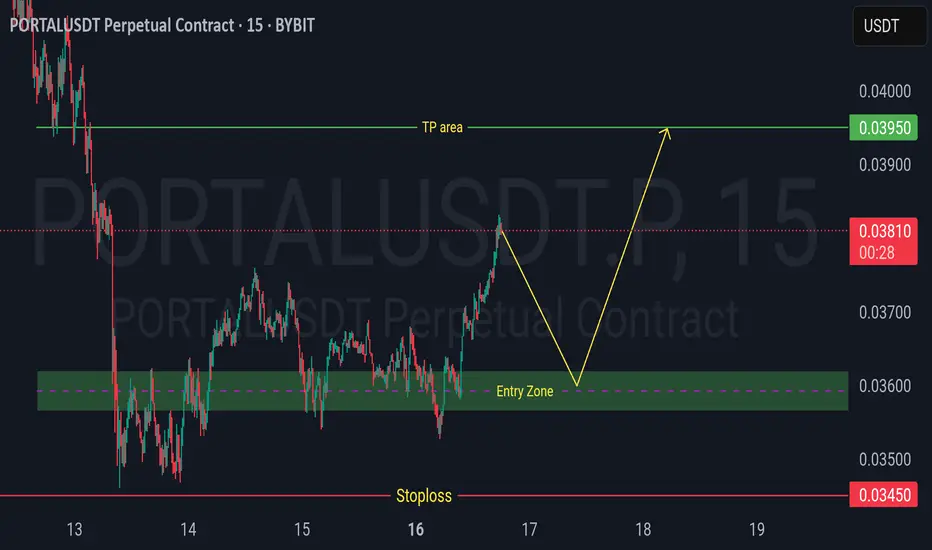
PORTAL bullish confirmationA potential long entry can be considered if the price holds above the support level. The suggested entry range is between 0.03565 and 0.03620. To manage risk, a stop loss should be placed below 0.03450. The first target for taking profit is set at 0.03950.
PORTAL waiting gameWaiting for confirmation:
If price reclaims and holds 0.0362 with volume, look for a long.
If price rejects and breaks down below 0.0354, short bias resumes.
I will post my position entry point upon comfirmation.

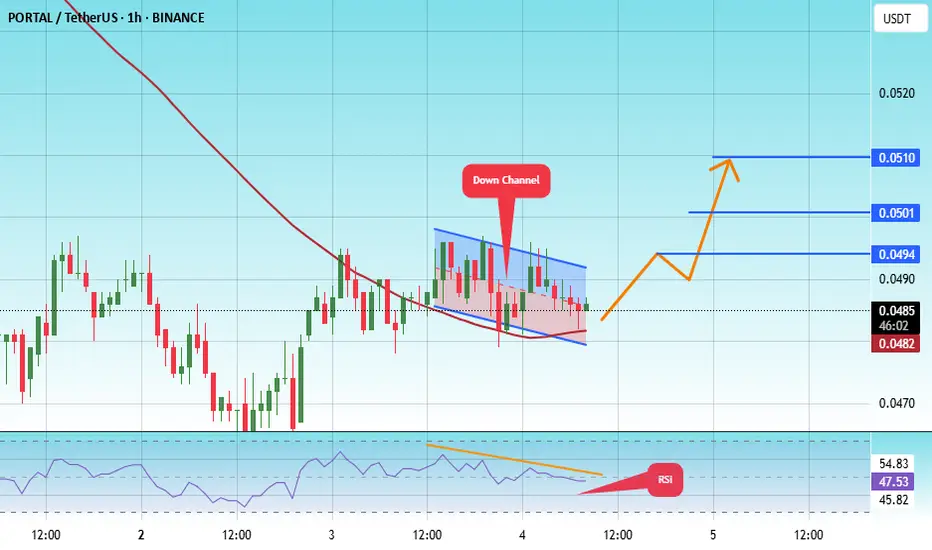
#PORTAL/USDT#PORTAL
The price is moving within a descending channel on the 1-hour frame and is expected to break and continue upward.
We have a trend to stabilize above the 100 moving average once again.
We have a downtrend on the RSI indicator, which supports the upward move by breaking it upward.
We have a support area at the lower limit of the channel at 0.0420, acting as strong support from which the price can rebound.
Entry price: 0.0431
First target: 0.0438
Second target: 0.0448
Third target: 0.0460
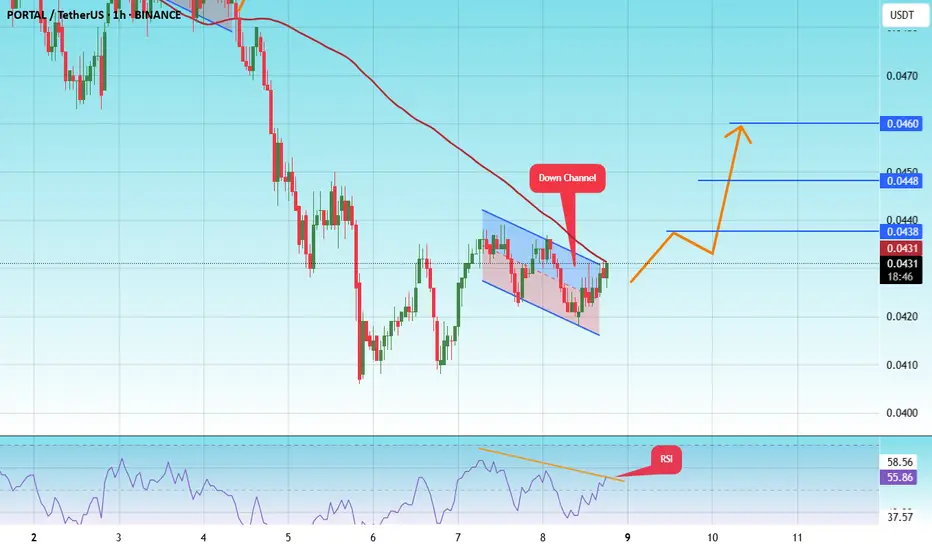
#PORTAL/USDT#PORTAL
The price is moving within a descending channel on the 1-hour frame, adhering well to it, and is heading toward a strong breakout and retest.
We are experiencing a rebound from the lower boundary of the descending channel. This support is at 0.0480.
We have a downtrend on the RSI indicator that is about to be broken and retested, supporting the upward trend.
We are heading toward stability above the 100 Moving Average.
Entry price: 0.0486
First target: 0.0494
Second target: 0.0501
Third target: 0.0510
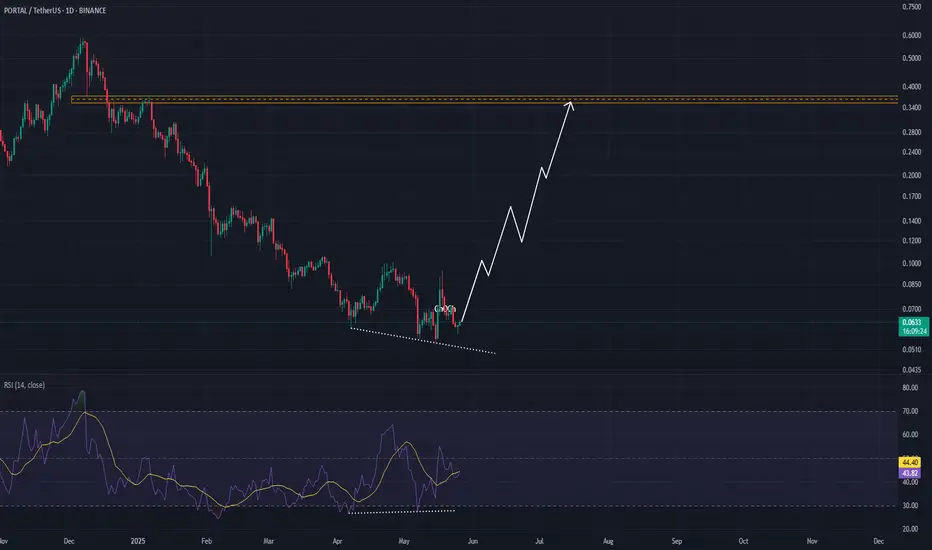
PORTALUSDT🔹 Price Action Overview:
Downtrend Continuation:
PORTAL has been in a consistent downtrend since its peak near $0.38, forming lower highs and lower lows. The price is currently trading at $0.0632, showing signs of temporary support formation.
Falling Wedge / Bullish Reversal Setup:
A descending structure (dotted trendline) is visible, suggesting a potential falling wedge—a classic bullish reversal pattern. This is further supported by a flattening bottom with diminishing bearish momentum.
🔸 RSI Analysis (Relative Strength Index):
RSI Divergence:
A bullish divergence is forming between price and the RSI:
Price is printing lower lows.
RSI is forming higher lows.
This often signals weakening selling pressure and a possible reversal if confirmed with bullish price action.
RSI Value:
Current RSI sits at 43.72, with the signal line at 44.39. It’s nearing the neutral 50 level, and a crossover above this may confirm bullish intent.
🟧 Resistance Zone:
Major Supply Zone:
The area around $0.34–$0.38 is marked as a key resistance (orange zone) from the previous top. If the reversal confirms, this zone will act as the primary bullish target.
🧠 Conclusion:
Bias: Neutral to Bullish
Key Confirmation: A breakout above short-term resistance (around $0.07–$0.075) on strong volume and an RSI breakout above 50 could confirm a trend reversal.
Invalidation: A breakdown below the wedge support and RSI slipping under 40 would invalidate the bullish setup and continue the bearish trend.
Stop loss 1DAY candle close under 0.0540$
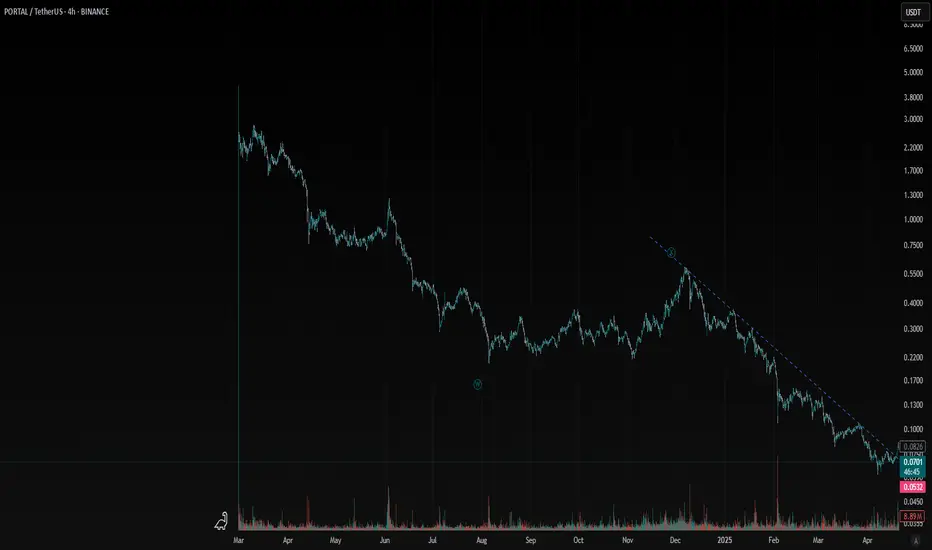
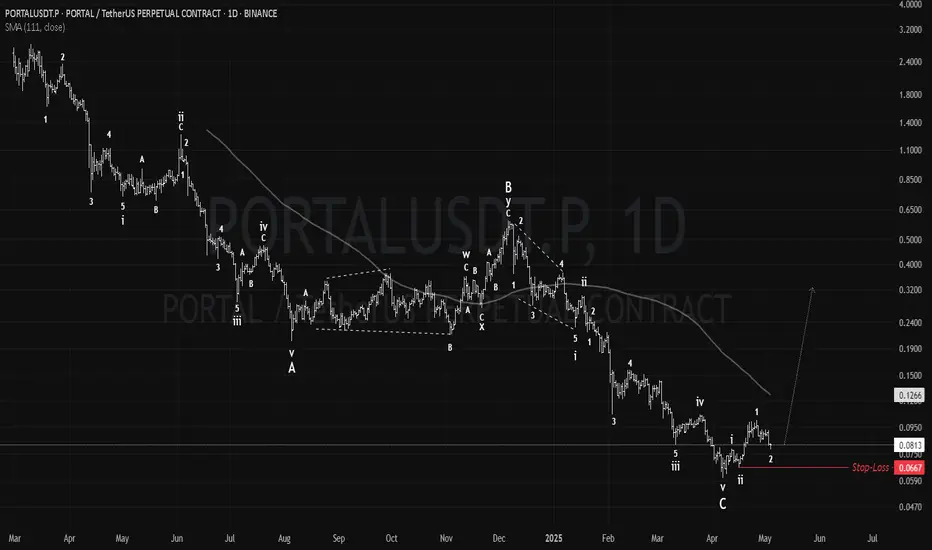
PORTAL: WXY Correction DONE! Trendline Break Confirms New ImpulsHello TradingView Community!
Today, I'm excited to share my technical perspective on Portal (PORTAL), an incredibly promising project poised to be the leading cross-chain gaming hub in the Web3 space, powered by LayerZero. PORTAL aims to simplify Web3 for traditional gamers, offering a universal token for in-game payments, NFT trading, staking, and governance.
While PORTAL's fundamental vision is strong, its price action since its early 2024 launch has, like many new altcoins, experienced significant volatility. It's currently trading around $0.06 - $0.08 USD, with a market cap around $35-$40 million. However, my technical analysis suggests a significant shift may be underway.
My Elliott Wave Prediction: WXY Correction Complete, Impulse Wave Initiated!
(IMPORTANT DISCLAIMER: My Elliott Wave analysis is based on my interpretation of the chart and is inherently subjective. Different analysts may have varying counts. This is NOT financial advice, and cryptocurrency investments are highly volatile. Always do your own research (DYOR) and manage your risk accordingly.)
Based on my detailed analysis of PORTAL's price history on the 4-hour chart, I believe we have witnessed a complex WXY corrective pattern to the downside following its initial price movements.
Wave W (1st Zigzag):The initial sharp A-B-C leg down from the ATH.
Wave X (Connecting Wave): A subsequent corrective bounce, which connected the two zigzags.
Wave Y (2nd Zigzag):The final A-B-C leg down, bringing price to the current lows and completing the entire WXY structure.
As per my count, I predict that this WXY (Double Zigzag) downside correction is now complete, or in its final moments, potentially having found a strong bottom.
Crucial Confirmation: The Downtrend Line Break!
Adding a significant layer of confirmation to my Elliott Wave count, you can clearly see on the chart that PORTAL has recently decisively broken above a significant downtrend line that has been capping price action throughout much of this corrective phase. This breakout, ideally accompanied by volume, is a strong signal that the bearish momentum has shifted.
Following the completion of this corrective phase and the confirmed trendline breakout, I anticipate that PORTAL is now poised to embark on a new impulse wave to the upside. On the chart, I've outlined the potential path for this new impulse, which would typically consist of five sub-waves (1-2-3-4-5).
Potential Wave 1: I believe we are currently seeing the early stages of a strong move up as the first wave of this new impulse, which is supported by the recent trendline break.
Confirmation: Sustained price action above the broken downtrend line and the visible development of a clear five-wave structure would further confirm this bullish outlook.
Invalidation: My current bullish Elliott Wave count and the trendline breakout confirmation would be invalidated if PORTAL were to fall back decisively below the broken downtrend line and, more critically, break below the low of my proposed 'Y' wave. This would suggest the corrective phase is not yet over or that a deeper, more complex correction is unfolding.
Outlook:
Portal's fundamental value proposition in the Web3 gaming space is incredibly strong. From a technical standpoint, the combination of a completed complex corrective pattern (WXY) and the clear confirmation of a trendline break provides a compelling setup for a significant directional move upwards. I will be closely watching for the development of impulse wave characteristics to further confirm this bullish shift.
Always remember to conduct your own thorough research (DYOR) and implement sound risk management. This analysis is for educational and discussion purposes only.
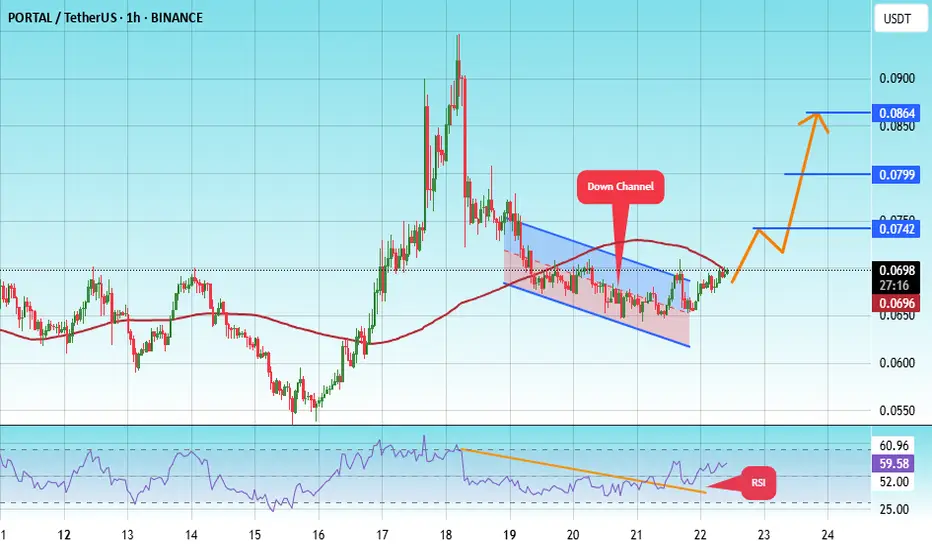
#PORTAL/USDT#PORTAL
The price is moving within a descending channel on the 1-hour frame, adhering well to it, and is heading for a strong breakout and retest.
We are seeing a bounce from the lower boundary of the descending channel, which is support at 0.0622.
We have a downtrend on the RSI indicator that is about to break and retest, supporting the upward trend.
We are looking for stability above the 100 moving average.
Entry price: 0.0698
First target: 0.0742
Second target: 0.0799
Third target: 0.0864
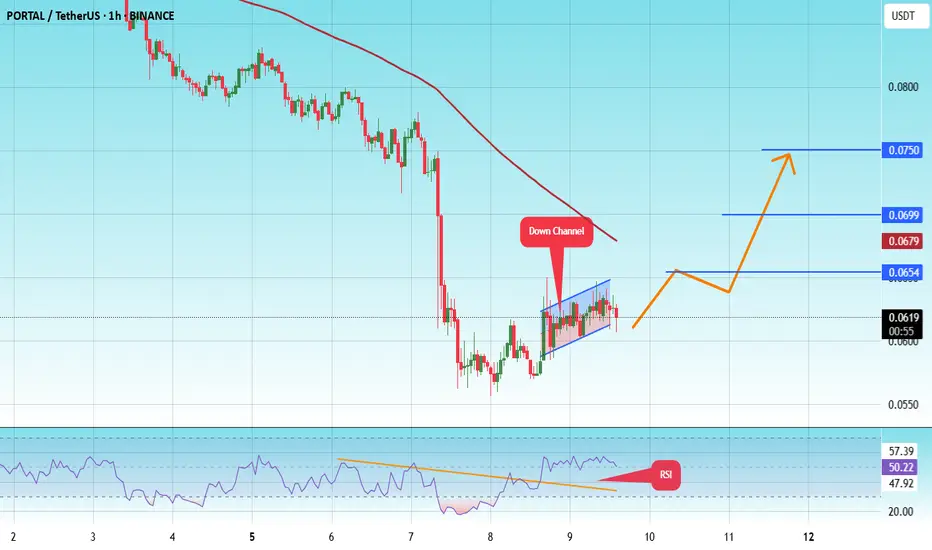
#PORTAL/USDT#PORTAL
The price is moving within an ascending channel on the 1-hour frame and is expected to break and continue upward.
We have a trend to stabilize above the 100 moving average once again.
We have a downtrend on the RSI indicator, which supports the upward move by breaking it upward.
We have a support area at the lower limit of the channel at 0.0600, which acts as strong support from which the price can rebound.
Entry price: 0.0616
First target: 0.0654
Second target: 0.0700
Third target: 0.0750
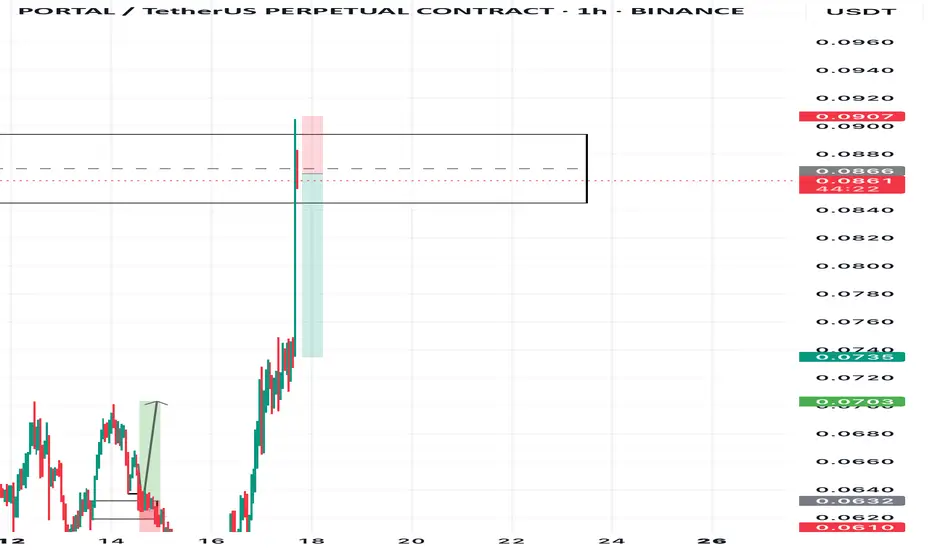
PORTALUSDT NEXT MOVE?PORTAL/USDT recently broke out above the 0.0865-0.0886 resistance but has pulled back to retest this zone. At 0.0865 is showing signs of rejection at this level, indicating potential weakness.
Key Levels: The 0.0865 level, previously resistance, may fail to act as support. A break below could confirm bearish momentum.
Support Levels: If the price breaks below 0.0865, the next support levels are at 0.0800 and 0.0735
Enter a short position if the price breaks and closes below 0.0865, with a stop-loss above 0.0886 and a target at 0.0800 or 0.0735.
$PORTAL - Long Trade IdeaBINANCE:PORTALUSDT | 4h
It can spike to 0.078 - 0.083
We can either take a long here at cmp with some risk or wait for the first rejection and enter on the pullback
Re-entry: .074 to .068
Stoploss: below .057
TPs:
.078 - .083
.093 - .105
.117 - .126
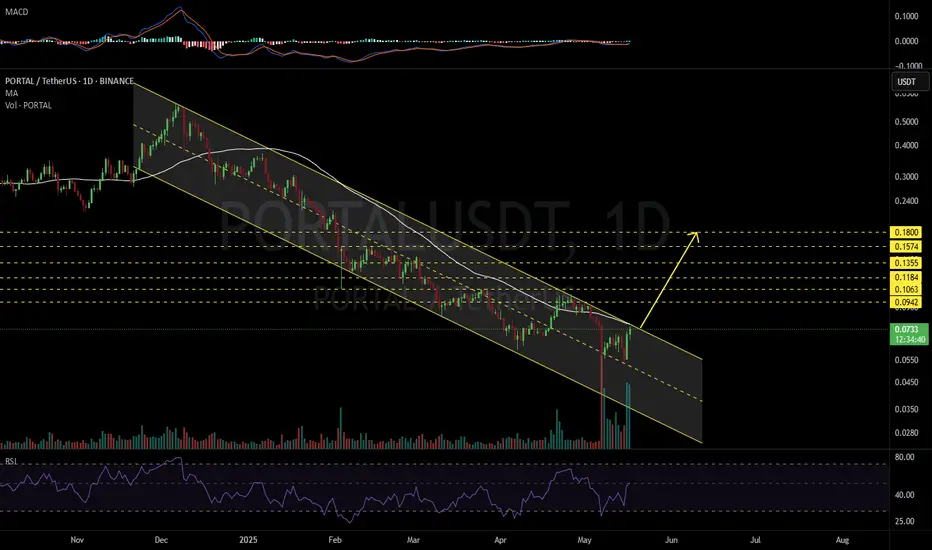
PORTALUSDT 1D#PORTAL is moving inside a descending channel on the daily chart. It is on the verge of breaking out above the channel resistance and the daily MA50. In case of a breakout, we expect a 200 ~ 250% bullish rally in the coming weeks. The targets are:
🎯 $0.0942
🎯 $0.1063
🎯 $0.1184
🎯 $0.1355
🎯 $0.1574
🎯 $0.1800
⚠️ Use a tight stop-loss.
PORTAL: Close Stop-Loss, High Targets#PORTAL, listed on Binance in Feb 2024, faced heavy selling pressure, crashing over -95% since launch, raising concerns about Binance's integrity.
However, maintaining $0.0666 is critical as it opens the door for a strong recovery, but losing it risks new ATLs.
#Portal
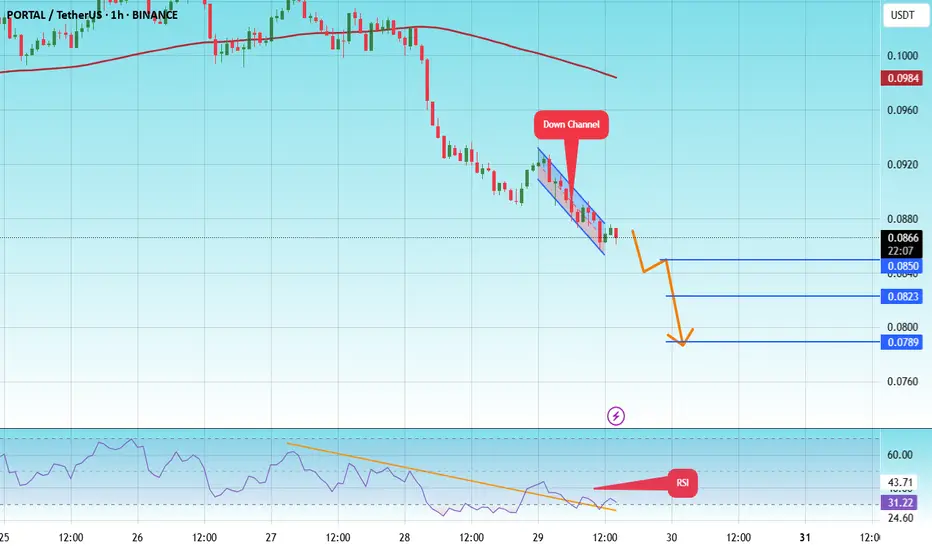
#PORTAL/USDT#PORTAL
The price is moving within a descending channel on the 1-hour frame and is expected to continue lower.
We have a trend to stabilize below the 100 moving average once again.
We have a downtrend on the RSI indicator, supporting the upward move with a break above it.
We have a resistance area at the upper limit of the channel at 0.0880.
Entry price: 0.0866
First target: 0.0850
Second target: 0.0823
Third target: 0.0788
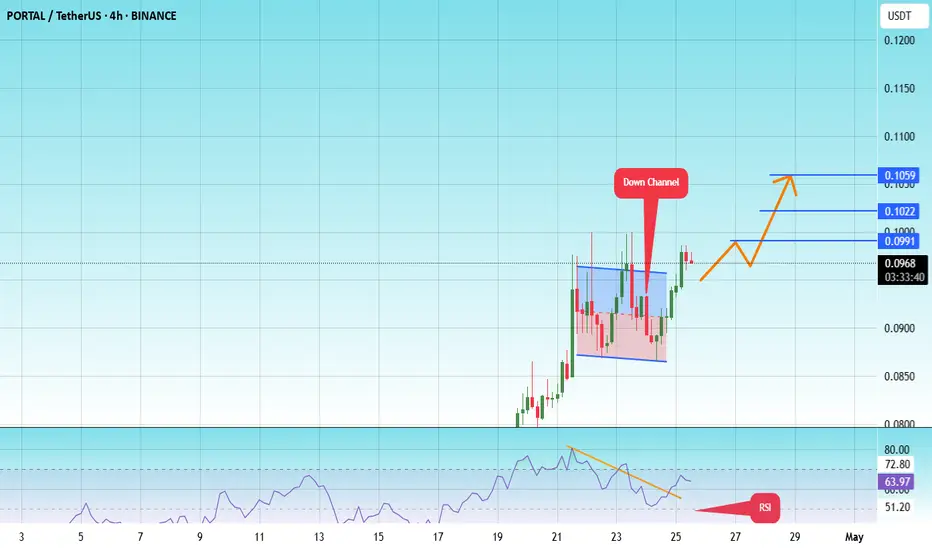
#PORTAL/USDT#PORTAL
The price is moving within a descending channel on the 1-hour frame and is expected to break and continue upward.
We have a trend to stabilize above the 100 moving average once again.
We have a downtrend on the RSI indicator, which supports the upward move by breaking it upward.
We have a support area at the lower limit of the channel at 0.0871, acting as strong support from which the price can rebound.
Entry price: 0.0950
First target: 0.991
Second target: 0.1022
Third target: 0.1060
PORTALUSDT 1D AnalysisPORTAL ~ 1D Analysis
#PORTAL Managed to penetrate this resistant line, Buy when re -testing this support block with a short -term target of at least 10%+.