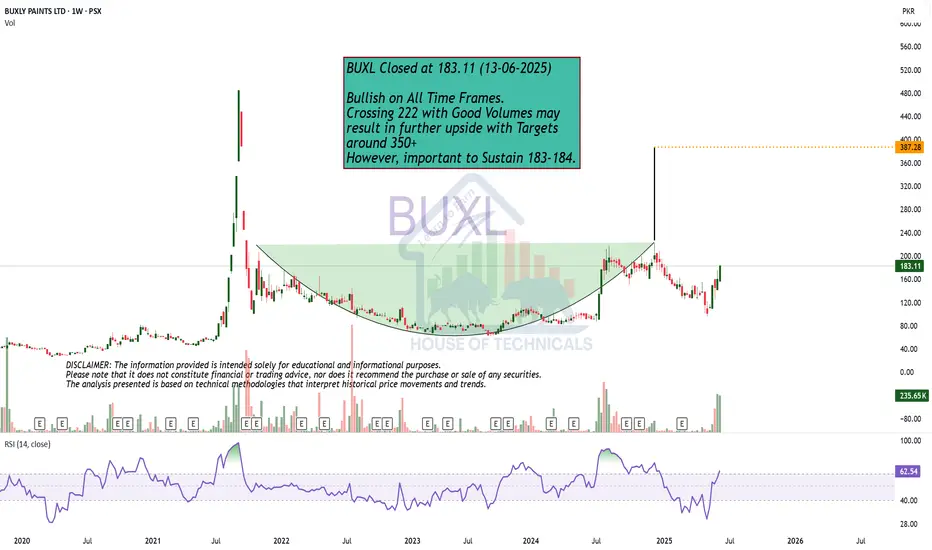
BUXL LONG TRADE/INVESTMENT CALL (SECOND STRIKE) 15-06-2025BUXL – Buy Call on 1W Time Frame (Second Strike) 15-06-2025
Past Price Action:
Since its listing on PSX in February 2013, BUXL has maintained a steady long-term uptrend. After a correction, the stock surged in June 2021, reaching Rs. 485. Following another pullback, it entered a weekly accumulation phase from December 2022.
BUXL Recent Price Action:
BUXL broke out of this consolidation with strong volume momentum, signaling renewed bullish potential. A bull flag formation was observed, with a peak at Rs. 216 before retracement.
✅ Our earlier call’s first target of Rs. 184 has been successfully achieved.
🚨 TECHNICAL BUY CALL – BUXL🚨
- Buy 1: Rs. 185 (CP)
- Buy 2: Around Rs. 150
- Buy 3: Rs. 124
- TP 1: Rs. 240
- TP 2: Rs. 284
- Long-term TP 1: Rs. 361
- Long-term TP 2: Rs. 427
- Long-term TP 3: Rs. 484 (previous all-time high)
- Extended Target: Rs. 584 (calculated through Fibonacci ratio extension)
- Stop Loss: Below Rs. 80
- Risk-Reward Ratio: 7.6
Caution: Please buy on levels in 3 parts. Close at least 50% position size at TP1 and then trail SL to avoid losing incurred profits in case of unforeseen market conditions.
BUXL trade ideas
BUXL LONG TRADE 02-06-2025BUXL long trade WEEKLY TF
- BUXL was in a slight uptrend since its inception in PSX, making a high of 160. It then went into a downtrend, making a low of 25.
- The stock saw an extreme upward spike from July 2021, marking a high of 485. This was followed by a sharp downward correction and an accumulation zone from December 2022 to July 2024.
- After the accumulation, the stock went into an uptrend, forming a trading range between 140-220. It then entered a corrective downward move but recently showed strong signs of reversal upwards.
- The stock has taken support from a bullish trend line (blue dotted line) and formed a bullish IFDZ, bullish fair value gap, and marked a higher low.
- Volume gradient predicts an impending or continuing upward move.
🚨 TECHNICAL BUY CALL – BUXL🚨
- BUY1: 167 (current level)
- BUY2: 145
- BUY3: 126
- TP1: 187
- TP2: 220
- Long-term TP1: 250
- Long-term TP2: 285
- Stop loss: below 80
- Reward-to-risk ratio: 3.4
Caution: Close at least 50% position size at TP1 and then trail SL to avoid losing incurred profits in case of unforeseen market conditions.
PLEASE BOOST AND SHARE THE IDEA IF YOU FIND IT HELPFUL.
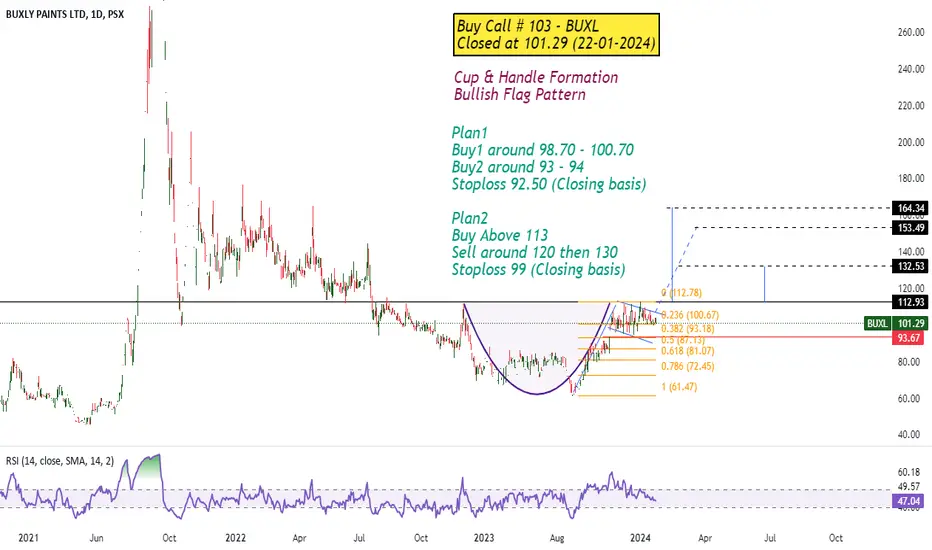
BUXL Offering 35-40% Capital upside from these levelsBUXL if give day's closing above 217 it will be marching towards 306 which is the final projection of the bullish Flag.
However, owing to the current market situation, it will be wise to put your SL in place which is 150.23, Instant Entry can be taken here with first TP at 283 and second TP of 349, however, bear in mind that as per final projections of the Bullish Flag, it will be wise to close your trades @ 300-306 levels
Buying on these levels provide an opportunity for 35-40% capital upside
BUXL | An underdog with great long term potential!On the weekly timeframe, the price is hovering above the 200-day EMA line, signifying a robust bullish trend and moving in a cup pattern. Furthermore, the RSI is at the 58 level, indicating potential upside. Upon horizontal analysis, the price was rejected from its resistance level around 111.98 in January 2024, which previously acted as support. Upon breaching this level, the next resistance lies around 140, where selling is expected, and the cycle continues. This idea is based on the long term and applies many factors, such as each time the price faces resistance, selling is expected, and upon breakout, only the next upper side can be expected. On the flip side, if the price breaks below the 200-day EMA, then a bearish sentiment is established. This stock is currently categorized as illiquid, so investors are recommended to perform due diligence fundamentally and technically before entering.