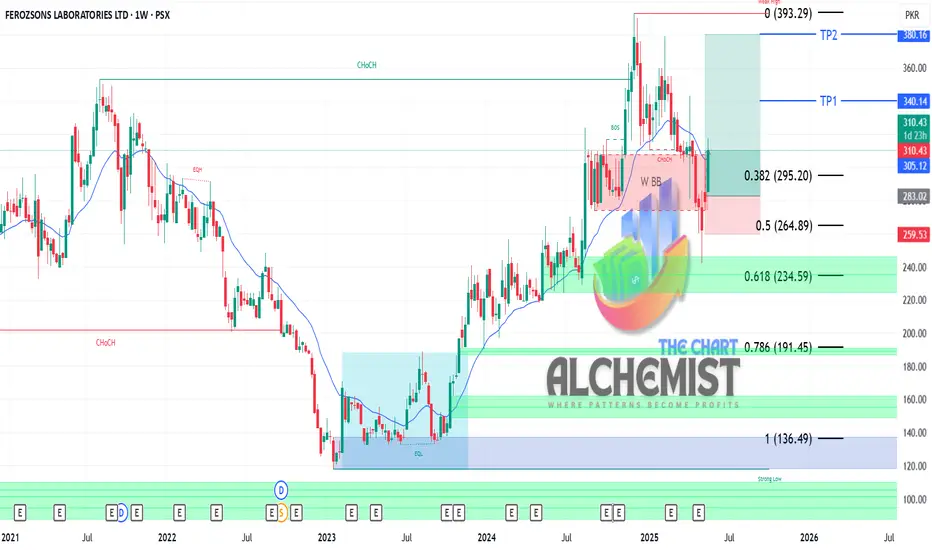
Bearish Divergence on Weekly tf.FEROZ Update
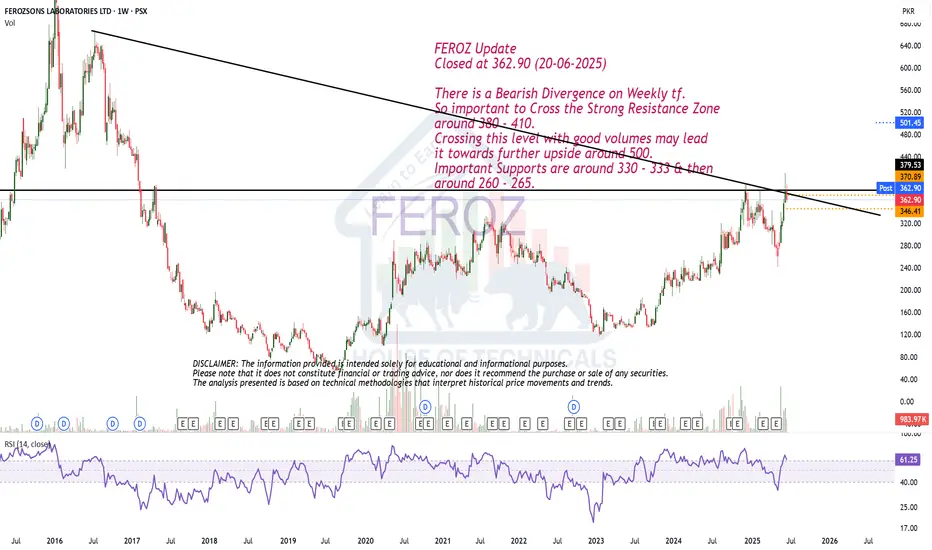
Closed at 362.90 (20-06-2025)
There is a Bearish Divergence on Weekly tf.
So important to Cross the Strong Resistance Zone
around 380 - 410.
Crossing this level with good volumes may lead
it towards further upside around 500.
Important Supports are around 330 - 333 & then
around 260 - 265.
FEROZ trade ideas
Stock is Bullish but..
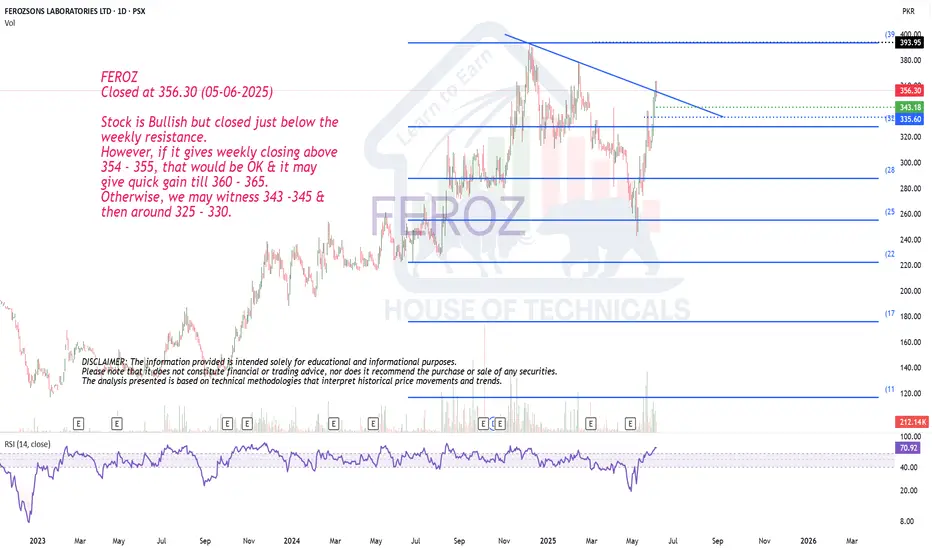
Closed at 356.30 (05-06-2025)
Stock is Bullish but closed just below the
weekly resistance.
However, if it gives weekly closing above
354 - 355, that would be OK & it may
give quick gain till 360 - 365.
Otherwise, we may witness 343 -345 &
then around 325 - 330.
FEROZ LONG (SECOND STRIKE TRADE) 02-06-2025FEROZ LONG TRADE was shared here. ()
FEROZ has resumed its upward trajectory after a healthy correction from its December 2024 high of Rs. 393, retracing close to the 61.8% Fibonacci level — a key support zone.
Bullish technical confirmation:
• Price closed above the 20-Day EMA, signaling short-term strength.
• Higher Low formation, indicating potential trend reversal.
• Increased volumes on the recent up-move, suggesting strong accumulation.
With technical indicators aligning positively, a fresh uptrend appears to be in play. Buy on dips or at CMP for potential upside towards previous highs.
It Hit TP1 and took a pull back. We gave a rebuy call on group during live market hours. Its again in second Pull Back after Targeting 350 (TP1++).
Sharing Second Strike Call.
🚨 TECHNICAL BUY CALL – FEROZ🚨
BUY1: 330-335
BUY2: 322
BUY3: 311
📈 TP1 : Rs. 350
📈 TP2 : Rs. 380
🛑 STOP LOSS: BELOW Rs. 270 (Daily Close)
📊 RISK-REWARD: 1:1.8 (Medium)
Caution: Close at least 50% position size at TP1 and then trail SL to avoid losing incurred profits in case of unforeseen market conditions.
PLEASE BOOST AND SHARE THE IDEA IF YOU FIND IT HELPFUL.

Very Good Monthly Closing.
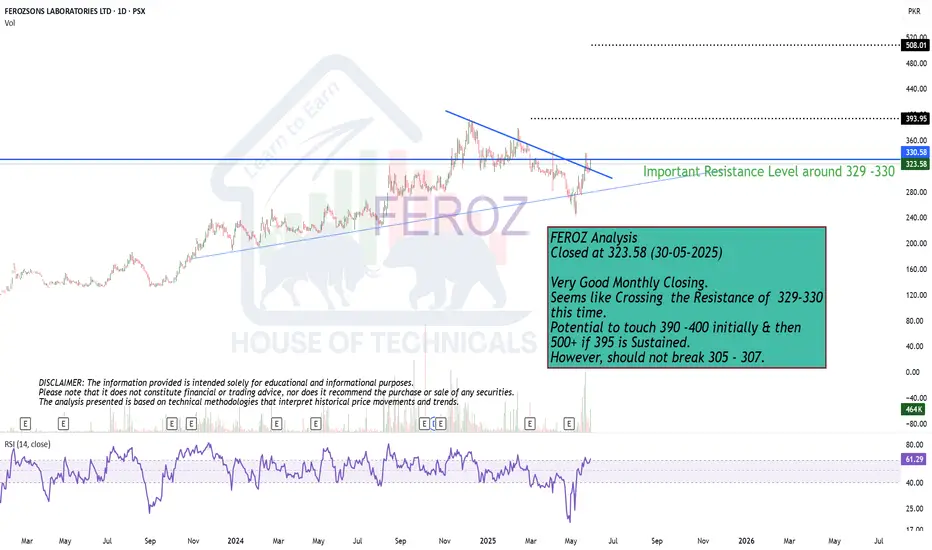
Closed at 323.58 (30-05-2025)
Very Good Monthly Closing.
Seems like Crossing the Resistance of 329-330
this time.
Potential to touch 390 -400 initially & then
500+ if 395 is Sustained.
However, should not break 305 - 307.
FEROZ LONG TRADE FEROZ was in uptrend from Oct 2023 till Dec 2024 and plotted a high of 393.Afterwards, it took a healthy correction nearly to Golden Ratio of Fibonacci Retracement. It has recently confirmed its Bullish Reversal and
1. Crossed above 1D 20 EMA
2. Posted a Higher Low
3. Evidently Heavier Volumes on Up leg so far
🚨 TECHNICAL BUY CALL – FEROZ🚨
🎯 BUY ZONE: Rs. 290-310
📈 TP1 : Rs. 339
📈 TP2 : Rs. 380
🛑 STOP LOSS: BELOW Rs 259 (Daily Close)
📊 RISK-REWARD: High Conviction | 1:4
Caution: Please close at least 50% position size at TP1 and then follow strict trailing SL to avoid losing incurred profits in case of unforeseen market conditions
PLEASE BOOST THE IDEA IF YOU FIND IT HELPFUL.
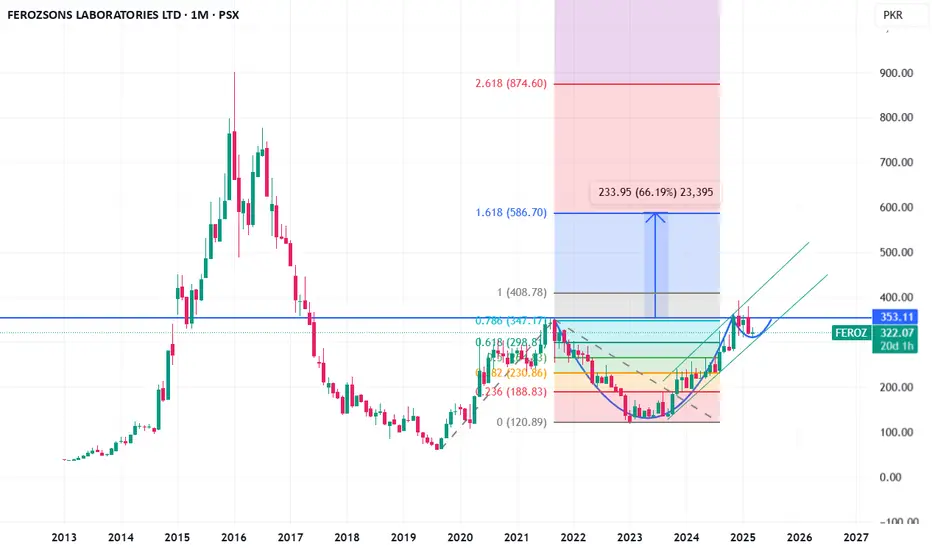
Feroz - Long Feroz is making cup and handle formation. Further, it is in an upward trend, breaking which may lead it to go beyond 550 (Exact medium term targets mentioned in chart). In the longer run, (1.5 to 2 years), it may again touch its all time high (900+).
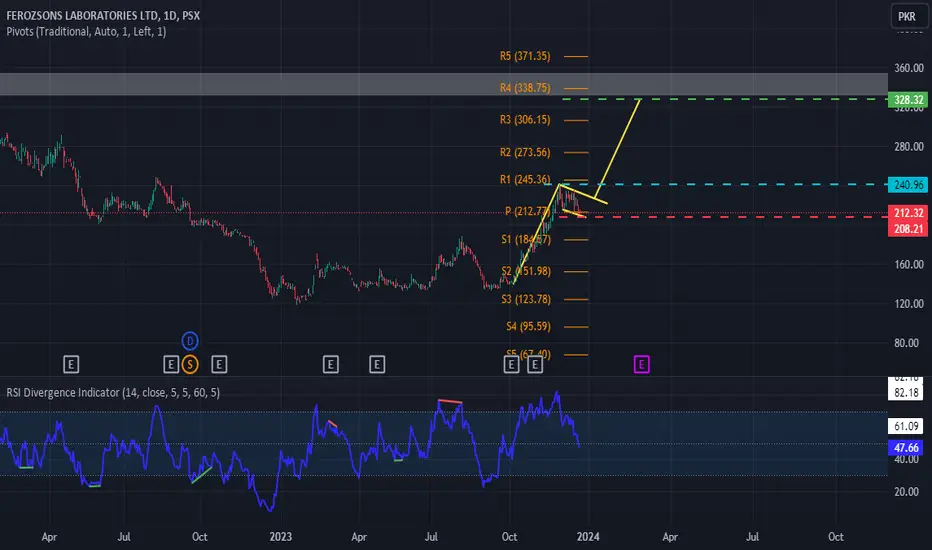
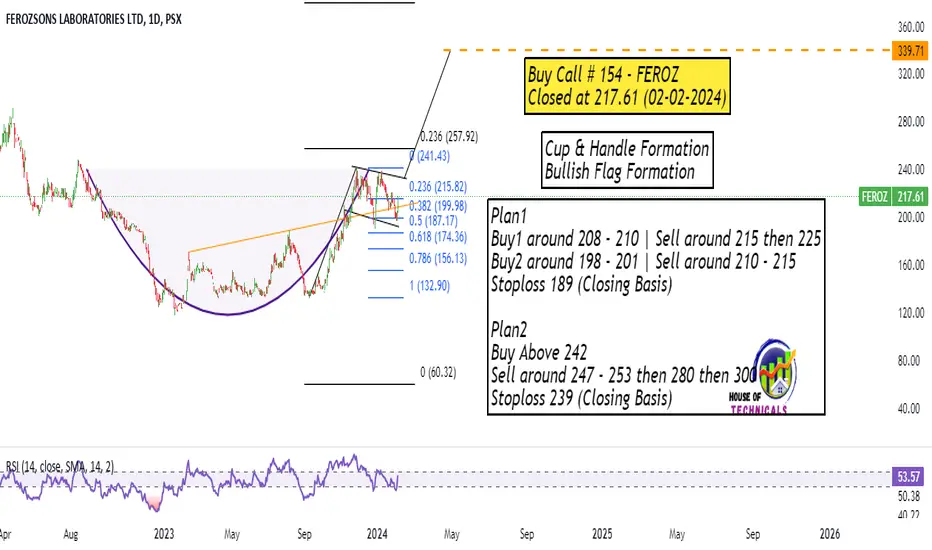
Cup & Handle Formation; Bullish Flag FormationPlan1
Buy1 around 208 - 210 | Sell around 215 then 225
Buy2 around 198 - 201 | Sell around 210 - 215
Stoploss 189 (Closing Basis)
Plan2
Buy Above 242
Sell around 247 - 253 then 280 then 300
Stoploss 239 (Closing Basis)
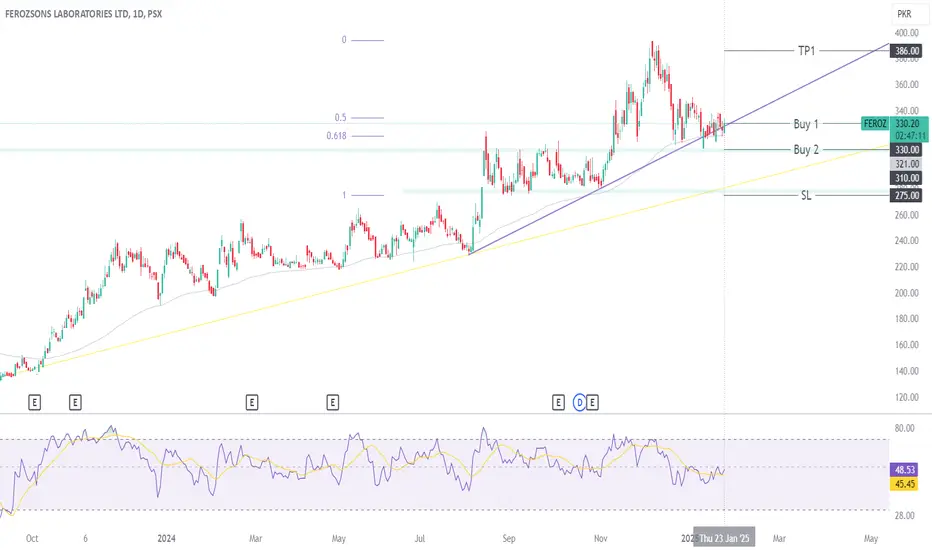
Feroz Technical Analysis: Potential Buy OpportunityFeroz currently displays a bullish trend supported by key indicators. Price has rebounded from a trendline and is trading above the 89-day EMA, a historically significant support level respected by the price action. A recent support zone bounce and alignment with the Fibonacci Golden Ratio further strengthen the bullish outlook. Buy levels are 330 (CMP) and 310, with a stop-loss set on a closing price below 275.
Happy trading!
FEROZ is showing a Bullish Flag on 1D timeframeFEROZ is in uptrend as it is forming HHs and HLs on 1D timeframe. The price chart has formed shape of a Bullish Flag whereas RSI shows no divergence. As a rule of thumb, entry position has been marked on chart in BLUE on breakout of pole. Target has been placed in GREEN. SL is visible in RED. The stock looks like a good buy at trigger levels.