KSE 100 INDEX UPDATE 13-06-2025KSE 100 Index Technical Analysis 13-06-2025
The KSE 100 index recently reached a historical high of 126,700 before entering a much-needed pullback, a common technical requirement after a breakout. Currently, the index is trading within a small range of 121,800 to 122,860.
Key Scenarios:
- *Breakout Scenario*: If the KSE 100 breaks above this range in a bullish direction and closes above it on a 1-hour basis, the pullback can be considered complete. This might lead to a continuation of the uptrend.
- *Retracement Scenario*: Alternatively, the KSE 100 could retrace its pullback to the previous high-low level of 120,800.
Additional Observation:
On a lower time frame, the KSE 100 has made a trend line (shown in blue dotted line). The index may respect this line. Notably, this line coincides with the breakout level, making scenario two (retracement scenario) more likely. Given this alignment, the KSE 100's potential retracement to 120,800 seems more probable.
KSE100 trade ideas

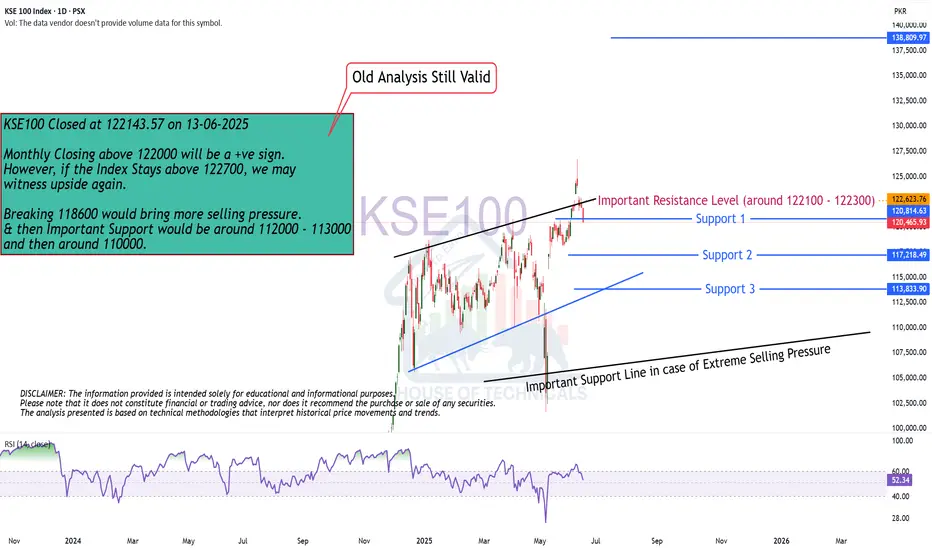
Monthly Closing above 122000 will be a +ve sign.KSE100 Closed at 122143.57 on 13-06-2025
Monthly Closing above 122000 will be a +ve sign.
However, if the Index Stays above 122700, we may
witness upside again.
Breaking 118600 would bring more selling pressure.
& then Important Support would be around 112000 - 113000
and then around 110000.
KSE-100 UPDATE/ANALYSIS 16-06-2025KSE 100 Update 1H TF
Current Situation
KSE 100 remains range-bound between immediate resistance at 122,870 and immediate support at 121,820. The index couldn't break out above the resistance and neither continued its pullback to the all-time high breakout level of 120,800.
Future Possibilities
Two scenarios exist:
1. *Breakout and Upside Movement*: KSE 100 breaks above the immediate resistance level and continues its upward trajectory towards long-term targets, potentially reaching 138,300.
2. *Pullback and Retest*: The index completes its pullback and retests the breakout level.
These possibilities will guide the index's next movement.
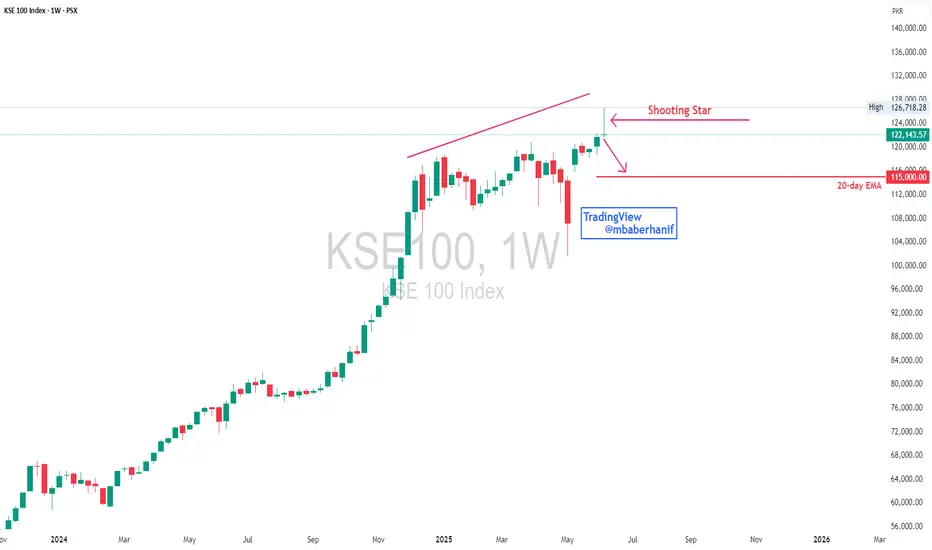
KSE 100 | Shooting Star Candle FormationThe KSE-100 index weekly chart shows a strong uptrend that has recently started to face some signs of exhaustion. After a sustained bullish rally, the index is encountering resistance near the 126,700 level, forming a Shooting Star candlestick — a bearish reversal signal — indicating potential selling pressure at the top. Additionally, there's a clear volume decline during the recent uptrend, suggesting weakening momentum and possible buyer fatigue. The key short-term support lies near 115,000, aligned with the 20-week EMA. A break below this level may trigger further downside correction. Overall, while the longer-term trend remains bullish, caution is advised as bearish reversal signals are emerging; a corrective phase may unfold if support levels fail to hold.
KSE-100 UPDATE 19-06-2025KSE100 Analysis Update:
As previously mentioned, the KSE100 index is retesting its recent all-time high breakout level. Currently, the index is moving downwards towards the support zone/block created during the breakout, positioned @ 119200 to 120800. This level is expected to provide immediate support.
*Key Support Levels:*
- *Immediate Support:* 119100 - 120800
- *Next Support:* 115100 - 114000 are the next support levels if it breaks 119200 level
*Trend Line Support:* The index is also taking support from a newly formed trend line (dotted blue), which adds to the likelihood of a rebound from current levels.
*Investor Advice:*
- *Avoid New Buying:* It's advisable to exercise caution and avoid new buying until the index shows clear signs of direction.
- *Strictly Watch Levels:* Monitor key levels closely, including support zones and trend lines, to make informed decisions.
The index's behavior around the current support zone will be crucial in determining its next move.

Monthly Closing above 122000 will be a +ve sign.KSE100 Closed at 122143.57 on 13-06-2025
Monthly Closing above 122000 will be a +ve sign.
However, if the Index Stays above 122700, we may
witness upside again.
Breaking 118600 would bring more selling pressure.
& then Important Support would be around 112000 - 113000
and then around 110000.

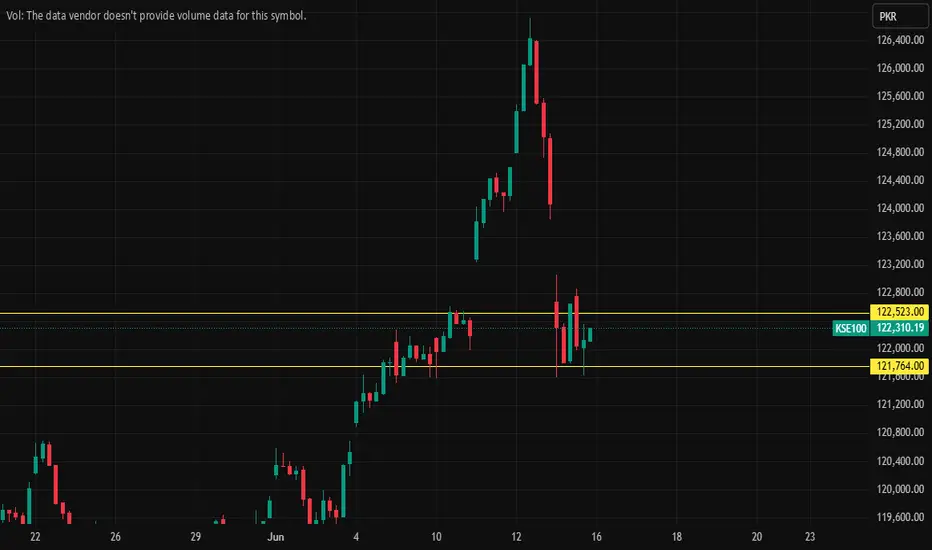
PSX 100 index zones 16/5/2025PSX 100 index zones for 16/6/2025
Bullish 122523
Bearish 121764
It is expected in bullish zone. Note: This is not a buy/sell trade call. It is an analysis.
KSE-100 UPDATE 12-06-2025KSE 100 Index Technical Analysis
The KSE 100 index has been performing well after its breakout from the all-time high, achieving multiple targets as expected. Despite some retracement in the last 2-3 hours, the index remains mostly bullish. The small pullbacks are expected in any uptrend.
Current Market Situation
- The index is currently testing its EMA 20 of 1-hour timeframe.
- A rebound from this level is expected in the coming sessions.
Possible Scenarios
- If the index rebounds from the current level, it will likely continue its upward trend.
- If it fails to rebound, there's a possibility of a retest of the recent breakout level at 120,800.
Support Level
- The index is expected to find support at the EMA 20 of 1-hour timeframe and rebound from there.
Overall, the KSE 100 index is expected to remain bullish, and the current pullback is seen as a buying opportunity.
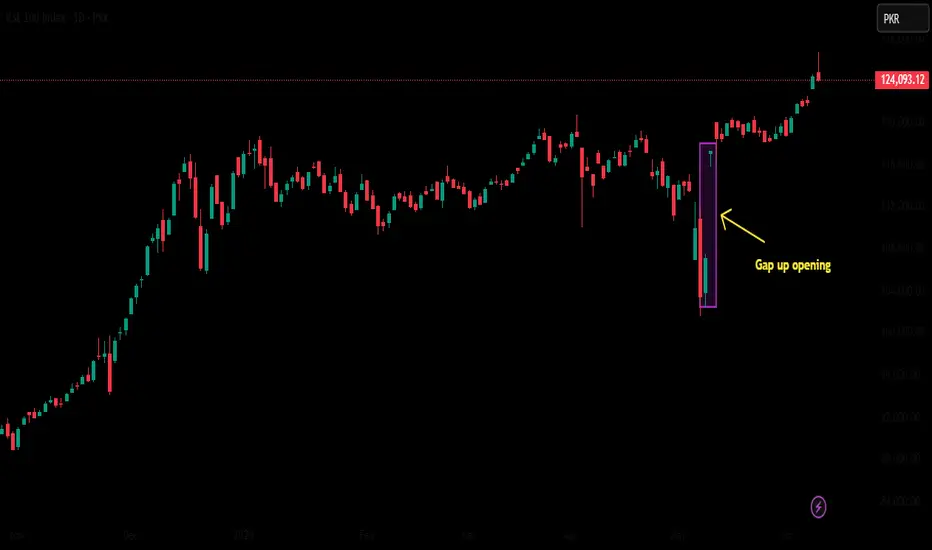
KSE 100 | Gap UP OpeningKSE 100 gave a gap up opening after budget of fiscal year 2025-26.Sometimes these gap up or gap down openings are triggered by some news.
KSE-100 UPDATE & ANALYSIS 11-June-2025The KSE 100 index has continued its upward trajectory, as previously mentioned, with a long-term bullish outlook. We had outlined three short-term targets, and the index successfully achieved the first two targets on the day of the breakout from its all-time high. The final short-term target was revised to a long-term target of 123,280, which was reached today.
We had forecasted three long-term targets for the index, with the final target being 138,670. We expect the index to reach this level before experiencing significant corrections. While pullbacks are anticipated during the index's journey, we expect them to be shallow.
The current trend suggests continued upward momentum. We recommend traders to remain on the buy side, watching the index closely as per the levels provided by us. It's essential for traders to trail their stop-loss levels to preserve incurred profits and maximize gains.
KSE100-BEARISHAT that time market is bearish according to patterns here is three patterns 1. rectangle 2. bearish peanut 3 bearish flag at 15 minute time frame.

KSE-100 ANALYSIS/UPDATE (10-June-2025)KSE-100 INDEX (10-June-2025)
As previously stated, the KSE 100 Index broke out from its all-time high of around 120,880 points. Following this breakout, the index completed its spike phase and is currently undergoing a channel phase in the short-term uptrend.
We had previously identified three short-term targets, two of which were achieved on the breakout day. The third target, now referred to as TP1 in the long-term outlook, is around 123,280 points. We expect the KSE 100 Index to reach this level in the next day or two.
After achieving this target, we foresee some consolidation or minor correction before the index resumes its upward trajectory towards the long-term targets, which extend up to 138,680 points.
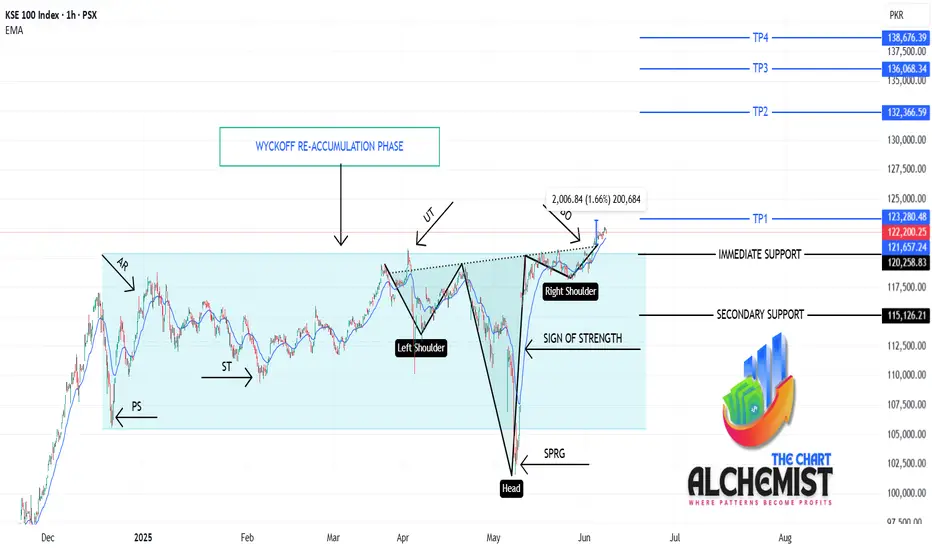
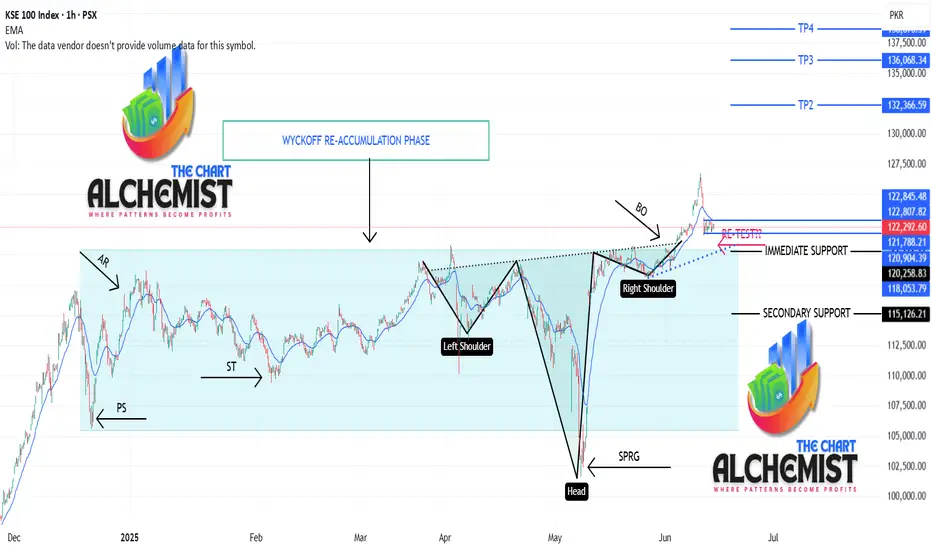
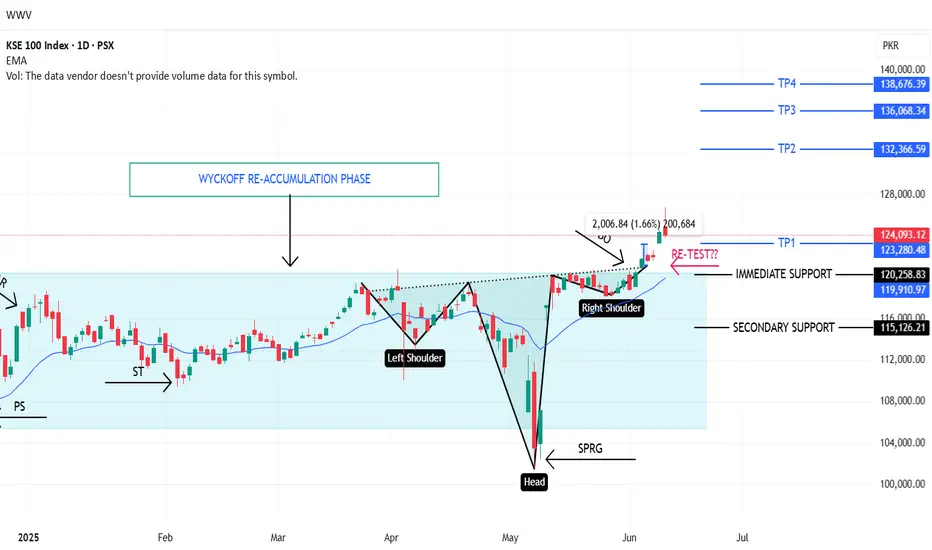
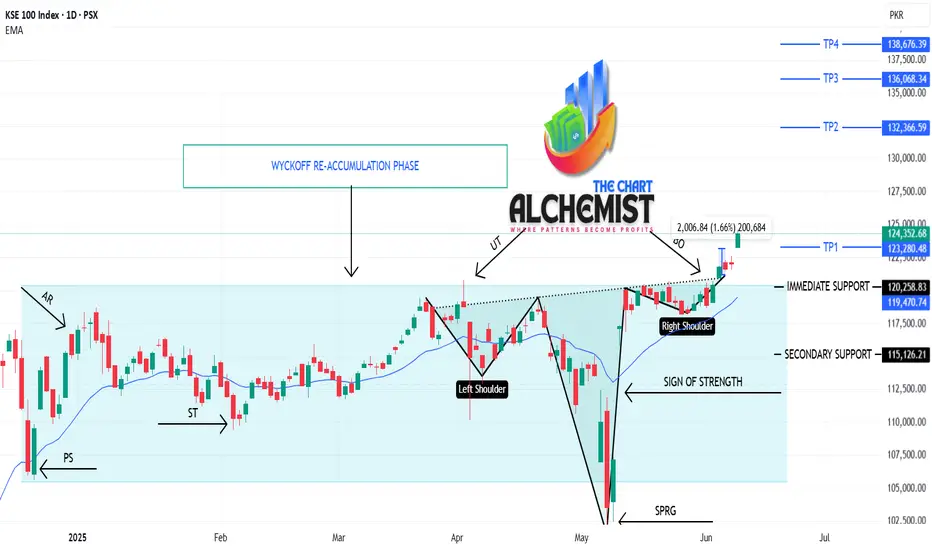
KSE100 UPDATE ON 1D AND FUTURE TARGETSKSE100 gave much awaited Breakout above its ATH yesterday.
It has been trading in a range since Dec 2024.
This Trading Range gradually shaped up into Wyckoff Re-accumulation Phase.
After performing requisite Wyckoff Events like PS, AR, ST UT, SPRG, SOS, it broke out the range with supportive Volume Gradients and Price Action.
We had predicted three immediate target levels for the index, out of which two were achieved yesterday. The third one around 1,23,280 is shown on today's chart as TP1 on 1D.
Other targets calculated from various Measured Moves have also been marked on the chart.
TP1 -- 1,23,280
TP2 -- 1,32,360
TP3 -- 1,36,000
TP4 -- 1,38,670
Immediate Support -- 1,20,200
Secondary Support -- 1,15,100

KSE UPDATE 04/06/2025(LTF)As predicted yesterday, KSE100 broke its ATH today, others were never clear when will it happen.
Also KSE100 attained 2 out 3 short term targets today and is on its way to TP3 as marked.
In days after Eid and Budget KSE100's next measured target is 1,33,000 In Sha Allah.
HTF Analysis of KSE100 will be posted tomorrow or day after.
So at last now "KSE100 is always in Long".

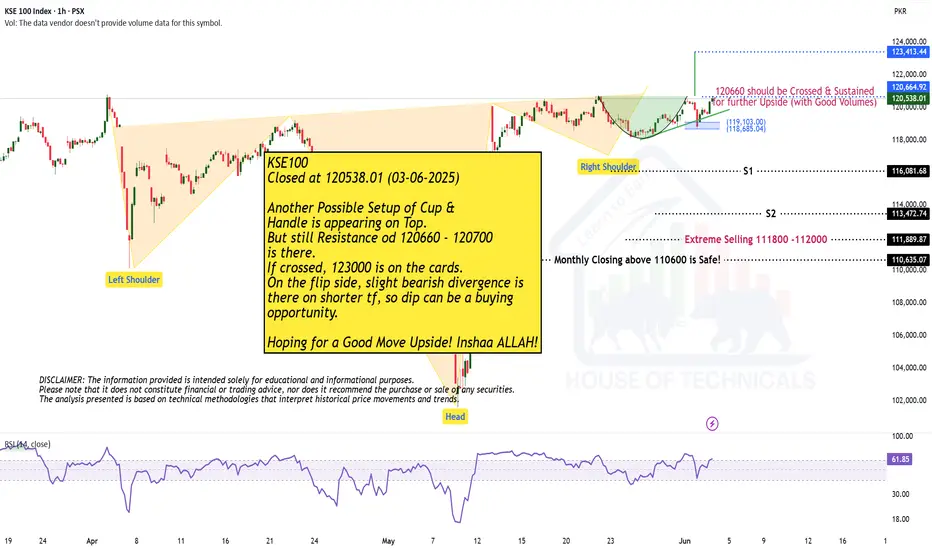
KSE-100 UPDATE/ANALYSIS 03-06-2025We had previously advised caution against excessive bullishness due to the strong resistance at the all-time high (ATH) level of 120,800. At that time, the index was forming a Head & Shoulders (H&S) pattern on both the 15-minute and 1-hour timeframes — a typically bearish formation. Fortunately, the index did not break below the neckline of that pattern.
Instead, we are now observing the formation of an inverted Head & Shoulders, which is a bullish reversal pattern. This shift in structure, combined with today's strong closing, positive volume distribution, and notably higher buying volumes, supports our bullish outlook.
A breakout above the ATH level is now anticipated, and in the event of a successful breakout, our projected targets for the KSE-100 are:
TP1: 120,544
TP2: 121,878
TP3: 123,271
While the ATH resistance has not yet been breached, we expect this level to be tested and potentially broken in tomorrow’s session.

Another Possible Setup of Cup & Handle
Closed at 120538.01 (03-06-2025)
Another Possible Setup of Cup &
Handle is appearing on Top.
But still Resistance od 120660 - 120700
is there.
If crossed, 123000 is on the cards.
On the flip side, slight bearish divergence is
there on shorter tf, so dip can be a buying
opportunity.
Hoping for a Good Move Upside! Inshaa ALLAH!
KSE100 UPDATE 2/6/25We have been telling all along that Index is bearish, though it has been in a Pullback Rally which is forming right shoulder of H&S pattern.
Index will be considered bullish only when it crosses and closes above 1,21,000 on 1D basis.
Till then we should avoid impulsive buying and observe given Entry/Exit levels with strict Stop loss levels as given for each Scrip.
On positive side the Index is very much safe above 1,18,000 level. Beyond that Secondary Support lies at 1,15,100, which also happens to be target level in case of Breakdown of neckline of H&S Pattern

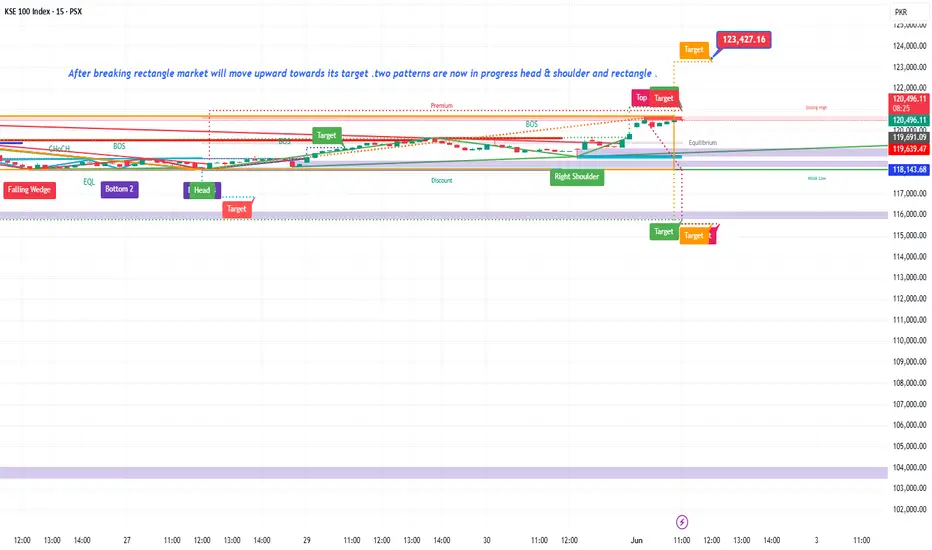
KSE100-BULLISH ON 15 MINTwo pattern are in progress at 15 min time frame Head & shoulder and Rectangle these shown bullish movementum in future so keep watching levels for breakouts.
KSE-100 UPDATE 30-May-2025Today’s powerful closing although has decreased the chances of scenario discussed in precious update, the scenario involved KSE-100 making H&S top and going downwards. But it has not totally eliminated the bearish probability. Much depends on KSE-100 continuing its Price Action in the enclosure of upward channel (blue).
If the Price Action falls below the same channel and closes on 1H – then it may continue to form the Right Shoulder of the H&S pattern whose downward targets were previously discussed.
It is once again reiterated that market will be considered Bullish only if it crosses its ATH ie. 120,780 on Daily Closing Basis. Before crossing that crucial level, the market can Breakdown of the 1H channel and resume its Bearish trajectory.
As many times said previously - “the index is safe above 118,100 level”.

KSE100 UPDATEIt was discusses yesterday that the Index has broken down from Double Top Formation and is bearish on Short Term.
Though the INDEX IS STILL BEARISH TILL IT CROSSES ABOVE THE PREVIOUS TOP OF THIS DT FORMATION. But the index seems in the process of converting the DT formation into a HEAD AND SHOULDERS TOP.
IMMEDIATE SUPPORT SAME-- 1,18,170 (Index is safe above this support)
IMMEDIATE RESISTANCE WILL BE TODAY'S TOP --1,19,660
We shouldn't be carried away with bullish emotions after today's rally, till Index confirms its uptrend by breaking and sustaining above its ATH.

KSE-100 UPDATE 27-MAY-2025As previously explained KSE-100 broke the immediate support and resultantly, it has formed a Bearish Breaker Block at 118,540, it also has given Breakdown of Double Top Formation.
After breakage of the immediate support and Double Top Formation, the Measured Move target for DT Formation below is @116,100. Nearest support at this level is in the form of Bullish Breaker Block lies @115,100.
The index is in BEARISH MODE at LTF/Short Time Frame. The Index is trading below EMA-20 at 1H TF. Today's minor rally was just a Pullback to the Breakdown level.
STRICT ADHERENCE TO STOP LOSSES & OPENING OF SUGGESTED SHORT POSITIONS IS RECOMMENDED.
In wise words of Al-Brook - “THE INDEX AT THE MOMENT IS STILL ALWAYS IN SHORT” on LTF.

KSE-100 UPDATE (26-MAY-2025)KSE-100 broke the immediate 1H support which was discussed yesterday. Resultantly, it has formed a Bearish Breaker Block at 118,540.
After breakage of the immediate support, the Measured Move target below is @116,580. Nearest support at this level is in the form of Bullish Breaker Block lies @115,100.
The index has switched to BEARISH MODE at LTF/Short Time Frame. The Index is trading below EMA-20 at 1H TF.
STRICT ADHERENCE TO STOP LOSSES & OPENING OF SUGGESTED SHORT POSITIONS IS RECOMMENDED.
As the famous Al-Brook says - “THE INDEX AT THE MOMENT IS ALWAYS IN SHORT” on LTF.

KSE-100 UPDATE 25-MAY-2025KSE-100 has failed to breakout of the ATH resistance for several days now. On LTF, it has formed many Bearish ERCs - which indicate further Bearish Follow through in coming week.
On Monday if Market holds above 1,19,530 for at least one hour only then take new positions.
Resistance is same 1,20,750.
If the market stays between 1,19,530 and 1,18,630 just wait and watch.
If the market goes below 1,18,600 and stays below there for at least one hour you can take short positions .
In case of this breakdown lower supports are 1,18,100 and 1,16,600 followed by 1,15,100.
Disclaimer:
This analysis of the KSE-100 Index is based on our understanding of technical charts and market trends. It is for informational purposes only and should not be considered financial advice. We recommend that all traders perform their own analysis before making any trading decisions.
