PACE LONG TRADE 16-06-2025PACE LONG TRADE
Rationale
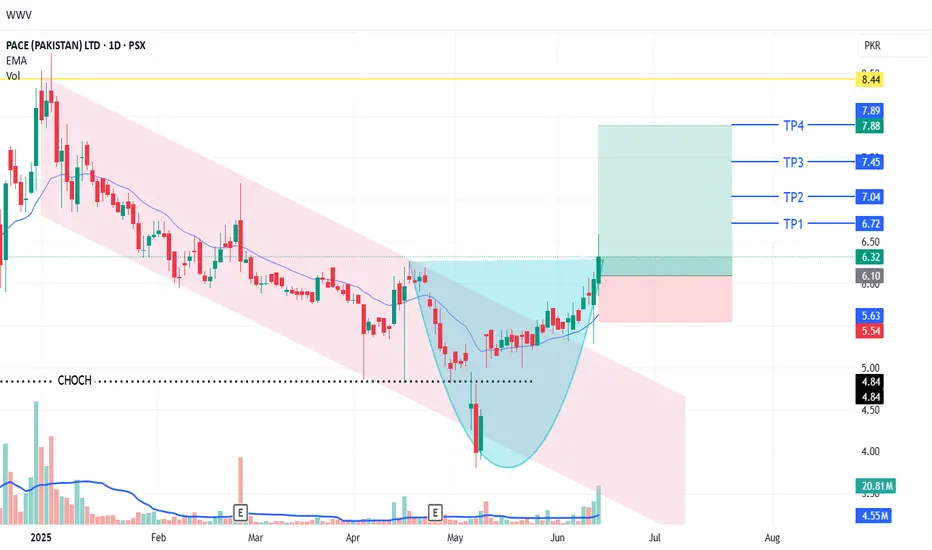
PACE recently completed an ABC correction within a bearish channel, which acted as a bull flag. The stock broke out of this channel with significantly high volumes (5x) and strong follow-through, indicating potential upside.
🚨 TECHNICAL BUY CALL – PACE🚨
- Buy 1: Current level (Rs. 6.32)
- Buy 2: Rs. 5.9
- Buy 3: Rs. 5.7
- TP 1: Rs. 6.7
- TP 2: Rs. 7.0
- TP 3: Rs. 7.4
- TP 4: Rs. 7.8
Stop Loss - Below Rs. 5.5 closing basis
Risk-Reward Ratio- 1:3.2
Caution: Close at least 50% position size at TP1 and then trail SL to avoid losing incurred profits in case of unforeseen market conditions.
PLEASE BOOST AND SHARE THE IDEA IF YOU FIND IT HELPFUL.
PACE trade ideas
PACE SHORT SELL TRADE 19-03-2025 (FLIP TRADE SET-UP)PACE Flip Trading Setup (Short Sale):
After breaking out from a downward channel, PACE created an upthrust and retraced back, indicating potential for a downward move. We're flipping our position to capitalize on this reversal.
*Short Sale Levels:*
- *Short Sale 1:* PKR 5.7 (current level)
- *Short Sale 2:* PKR 5.9
- *Short Sale 3:* PKR 6.3
*Target Prices:*
- *TP1:* PKR 5.15
- *TP2:* PKR 4.15
*Stop Loss:* Above PKR 6.70
*Risk-Reward Ratio:* 2

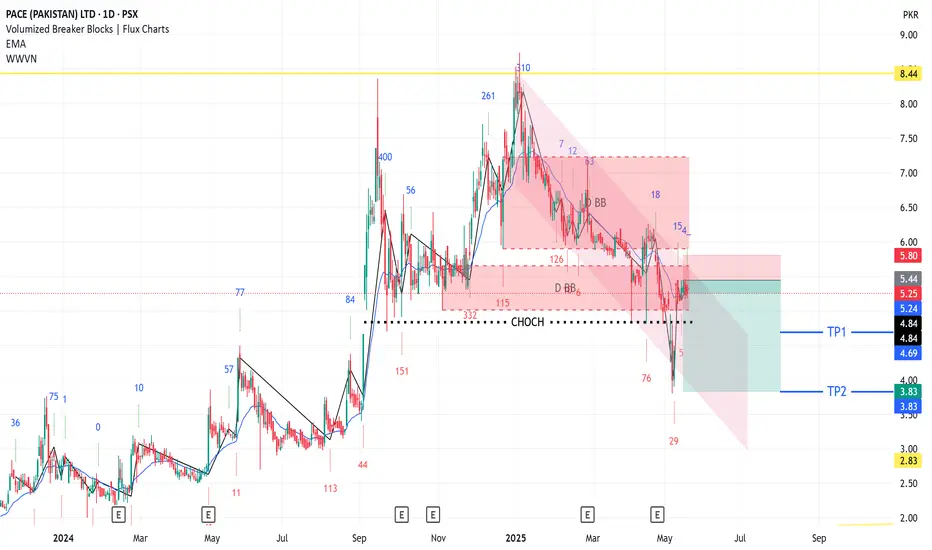
PACE SHORTSELL TRADEPACE been in DOWNTREND since JAN 2025.
Recent up leg has been mostly due to across the board Bullish Sentiments because of improvement in Geo Political Environment.
Current Up Move is also just a healthy Pullback in overall Downtrend.
There's strong Bearish Breaker Block overhead current levels which will obstruct any upward movement.
🚨 TECHNICAL SHORT SELL CALL –PACE 🚨
🎯 SHORTSELL ZONE : 5.2-5.6
📈 TP1 : Rs. 4.7
📈 TP2 : Rs. 3.9
🛑 STOP LOSS: Above Rs. 6 (Daily Close)
📊 RISK-REWARD: High Conviction | 1:4.5
Caution:
Please close at least 50% position size at TP1 and then follow strict trailing SL to avoid losing incurred profits in case of unforeseen market conditions
PLEASE BOOST THE IDEA IF YOU FIND IT HELPFUL.
Pace is in ideal buying zonePace is near to 4.88 a strong support level. it is ideal zone for buy it. Currently at 5.02 level and it could reach its strong resistance level of 5.62 and 6.36 level.
Note: This is not a buy/sell trade call. trade at your own will and analysis.

Pace =Buy with a stop loss 5.85 TP01=6.9 and 8.35...longterm 13.Pace =Buy with a stop loss 5.85 TP01=6.9 and 8.35...longterm 13.

Pace Range of Buying and SellingPace range of buying and selling is
Buy at 5
Sell at 6
SL should be apply as per your risk taking methodology
Note: This is not a buy\sell call.

PACE | Bullish Continuation ExpectedThe stock is presently trading above its 200-day Exponential Moving Average (EMA), adhering to a parallel channel that signifies a bullish trend. On the daily timeframe, there is a clear formation of Higher Highs (HHs) and Higher Lows (HLs). The price has recently experienced a pullback from the support level of the parallel channel, currently hovering above this support. A retracement toward the initial resistance level of 4.45 is anticipated.
Should trading volume increase and the price break above and sustain above this resistance level, it is plausible that the price could test the upper boundary of the parallel channel, approximately 5.50. However, this bullish outlook would be invalidated if the channel breaks downward. To manage risk effectively, it is advisable to set a stop-loss order at 2.50.

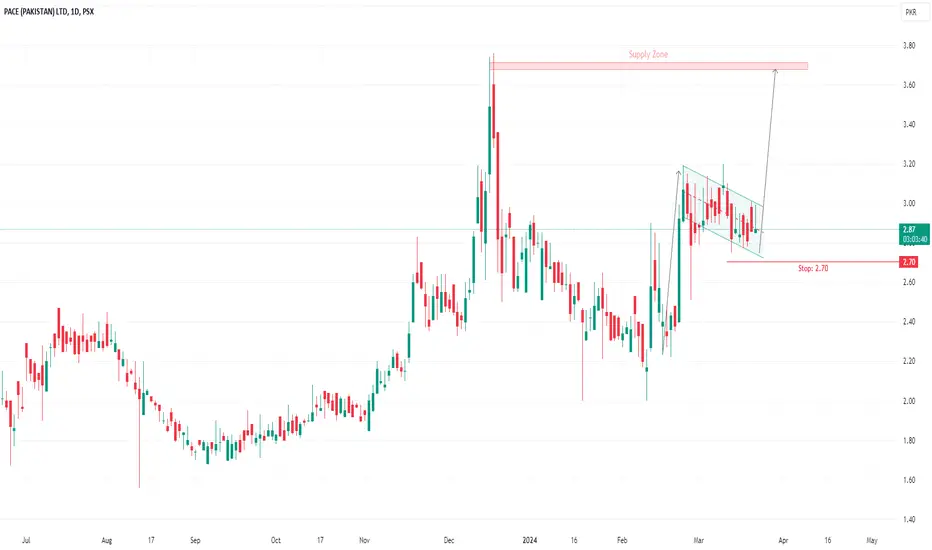
PACE | Flag Pattern Need Confirmation🚀 Stock Alert: *PACE*
📈 Investment View: Technically Bullish 📈
🔍 Quick Info:
📈 Buy Stop: 3.05
🎯 Target Level : 3.65
⚠ Stop Loss: 2.70
⏳ Nature of Trade: Short Term
📉 Risk Level: Medium
☪ Shariah Compliant: NO
💰 Dividend Paying: NO
📰 Technical View: PACE's flag pattern breakout at 3.05 presents a compelling opportunity, with a target at 3.65 and a stop loss at 2.70 providing a structured risk-reward profile. Traders should remain vigilant and adapt their strategies as needed to capitalize on potential market movements.