PUMP/USDTCurrent Market Structure
Strong pump occurred around July 13th, peaking above 0.0072.
Price retraced and is now ranging between 0.00580 – 0.00640.
Appears to be forming a consolidation or flag pattern, which can break either way.
Volume is declining, indicating potential for breakout buildup.

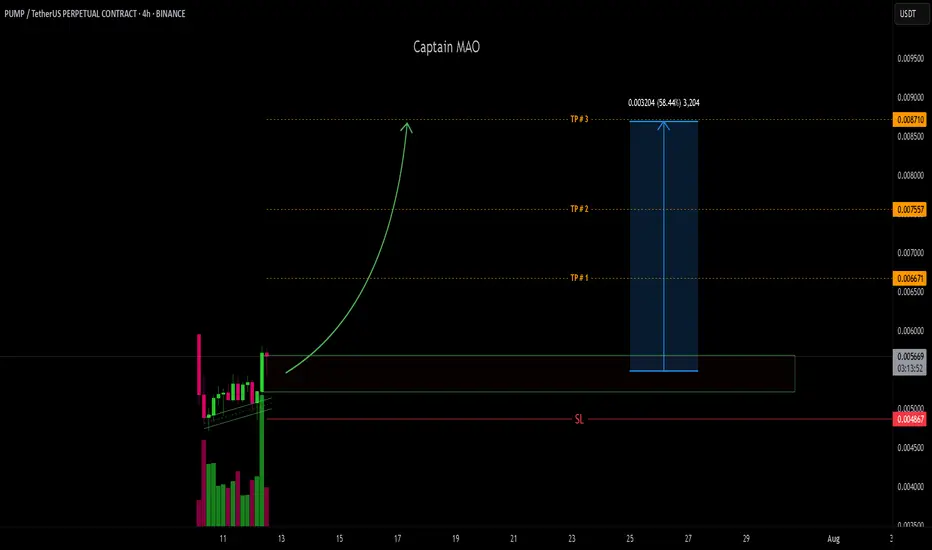
#PUMP is trying to break out of the falling channel! #PUMP Our previous trade setup, SL, got hit.
Currently, it is trying to break out of the falling channel on the 1H chart.
If it holds above the breakout zone, it could push toward $0.0082 📈
Entry: 0.0060 – 0.0063
Stop Loss: 0.00578
Targets:
TP1: 0.0068
TP2: 0.0074
TP3: 0.00795
TP4: 0.00823
Class

Where Should We Rebuy The PUMP? (8H)With the large bearish master candle formed at the top, the structure has turned bearish.
The green zone is the best and lowest-risk area for long positions or rebuys.
Reaching this zone may take some time, but you can already add this symbol to your watchlist and wait for it to reach the area befo

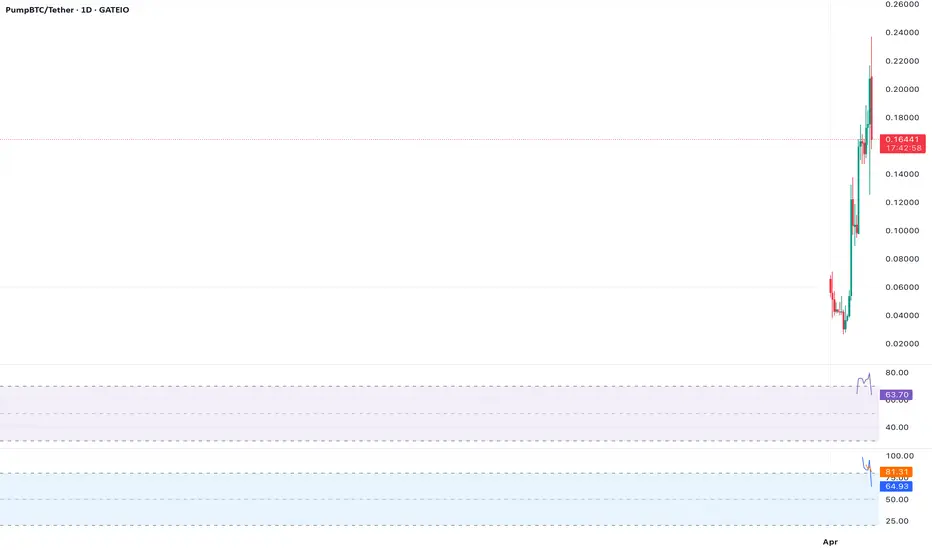
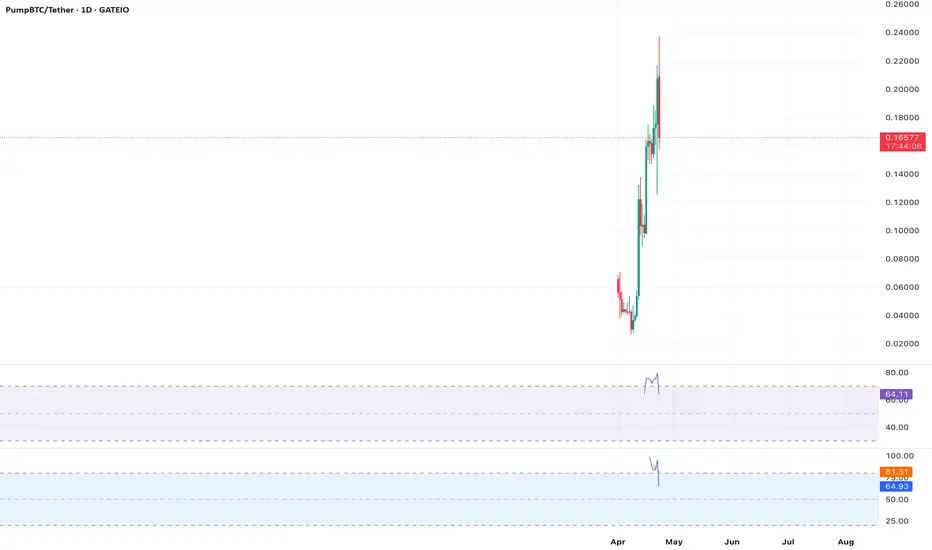
$PUMP’s Support Holds at $0.15 – Reversal Signal?Analysis: NYSE:PUMP at $0.167 is holding above the $0.15 support, with a bullish hammer on the 4-hour chart. Resistance at $0.17 remains a hurdle. RSI is neutral at 55. Recommendation: Buy dips to $0.15; target $0.18, stop below $0.145.

$PUMP’s Fibonacci Retracement Targets $0.20Analysis: NYSE:PUMP at $0.167 is approaching the 61.8% Fibonacci level ($0.17) from its recent low of $0.09. A break could target the 100% level at $0.20. Support at $0.14 is key. Recommendation: Buy above $0.17; sell partials at $0.20.
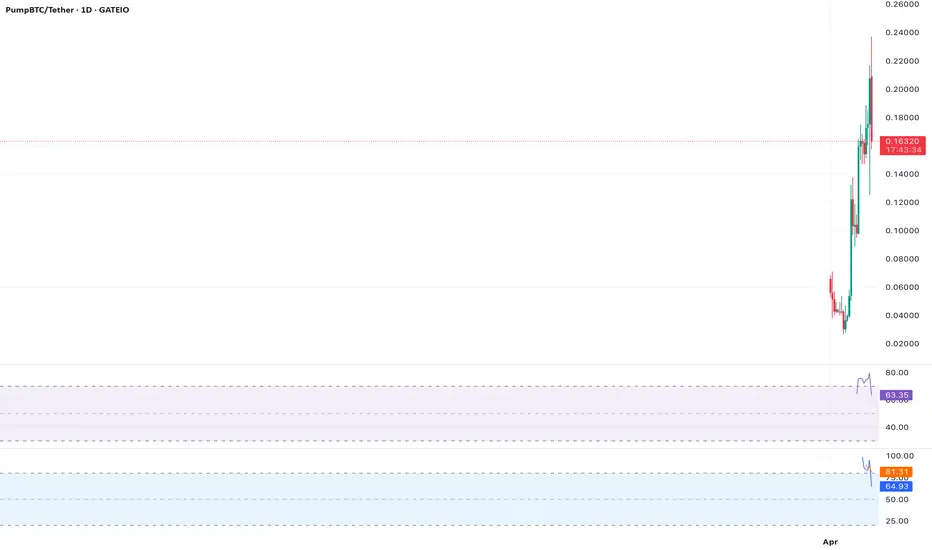
$PUMP’s Stochastic at 60 – Room for Growth?Analysis: At $0.167, NYSE:PUMP ’s Stochastic Oscillator is at 60 on the daily chart, suggesting room for upside before overbought levels. Resistance at $0.17 is critical; support at $0.15 holds. Recommendation: Long on a break above $0.17; stop below $0.15.

$PUMP’s Volume Spikes at $0.167 – Breakout Imminent?Analysis: NYSE:PUMP ’s 24-hour volume has spiked, supporting its price at $0.167. The price is above the 50-day MA ($0.14), with $0.17 as resistance. A breakout needs sustained volume. Recommendation: Buy above $0.17; watch for volume contraction.
$PUMP Faces $0.17 Resistance – Rejection Risk HighAnalysis: NYSE:PUMP at $0.167 is struggling to break $0.17 resistance, with declining volume on the 1-hour chart. The 50-period EMA at $0.155 is support. A rejection could test $0.15. Recommendation: Short below $0.165; target $0.15, stop at $0.172.
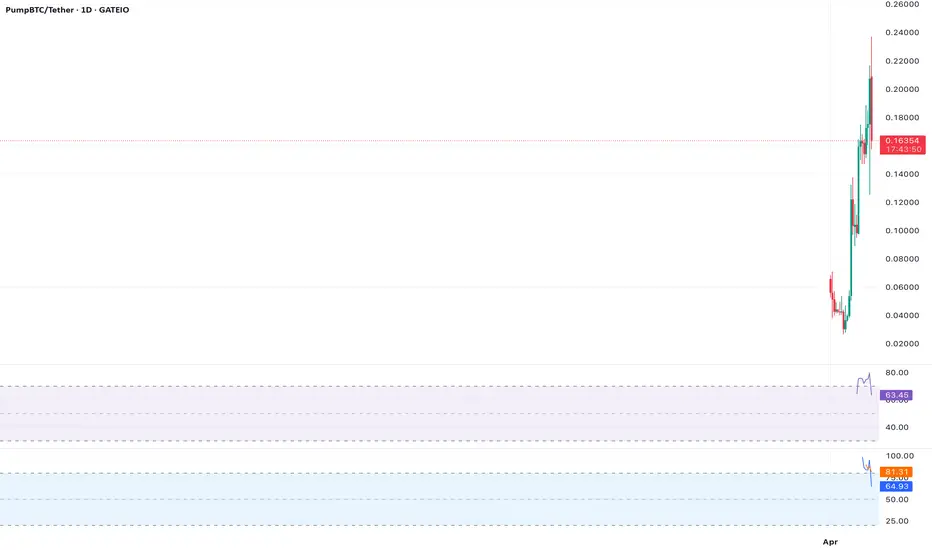
$PUMP’s MACD Bullish at $0.167 – Upside to $0.20?Analysis: The MACD on the 4-hour chart shows bullish momentum for NYSE:PUMP at $0.167, with the histogram expanding. Resistance at $0.17 is key; a break could target $0.20. Volume needs to confirm. Recommendation: Long above $0.17; stop below $0.16.
See all ideas