PUMPUSDT at a Decisive Turning Point – Breakout or Breakdown?
🧠 Technical Overview:
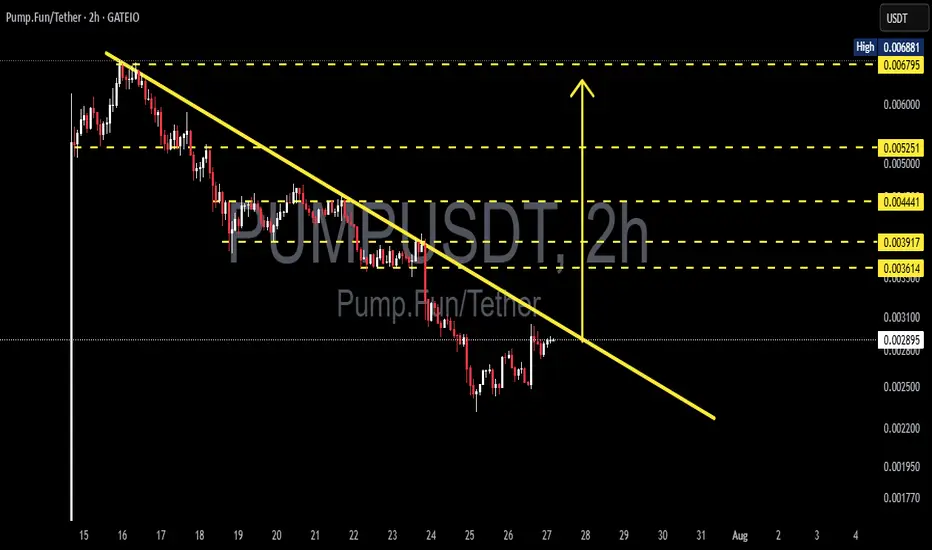
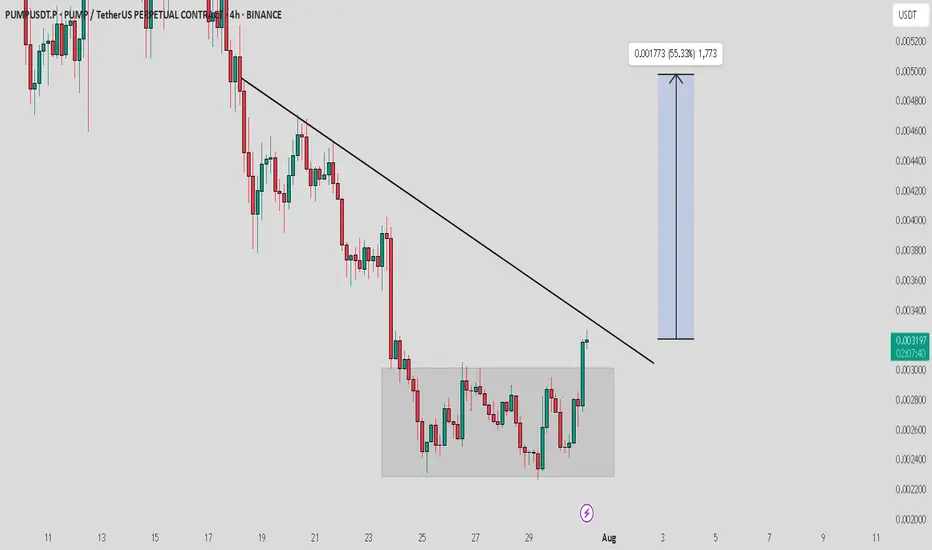
PUMPUSDT has been in a sustained downtrend over the past several days, forming a clearly defined descending trendline that has acted as a dynamic resistance since mid-July. Now, the price is approaching this key level once again—and this time, momentum seems to be shifting.
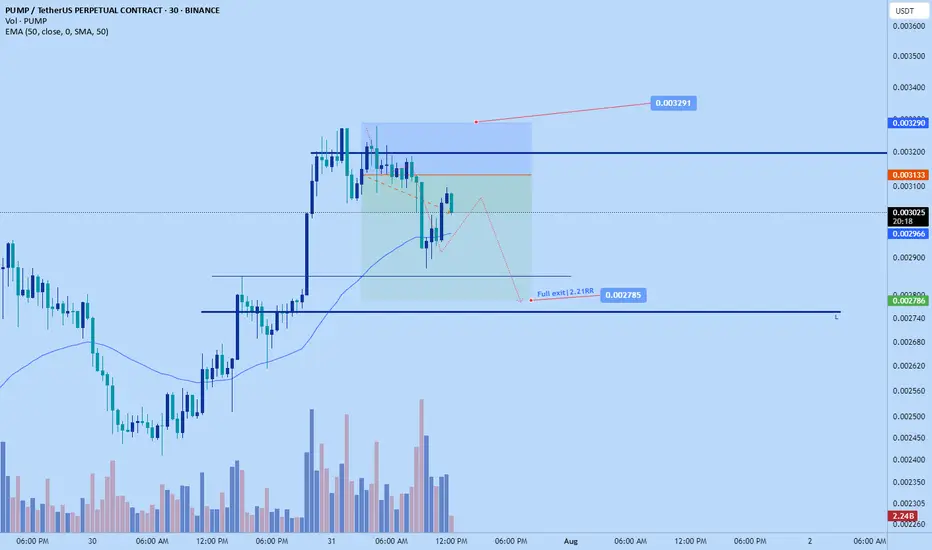
Pumpdotfun short to $0.002785Thought I shared this earlier. Shorted pumpdotfun . Aiming for $0.002785
It pumped up a bit...no pun intended but structrally its relatively high and likely to correct down again before continuation up.
DTT strategy applied, learn more about it on my x profile.
Sl: $0.003291....if want to hop on
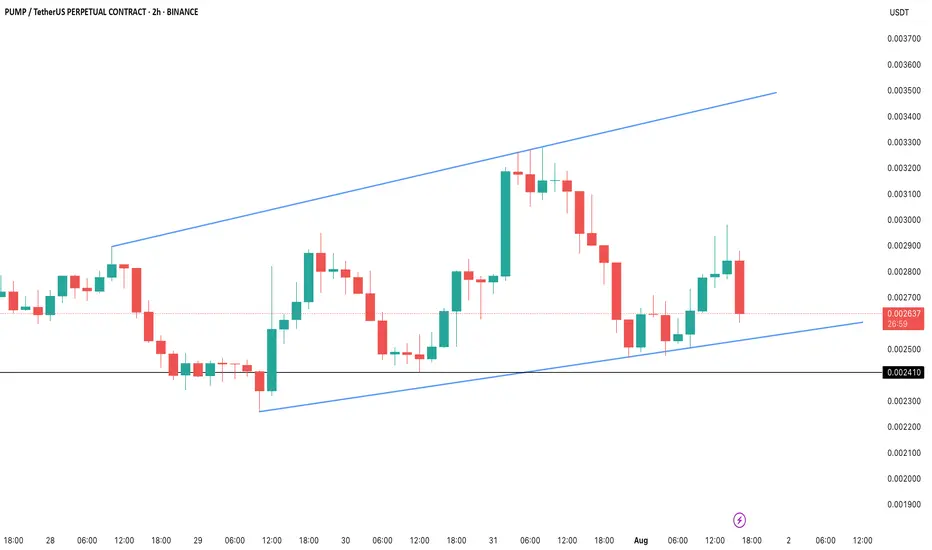
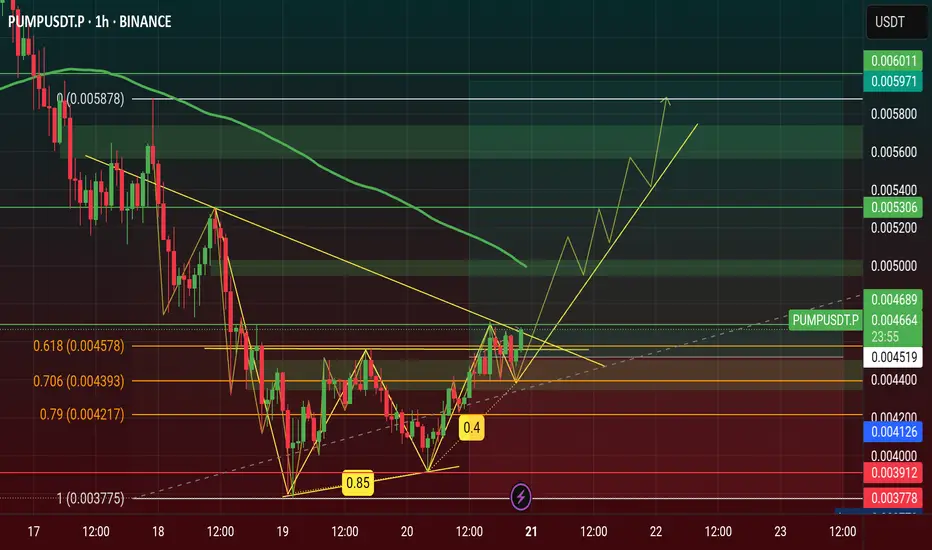
PUMP/USDT: Whales Buy the Dip as Price Holds Key LevelBINANCE:PUMPUSDT.P price has taken a steep 18% hit in the last 24 hours, but the 2-hour chart shows BINANCE:PUMPUSDT.P price action clinging to a critical Fibonacci support near $0.00259. The token is still trading inside an ascending channel, hinting that the bullish structure hasn’t fully broke
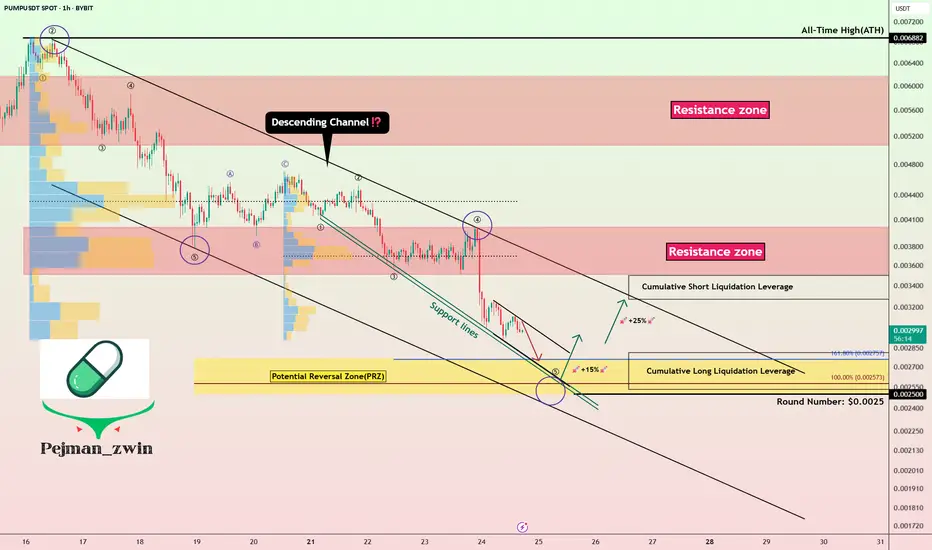
From Hype to Hesitation: What’s Next for Pump Fun ($PUMP)?Today, I want to break down the recent developments and fundamentals of Pump fun ( BYBIT:PUMPUSDT ) and its token PUMP — a project that initially launched with strong hype but is now facing serious investor concerns .
What is Pump fun?
Pump fun is a memecoin launchpad that allows users to
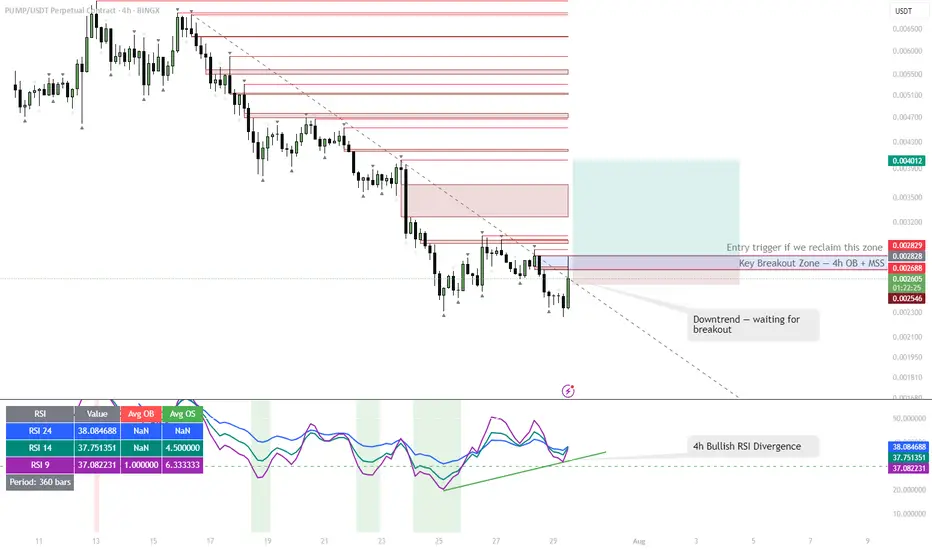
PUMP | #4h #long — Watching for Breakout Confirmation Early signals for a reversal, but not rushing in.
Some clear bullish divergence on the 4h RSI — first positive sign after an extended downtrend. Price can pop from here, but my plan is to wait for a break and hold above the 4h Order Block + MSS zone (red box) before taking any long entry.
Confirma
$PUMP Price Will Hit $0.006 this July 2025 see on Chart...🚀 NYSE:PUMP Price Will Hit $0.006 this July 2025, NYSE:PUMP is Showing a Double Bottom Pattern Looking on Chart now.
Double Bottom Pattern is a Reversal Pattern and It's will Manipulation Price of Pump. I'm Find a Three White Shoulders Candle in bottom price area on 4h Chart & It is a Bullish
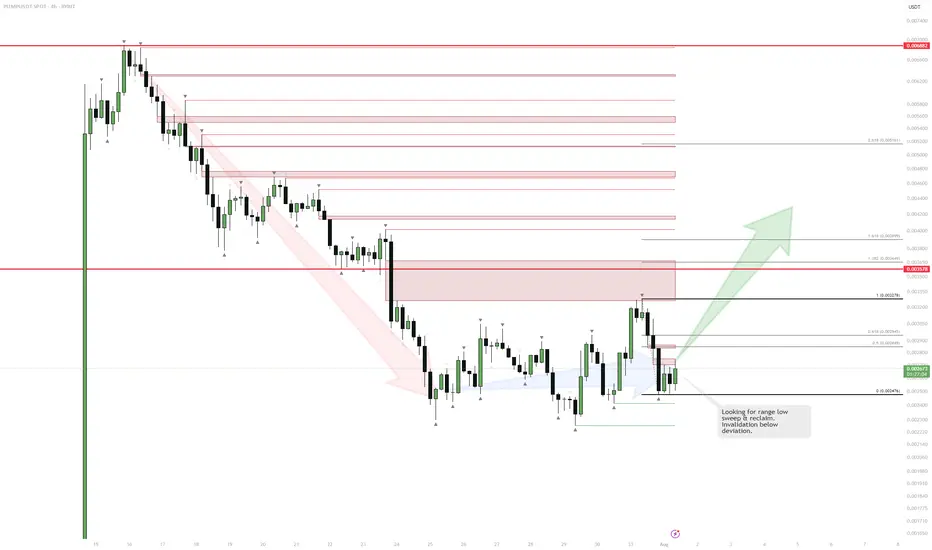
PUMP | Watching for Base ConfirmationThe sharp downtrend is showing signs of exhaustion as price starts to consolidate and build a potential range.
If we see a sweep and reclaim of the range low, that would confirm the start of a new accumulation phase and signal a potential reversal.
The invalidation for any long attempt is a confir
PUMP / USDT : Looking Bullish PUMP/USDT Analysis:
PUMP/USDT shows strong bullish potential after breaking out of consolidation. A retest to the box area is likely before a breakout from the trendline resistance. Once the trendline is broken, expect a major rally with a 40-50% potential upside.
Key Levels:
Support: Consolidati
PUMPIMHO once we cross the level above EMA 200 there is launching area to this two zones. Be accurate this thing very active. NFA - DYOR


See all ideas
Summarizing what the indicators are suggesting.
Oscillators
Neutral
SellBuy
Strong sellStrong buy
Strong sellSellNeutralBuyStrong buy
Oscillators
Neutral
SellBuy
Strong sellStrong buy
Strong sellSellNeutralBuyStrong buy
Summary
Neutral
SellBuy
Strong sellStrong buy
Strong sellSellNeutralBuyStrong buy
Summary
Neutral
SellBuy
Strong sellStrong buy
Strong sellSellNeutralBuyStrong buy
Summary
Neutral
SellBuy
Strong sellStrong buy
Strong sellSellNeutralBuyStrong buy
Moving Averages
Neutral
SellBuy
Strong sellStrong buy
Strong sellSellNeutralBuyStrong buy
Moving Averages
Neutral
SellBuy
Strong sellStrong buy
Strong sellSellNeutralBuyStrong buy