PUMPUSDT at a Decisive Turning Point – Breakout or Breakdown?
🧠 Technical Overview:
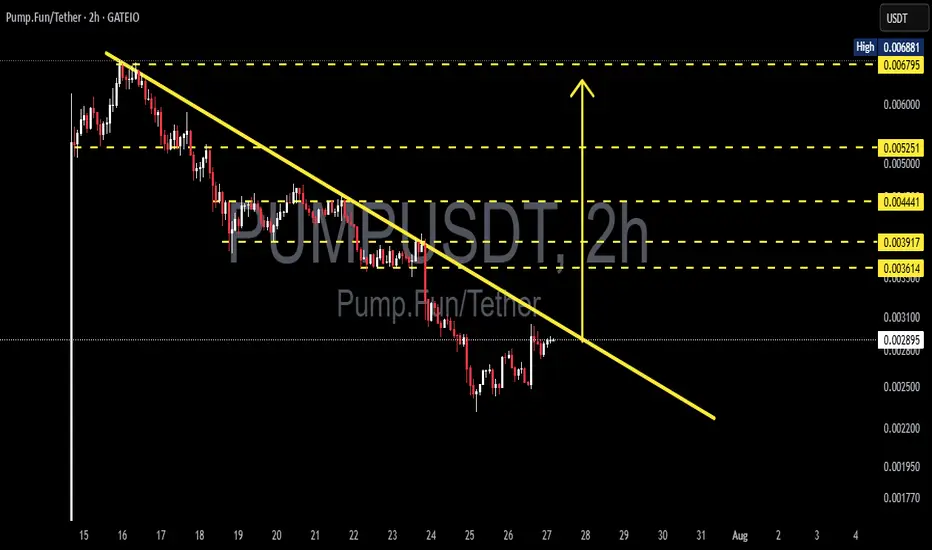
PUMPUSDT has been in a sustained downtrend over the past several days, forming a clearly defined descending trendline that has acted as a dynamic resistance since mid-July. Now, the price is approaching this key level once again—and this time, momentum seems to be shifting.
Interestingly, the current structure is forming what appears to be a potential Inverse Head and Shoulders (IH&S) pattern, a well-known bullish reversal formation. If confirmed with a breakout above the neckline/trendline, this could spark a strong upward reversal.
---
📌 Key Technical Highlights:
Descending Resistance Line: Holding since July 15, acting as the primary ceiling on price action.
Inverse Head and Shoulders Pattern: Potential bullish reversal setup forming on the 2H chart.
Volume: Currently low but showing signs of increase near the potential breakout zone—a bullish early signal.
---
📈 Bullish Scenario (Breakout Confirmation):
If the price successfully breaks and closes above the yellow trendline, especially with a strong candle and volume confirmation, we could see a momentum-driven rally toward the following targets:
1. ✅ $0.003614 – Minor resistance zone
2. ✅ $0.003917 – Retest of previous consolidation structure
3. ✅ $0.004441 – Measured move target from IH&S pattern
4. ✅ $0.005251 – 0.618 Fibonacci retracement area
5. ✅ $0.006795 – Major swing high and liquidity zone
> Potential upside of 100%+ from current levels if momentum continues.
---
📉 Bearish Scenario (Trendline Rejection):
If the price fails to break above the trendline and faces another strong rejection, then sellers could regain control, leading to:
⛔ $0.002500 – Psychological support and consolidation base
⛔ $0.001950 – Local bottom and potential long-term entry zone
> A failed breakout could trigger a quick sell-off or stop-loss cascade below the IH&S setup.
---
🔍 Technical Summary:
Indicator Status
Descending Trendline Actively being tested
Volume Increasing near breakout zone
RSI Rising from oversold territory
Price Pattern Inverse Head & Shoulders (Potential Reversal)
Risk/Reward High, favoring breakout strategy
---
🧭 Strategy Suggestions:
Aggressive Entry: Enter on breakout candle close above trendline with volume confirmation.
Conservative Entry: Wait for breakout + successful retest of the trendline before entering.
Stop Loss: Below neckline or recent swing low (~$0.0025).
Take-Profit Zones: $0.0039, $0.0044, $0.0052 and beyond.
---
🧠 Final Thoughts:
> “Charts never lie—PUMPUSDT is building pressure beneath a key resistance. If it breaks, the move could be explosive. Are you ready to ride the wave?”
Microcap altcoins often fly under the radar—until they don’t. This setup is showing the classic signs of a potential breakout. Use sound risk management and watch the next candle closely.
#PUMPUSDT #CryptoBreakout #InverseHeadAndShoulders #TechnicalAnalysis #AltcoinSetup #PumpFun #BreakoutAlert #MicrocapGems #CryptoReversal #ChartPatterns #CryptoSignal #CryptoStrategy
PUMPUSDT trade ideas
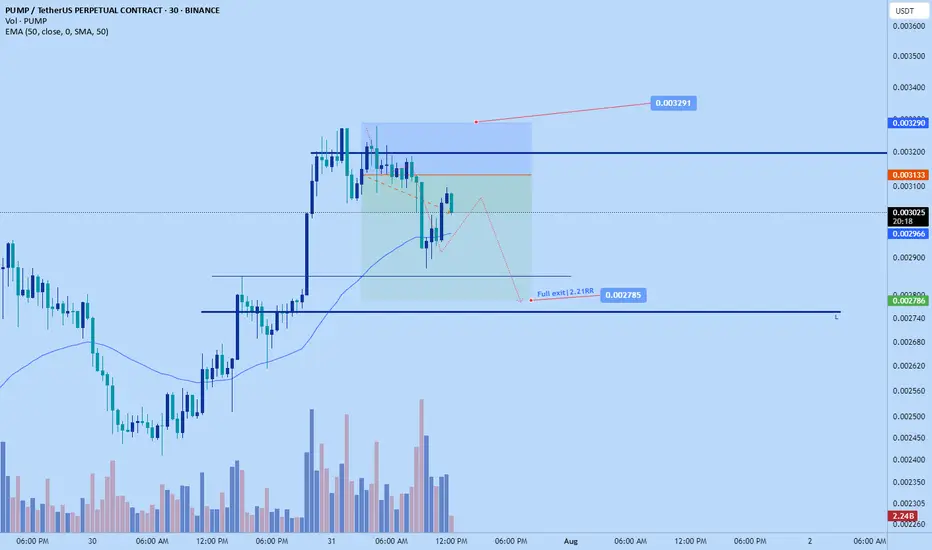
Pumpdotfun short to $0.002785Thought I shared this earlier. Shorted pumpdotfun . Aiming for $0.002785
It pumped up a bit...no pun intended but structrally its relatively high and likely to correct down again before continuation up.
DTT strategy applied, learn more about it on my x profile.
Sl: $0.003291....if want to hop on now can use 0.032 sl, a bit tigher to give roughly 1-2 RR and still provide good invalidation.
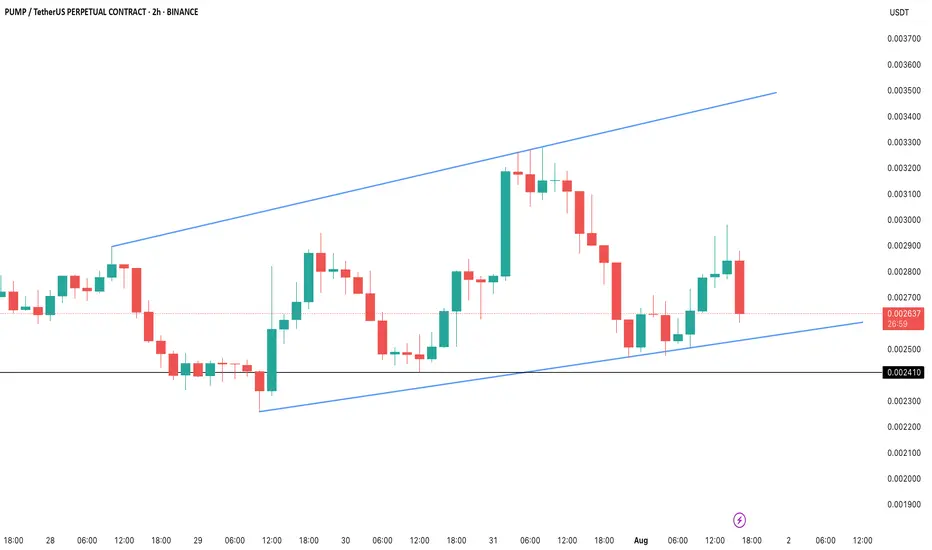
PUMP/USDT: Whales Buy the Dip as Price Holds Key LevelBINANCE:PUMPUSDT.P price has taken a steep 18% hit in the last 24 hours, but the 2-hour chart shows BINANCE:PUMPUSDT.P price action clinging to a critical Fibonacci support near $0.00259. The token is still trading inside an ascending channel, hinting that the bullish structure hasn’t fully broken yet.
Whales have been scooping up the dip aggressively, adding 5.4 billion PUMP tokens over the past week (a 35.8% jump in their holdings). Despite retail selling pushing netflows positive intraday, big wallets continue to absorb supply. Daily accumulation is also up 3.2% in the last 24 hours, reinforcing the demand floor near current levels.
Meanwhile, long positions dominate the liquidation setup, with $7.88 billion in longs versus just $3.6 billion in shorts. If BINANCE:PUMPUSDT.P price bounces, a cascade of short liquidations could amplify the recovery rally. But failure to defend $0.00259 risks opening the door to $0.00241, putting bulls on the back foot.
For now, the $0.00259–$0.00260 zone is the make-or-break level. Holding above keeps BINANCE:PUMPUSDT.P price inside the bullish channel, setting up a potential retest of $0.00284–$0.00294. A breakdown, however, could flip sentiment sharply bearish.
From Hype to Hesitation: What’s Next for Pump Fun ($PUMP)?Today, I want to break down the recent developments and fundamentals of Pump fun ( BYBIT:PUMPUSDT ) and its token PUMP — a project that initially launched with strong hype but is now facing serious investor concerns .
What is Pump fun?
Pump fun is a memecoin launchpad that allows users to launch and trade memecoins in a gamified, simplified environment. The idea was to create a frictionless way for anyone to generate and speculate on meme tokens, leveraging viral growth and community culture.
Its native token, PUMP , was introduced via an ICO priced at $0.004, with 12.5% of the total 1 trillion supply offered during the sale.
Latest Updates – Past 24 Hours Recap
PUMP Crashes Over 50% After ICO :
The token initially spiked to $0.0068 on launch day (July 16) , but has now dropped over 50%.
This is roughly 14% below its ICO price , creating concerns for short-term investors.
Founder Confirms No Airdrop Anytime Soon:
In a livestream with ThreadGuy , project founder Alon Cohen confirmed:
“ The airdrop is not going to be taking place in the immediate future. ”
While the team still plans to deliver an airdrop, Alon emphasized it must be well-executed and meaningful, not rushed for hype.
The current focus is on long-term growth and ecosystem sustainability, not short-term incentives.
Mixed Investor Sentiment:
High-profile trader Machi Big Brother ( Jeffrey Huang ) reportedly increased his long position in PUMP — even though he’s down over $5.8M on his position.
Meanwhile, two wallets linked to private sale investors dumped over 1.2B PUMP at $0.003 , taking a combined loss of $1.19M.
Declining Volume and Market Cap:
Trading volume has dropped significantly.
PUMP has lost over 40% of its value in the past 7 days.
Short-term holders appear uncertain, while the project team asks for patience and long-term vision.
Fundamental Outlook:
Pump fun’s future now heavily depends on:
The real utility of the platform as a meme coin incubator.
The team’s ability to regain trust after delaying the airdrop.
Whether new features or hype can revive volume and user engagement.
-------------------------------
Now, let's examine the PUMP token from a technical analysis perspective
From the outset, I must say that due to the small number of candlesticks that create the PUMP token, technical analysis may be a bit difficult , but we will use technical analysis tools to analyze this token.
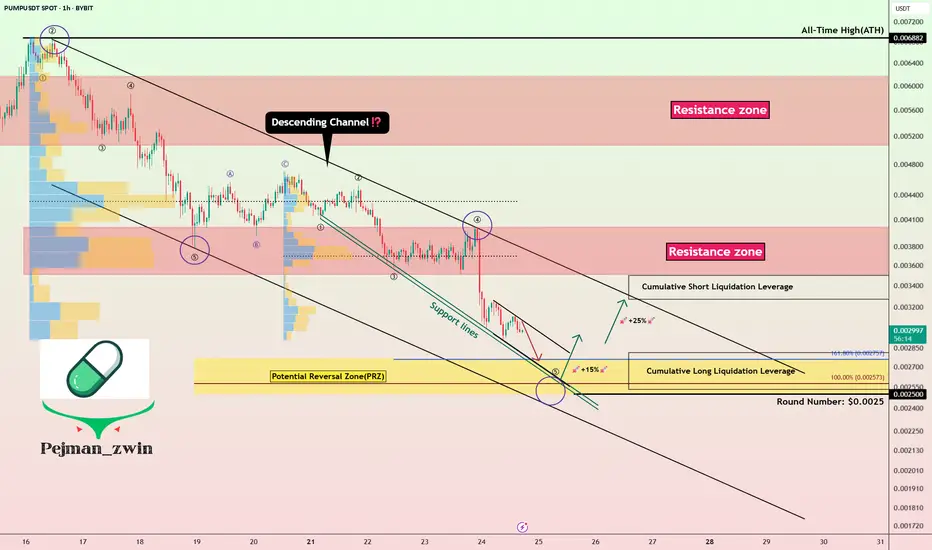
The PUMP token seems to be moving in a descending channel since the beginning of its correction (over -50%) until now, we need a second price bottom to confirm the descending channel.
I expect the PUMP token to rise from the Potential Reversal Zone(PRZ) and near the Support lines to $0.0029(+15%) . PUMP Token increase can also be from the bottom of the ascending channel .
Second target: the upper line of the ascending channel.
Cumulative Long Liquidation Leverage: $0.002810-$0.002530
Cumulative Short Liquidation Leverage: $0.003498-$0.00327
Note: Stop Loss(SL): $0.002391
Please respect each other's ideas and express them politely if you agree or disagree.
Pump fun Analyze (PUMPUSDT), 1-hour time frame.
Be sure to follow the updated ideas.
Do not forget to put a Stop loss for your positions (For every position you want to open).
Please follow your strategy and updates; this is just my Idea, and I will gladly see your ideas in this post.
Please do not forget the ✅' like '✅ button 🙏😊 & Share it with your friends; thanks, and Trade safe.
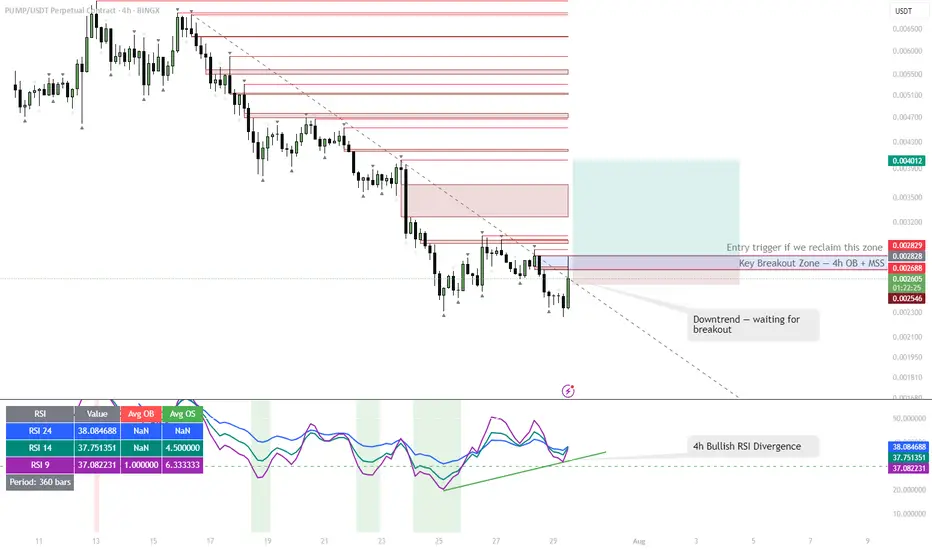
PUMP | #4h #long — Watching for Breakout Confirmation Early signals for a reversal, but not rushing in.
Some clear bullish divergence on the 4h RSI — first positive sign after an extended downtrend. Price can pop from here, but my plan is to wait for a break and hold above the 4h Order Block + MSS zone (red box) before taking any long entry.
Confirmation is key — I only want to get involved if we reclaim this area with momentum.
Scenario:
If we get a strong breakout and close above the red OB + MSS zone, that’s the first entry trigger for a potential trend reversal.
Until then — standing aside, letting the setup prove itself.
Reasoning:
Bullish RSI divergence often marks the beginning of a reversal, but without a structural breakout, the move can easily fail.
Patience pays off in these high-risk, low-liquidity coins.
$PUMP May Still Dump to .0020-.0018BYBIT:PUMPUSDT | 4h
PUMPFUN is one of the few coins still holding support during the dump.
It’s looking tempting here, but a drop to the 0.0021–0.0018 zone is still likely.
Planning to long around 0.0021–0.0018
Targets:
.0028-.0032
.0037-.0040
.0045-.0048

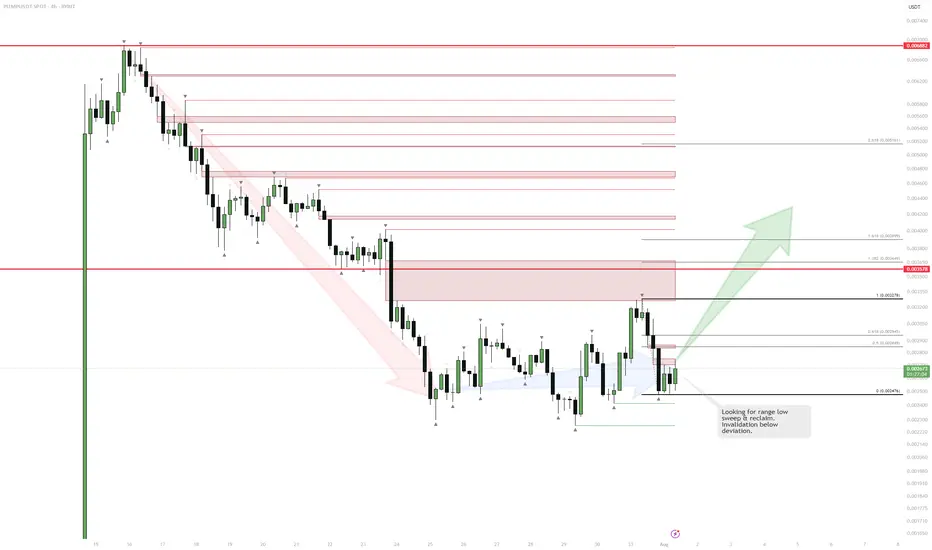
PUMP | Watching for Base ConfirmationThe sharp downtrend is showing signs of exhaustion as price starts to consolidate and build a potential range.
If we see a sweep and reclaim of the range low, that would confirm the start of a new accumulation phase and signal a potential reversal.
The invalidation for any long attempt is a confirmed breakdown below the deviation or the origin of the reclaim.
Plan:
Wait for a clean sweep and reclaim of the range low to trigger a long entry.
Target resistance levels above, with stops set below the reclaim origin.
$PUMP Price Will Hit $0.006 this July 2025 see on Chart...🚀 NYSE:PUMP Price Will Hit $0.006 this July 2025, NYSE:PUMP is Showing a Double Bottom Pattern Looking on Chart now.
Double Bottom Pattern is a Reversal Pattern and It's will Manipulation Price of Pump. I'm Find a Three White Shoulders Candle in bottom price area on 4h Chart & It is a Bullish Candle. Now Price Retest and If it's Breakout it will be happened this month.
#Write2Earn #TrendingPredictions #AltcoinSeasonLoading #pump #SUBROOFFICIAL
Disclaimer: This article is for informational purposes only and does not constitute financial advice. Always conduct your own research before making any investment decisions. Digital asset prices are subject to high market risk and price volatility. The value of your investment may go down or up, and you may not get back the amount invested. You are solely responsible for your investment decisions and Binance is not available for any losses you may incur. Past performance is not a reliable predictor of future performance.
PUMPIMHO once we cross the level above EMA 200 there is launching area to this two zones. Be accurate this thing very active. NFA - DYOR

PUMP / USDT : Looking Bullish PUMP/USDT Analysis:
PUMP/USDT shows strong bullish potential after breaking out of consolidation. A retest to the box area is likely before a breakout from the trendline resistance. Once the trendline is broken, expect a major rally with a 40-50% potential upside.
Key Levels:
Support: Consolidation Box
Resistance: Trendline
Wait for confirmation of the trendline breakout before entering. Always manage risk with a stop-loss and stay patient for a clear move. The setup looks promising for a solid bullish rally!

$PUMP - Jew ModeBYBIT:PUMPUSDT | 1h
It has dropped below its ICO price level $0.004, currently trading around $0.00373. The drop seems driven by airdrop anticipation and broader market cooldown.
If they stagger the airdrop, it could be a bullish move—reducing supply shock and pushing platform engagement.
Price looks to have bottomed, but still feels uncooked — we’d prefer to see a shakeout to flush early longs
Watching for a potential long around $0.0030
Bullish harmonic but with hidden rising flagThis is mine 2nd post this counter.
Pump just done a higher high and retest created a lower high.
But ytd higher high is not strong, it is in rising flag or rising wedge channel. Might have potential continuation pattern to go Down.. Currently it is still in downtrend anyway.
Still Not an A+ setup in this moment. He needs more times to prove himself.

Pumpdotfun long back to $0.0067+pumpdotfun Long
Sl: $0.004356
Tp1: $0.005180---50%
Tp2: $0.0056---25%
Exit: $0.0067
DT strategy applied.
Time sensitive

PUMP Trend Reversal – Testing 1H Supply FlipStep-by-step Price Scenario:
Price has broken the local downtrend and reclaimed the 1H supply zone, showing LTF strength.
Look for acceptance above 0.00445–0.00452 green zone for confirmation of the reversal.
If price holds above this zone, expect a move toward the next supply levels at 0.0048, then 0.0050, and 0.0054.
If price loses the green zone (close below 0.00436), scenario is invalidated—look for a retest of the previous lows near 0.00394.
Reasoning:
After a strong local downtrend, price has started to show reversal signs with a clear break and reclaim of the 1H supply zone. This area previously acted as resistance and now flipped to support, signaling the potential for a short-term rally. If buyers manage to hold above this new support, it would confirm the strength of the reversal and open up the path to test the next local supply zones above. However, failure to hold the reclaimed level (close below 0.00436) would invalidate this scenario and suggest the downtrend may continue. This setup is based on a classical supply/demand flip and early signs of bullish momentum on lower timeframes.

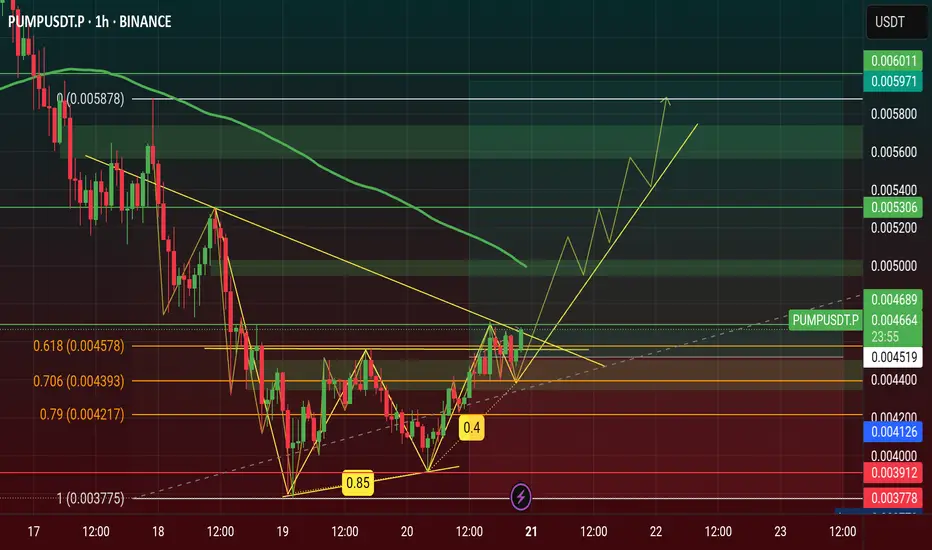
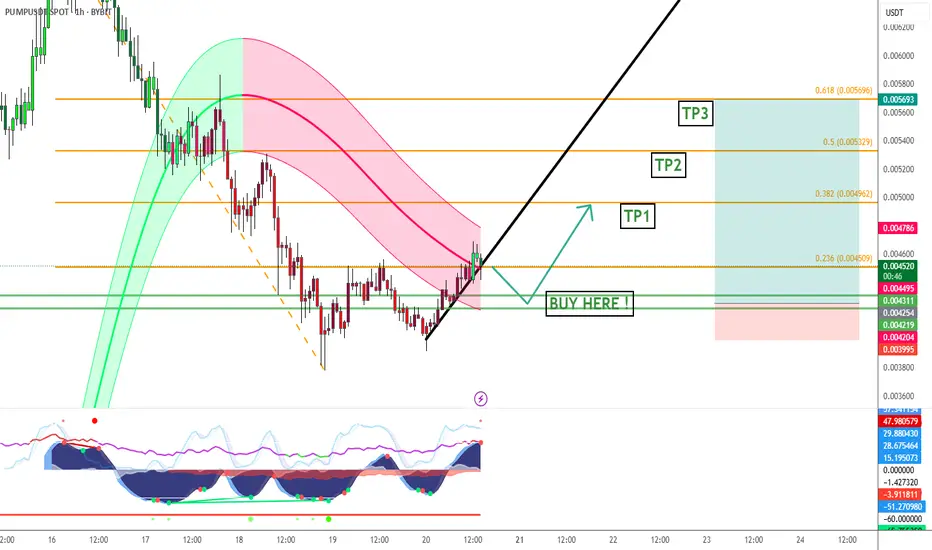
Pump token. Long after correction!📈 PUMP/USDT – Long Setup on Structural Support | Fib & Gaussian Confluence
PUMP is currently experiencing a short-term rejection from local resistance, and has broken below the rising black trendline, now retesting it from the underside — a common bearish retest. Additionally, a short signal (red dot) has appeared on my MC indicator, confirming near-term selling pressure.
However, I see this as an opportunity to prepare for a high-probability long entry.
📍 Entry Zone: $0.0042 – $0.0043
This area aligns with:
Local structural support
The 0.618 Fibonacci retracement of the recent bullish impulse
The lower band of the Gaussian channel
📊 Take Profit Levels:
TP1: $0.00496 (0.382 Fibo)
TP2: $0.00532 (0.5 Fibo)
TP3: $0.00569 (0.618 Fibo)
🎯 This setup offers a strong confluence of technical signals and risk-reward structure for a potential continuation move upward. I’m monitoring closely for bullish confirmation within the buy zone before entering.
🧠 Not financial advice. Trade safe & good luck!
The Pump coin is now showing an upward trend | Live AnalysisPump ▶️
The Pump coin has now touched its All Time Low.🕯
The coin is now showing an upward trend.👀
🛫 a Descending Triangle is currently forming a breakout on the 1H chart.
🛫 Making a Ranging Channel on the 4 H Char
🛫 Make A CHoCH (1H)
🛫 Bullish OB (1H)
🛫 Buy Tag (1 H)
🛫 Making Golden Cross (1 H

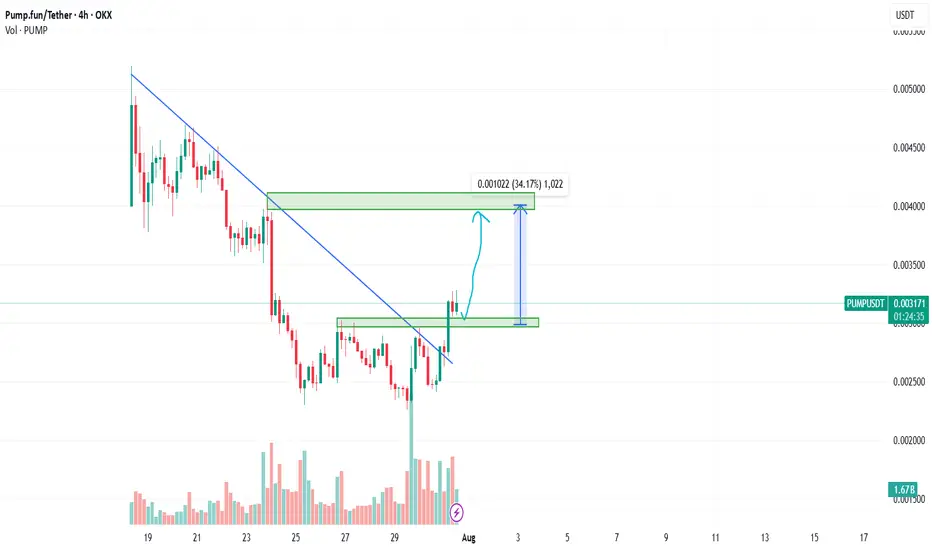
PUMPUSDT: Bullish Breakout and Retest - A Potential 34% Upside?Hello, traders!
Today we're looking at the PUMP/USDT pair on the 4-hour timeframe, and a very clean technical setup is unfolding that points towards potential bullish continuation. Let's break down the key elements of this analysis.
The Analysis
The chart presents a classic breakout and retest scenario, which is often a strong indicator of a trend reversal or continuation.
Descending Trendline Breakout: The most significant feature is the decisive breakout from a major descending trendline that had been capping the price for a considerable period. Breaking this trendline is a primary signal that the previous bearish momentum is weakening and buyers are starting to take control.
Break of Horizontal Resistance (S/R Flip): Following the trendline break, the price also successfully pushed through a key horizontal resistance zone, identified on the chart between approximately $0.002966 and $0.003044. This level has now, as expected, turned into a new support base.
The Retest: We are currently witnessing a pullback to this newly established support zone. This "retest" is a critical phase. A strong bounce from this level would confirm the breakout's validity and suggest that the market has accepted this price floor, paving the way for the next leg up.
Volume Confirmation: Notice the volume bars at the bottom of the chart. There was a visible spike in volume during the initial breakout candles, which adds conviction to the move. It indicates that the breakout was backed by significant buying interest.
The Trade Idea
Based on this structure, a potential long opportunity presents itself.
Entry: A favorable entry point could be found within the current support zone ($0.002966 - $0.003044), especially upon seeing confirmation of a bounce (e.g., a bullish engulfing candle or a hammer on the 4H or 1H chart).
Target: The analysis points to a primary target at the next major resistance level, located around the $0.004000 psychological mark. As measured on the chart, this represents a potential upside of over 34%.
Invalidation: This bullish outlook would be invalidated if the price fails to hold the current support and decisively closes back below the $0.002966 level. Placing a stop-loss below this zone is a prudent risk management strategy.
Conclusion
In summary, PUMPUSDT is displaying a textbook bullish setup. The combination of a trendline breakout, an S/R flip, and a live retest offers a compelling case for potential upside. As always, manage your risk carefully and wait for your preferred confirmation signals before entering a trade.
Disclaimer: This is not financial advice. The analysis provided is for educational and informational purposes only. Trading cryptocurrencies involves a high level of risk. Please conduct your own research and risk assessment before making any investment decisions.
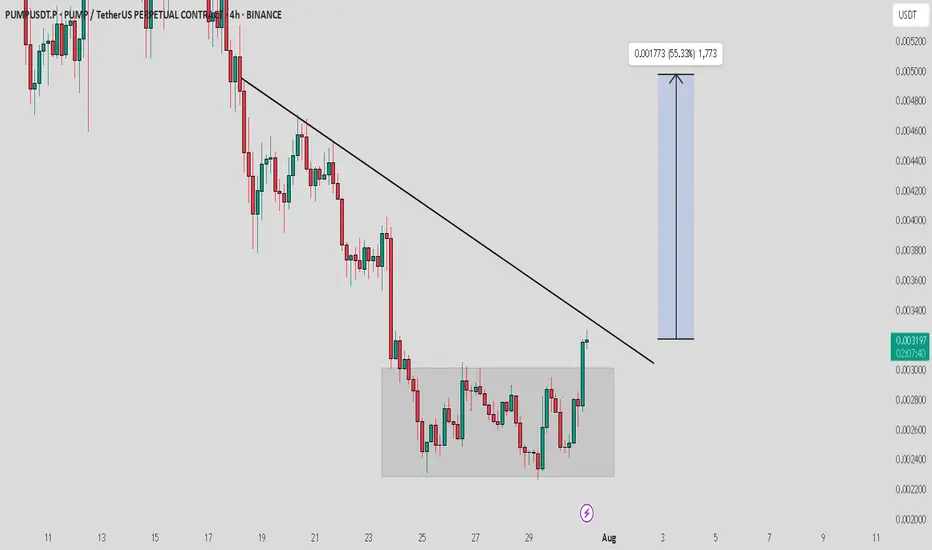
PUMP USDT LONG TRADE SETUPThe pump has been accumulating for a long time. A breakout has occurred from the recent accumulation, and there's a high chance the price will skyrocket soon .

PUMP Clears Channel Resistance and Retests Support🚀 NYSE:PUMP just broke out of a descending channel and has already pulled back for a clean retest — a classic breakout confirmation setup.
✅ The breakout structure held firm
🔄 Price bounced right off the previous resistance zone
🟩 0.0029 is acting as solid support, anchoring the move
Momentum is starting to build again, and a push above current levels could open the door for a stronger leg upward 📈
👀 Watching for follow-through here — will bulls step on the gas or stall at the next zone?
Not financial advice.

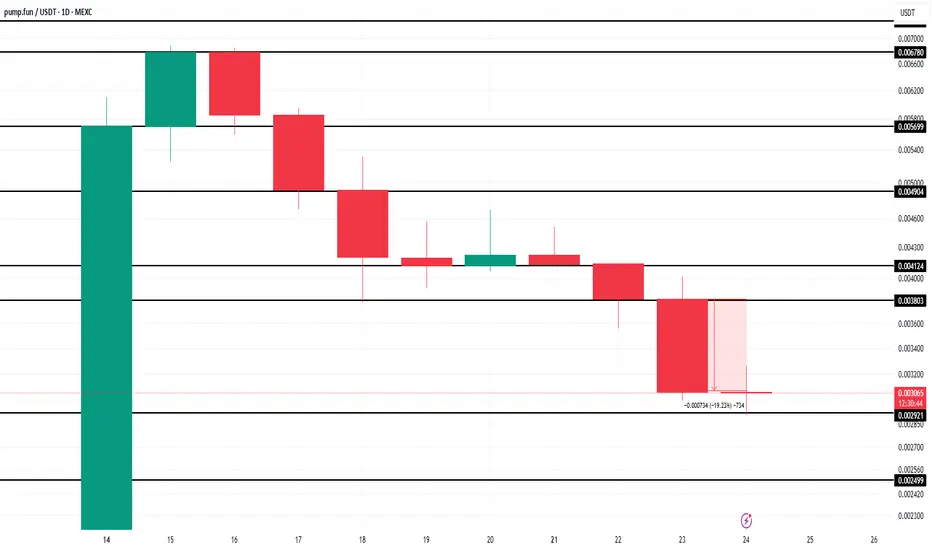
Pump.fun (PUMP) Price Crashes 20% After First Bearish CrossoverMEXC:PUMPUSDT price is currently at $0.003055, down by nearly 20% in the last 24 hours . The MACD (Moving Average Convergence Divergence) indicator, a key tool used to track price momentum, has signaled the first bearish crossover for PUMP token since its launch.
The bearish crossover occurred after a period of rising bullish momentum, signaling that the altcoin may now be facing a downturn.
The token is holding above a key support level of $0.002921 , but this support is fragile. If MEXC:PUMPUSDT fails to maintain this level, it could continue to decline, potentially dropping to $0.002499 . This would confirm the continuation of the downtrend, and the price could fall further.
On the other hand, if MEXC:PUMPUSDT manages to hold its ground at $0.002921, it could experience a bounce back. This would allow the altcoin to rise towards $0.003803, potentially invalidating the current bearish thesis and pushing the price past the resistance of $0.004124 . The next few days will be critical in determining if PUMP can recover from its recent losses.
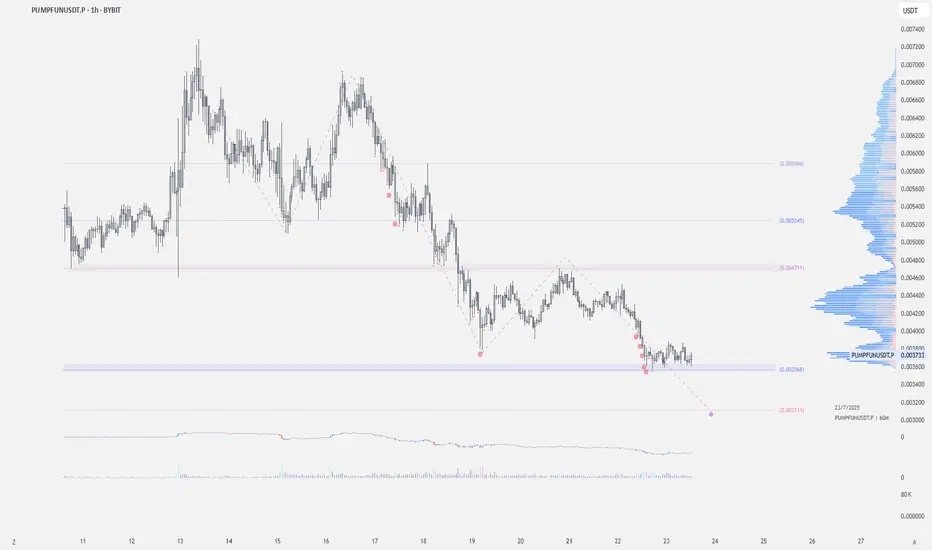
pumpusdtGiven the current conditions and the distance that the price has taken from its volume and price value, I give the possibility of using these areas and ultimately using them at the end of the major movement step that has been identified, and as long as the price does not turn, I will continue my step buying.

