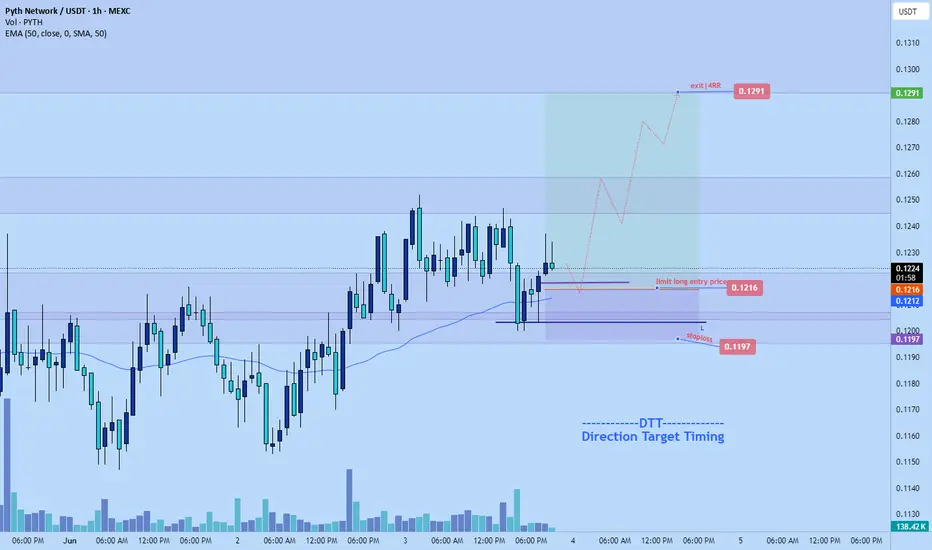
Pyth pump to $0.1290 soon!Just recently set up a limit order to long pyth to 0.1291 area
Roughly 4rr
Details on chart.
Corrective long. DTT methodology applied.
#PYTH/USDT#PYTH
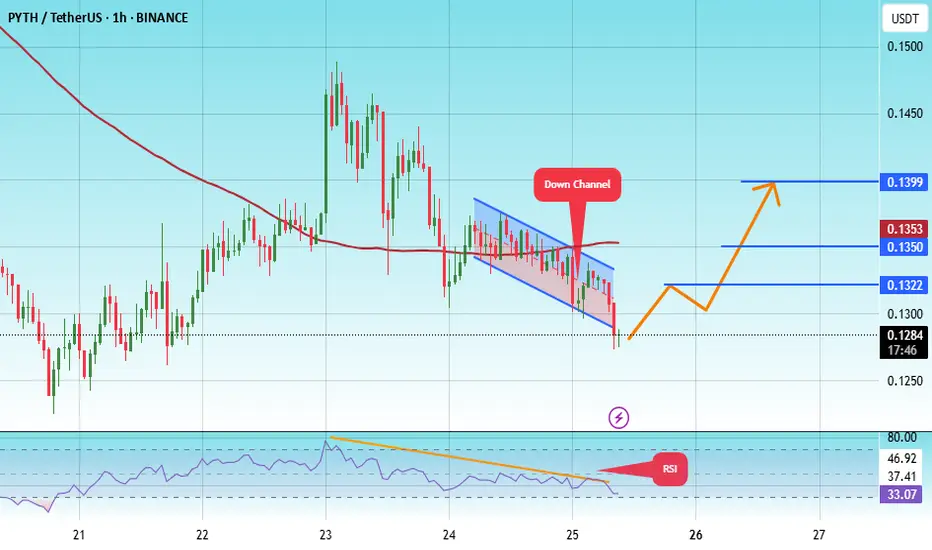
The price is moving within a descending channel on the 1-hour frame, adhering well to it, and is heading toward a strong breakout and retest.
We are experiencing a rebound from the lower boundary of the descending channel. This support is at 0.1030.
We have a downtrend on the RSI indicator t
pyth sclap long to $0.1250 todayMarket overall is pushing strongly today.
Pyth just recently flipped to bullish structure on 1hr tf and I don't think it will correct down much before continuing to pump.
Stop: $0.1180 should be enough for invalidation
0.1250 or higher. My tp is not set. I have alarms. Will make a decision to clo

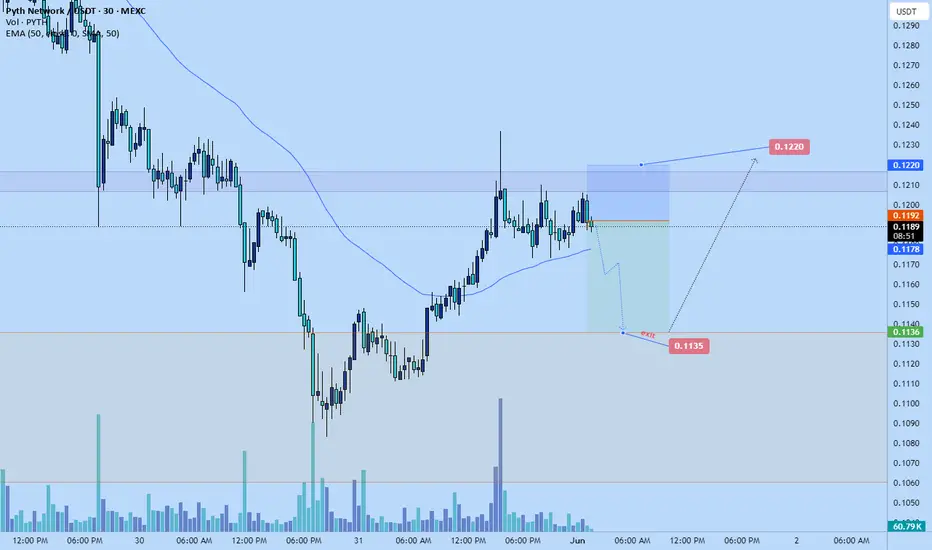
pyth short scalppyth short scalp to 0.1135
market likely to retest lower at that point before bullish continuation. Main support area.
2rr
stop:0.1220
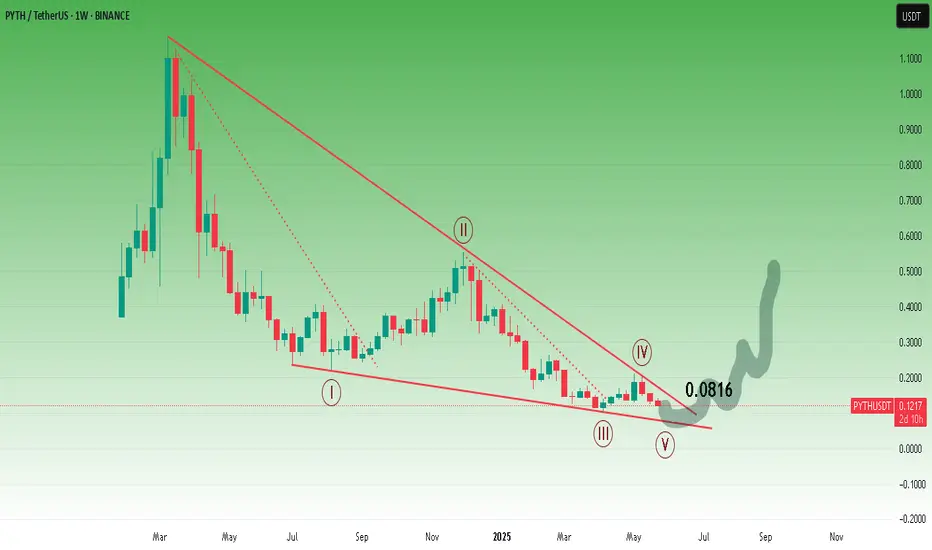
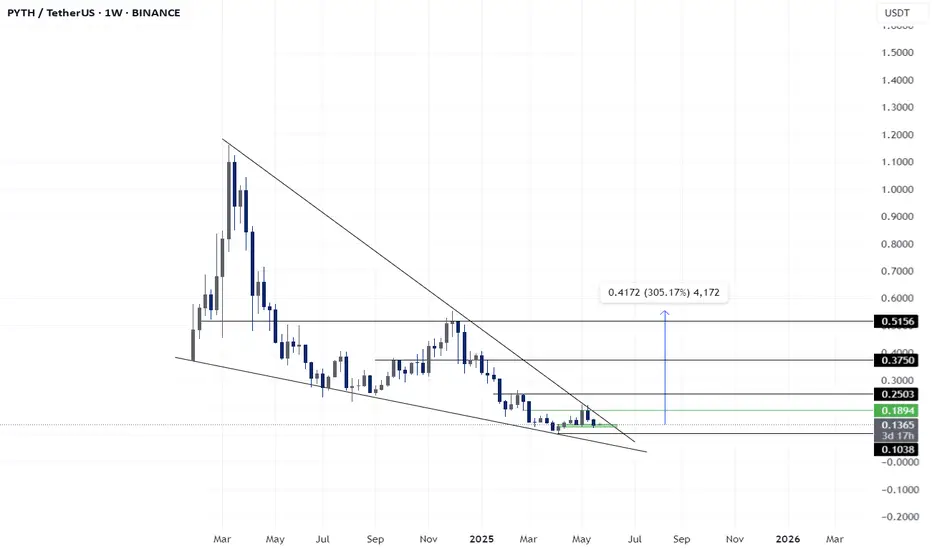
PYTH ROADMAPTo me the view is pretty clear.
* The purpose of my graphic drawings is purely educational.
* What i write here is not an investment advice. Please do your own research before investing in any asset.
* Never take my personal opinions as investment advice, you may lose your money.
PYTH - Super Bullish Wedge PatternBINANCE:PYTHUSDT
𝐊𝐞𝐲 𝐋𝐞𝐯𝐞𝐥𝐬 & 𝐒𝐭𝐫𝐚𝐭𝐞𝐠𝐲:
𝐄𝐧𝐭𝐫𝐲 𝐙𝐨𝐧𝐞: 87 – 91 USDT (marked in green)
This is a demand zone where price previously found support and bounced.
𝐃𝐂𝐀 (Dollar Cost Average): 83.6 USDT
Ideal level for accumulating further if price dips below the entry zone.
𝐒𝐭𝐨𝐩 𝐋𝐨𝐬𝐬 (𝐒𝐋): 78.6 USDT
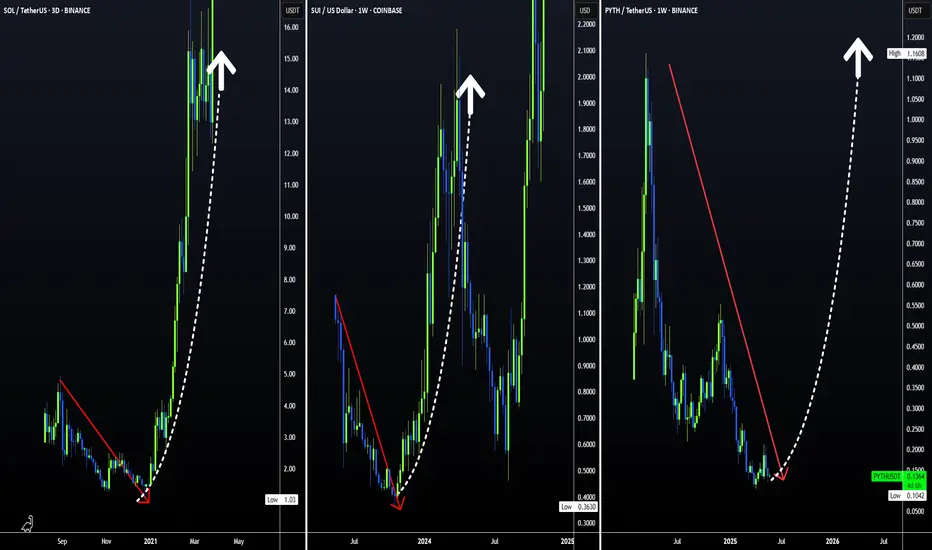
HUGE INCREASES Possible on PYT | Here's WhyPython is a fairly new altcoin with big upside.
From the earlier two charts on the left, we see that initial downturns shouldn't be feared. Historically, SOL and SUI started with downtrends and transitioned into massive upside alts.
Python might especially see parabolic increases, once ETH starts
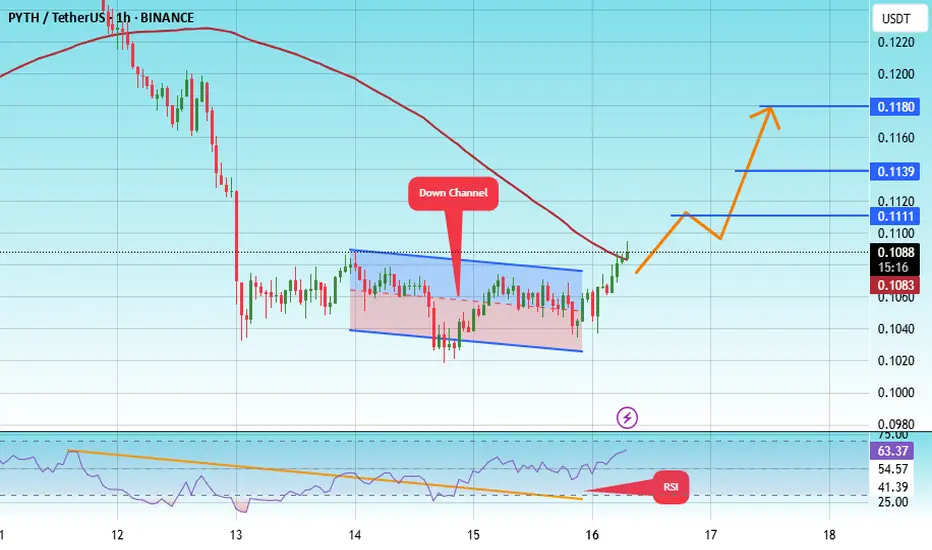
#PYTH/USDT#PYTH
The price is moving within a descending channel on the 1-hour frame, adhering well to it, and is heading for a strong breakout and retest.
We are seeing a bounce from the lower boundary of the descending channel, which is support at 0.1270.
We have a downtrend on the RSI indicator that is ab
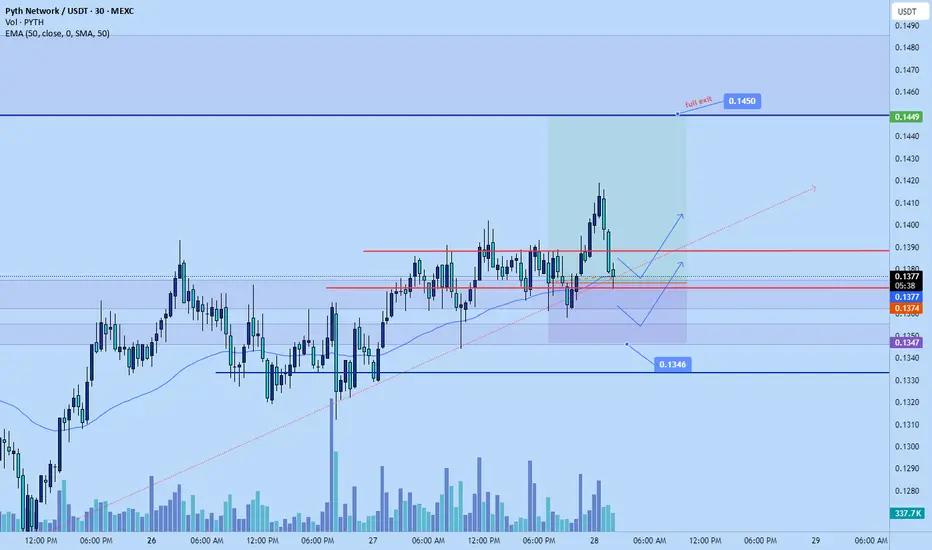
Pyth long to $0.1450 todayJust opened a long position on pyth.
Aiming for $0.1450
Wanted to trade btc to settle down a bit but PA is dog doodoo
Pyth has a higher probability to pump a bit today.
Prior day close above resistance with quite a bit of volume, anticipating continuation today
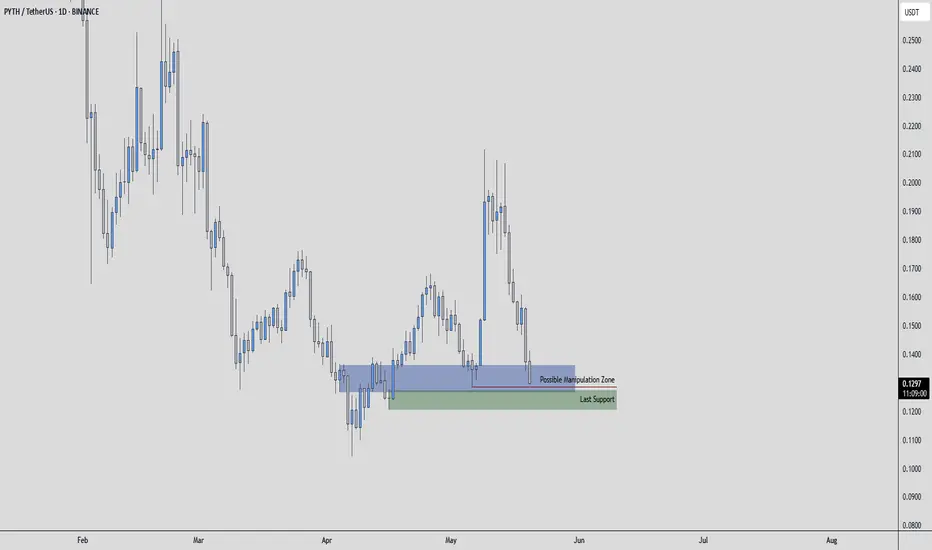
PYTHUSDT | Short Zone at the Blue Box—Proceed with Extra CautionPYTHUSDT is pressing lower with conviction, and the blue box marks our primary area to consider short entries. Although buyers are technically present, their support feels fragile; every test of this zone risks failing unless you have a strong appetite for heightened risk.
Why the Blue Box Matters
See all ideas
Summarizing what the indicators are suggesting.
Oscillators
Neutral
SellBuy
Strong sellStrong buy
Strong sellSellNeutralBuyStrong buy
Oscillators
Neutral
SellBuy
Strong sellStrong buy
Strong sellSellNeutralBuyStrong buy
Summary
Neutral
SellBuy
Strong sellStrong buy
Strong sellSellNeutralBuyStrong buy
Summary
Neutral
SellBuy
Strong sellStrong buy
Strong sellSellNeutralBuyStrong buy
Summary
Neutral
SellBuy
Strong sellStrong buy
Strong sellSellNeutralBuyStrong buy
Moving Averages
Neutral
SellBuy
Strong sellStrong buy
Strong sellSellNeutralBuyStrong buy
Moving Averages
Neutral
SellBuy
Strong sellStrong buy
Strong sellSellNeutralBuyStrong buy
Displays a symbol's price movements over previous years to identify recurring trends.