#PYTH/USDT#PYTH
The price is moving within an ascending channel on the 1-hour frame, adhering well to it, and is on track to break it strongly upwards and retest it.
We have support from the lower boundary of the ascending channel, at 1215.
We have a downtrend on the RSI indicator that is about to break and retest, supporting the upside.
There is a major support area in green at 0.1200, which represents a strong basis for the upside.
Don't forget a simple thing: ease and capital.
When you reach the first target, save some money and then change your stop-loss order to an entry order.
For inquiries, please leave a comment.
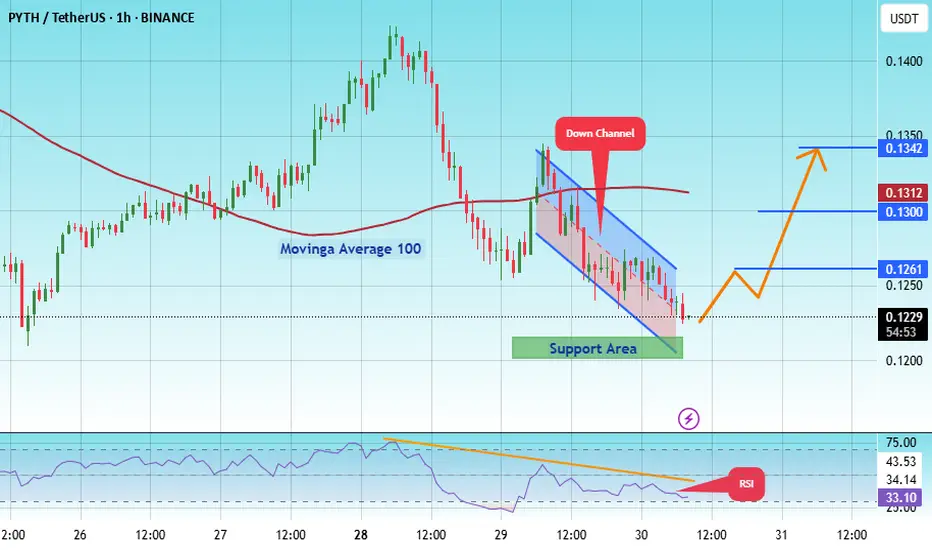
We have a trend to hold above the 100 Moving Average.
Entry price: 0.1230
First target: 0.1261
Second target: 0.1300
Third target: 0.1342
Don't forget a simple thing: ease and capital.
When you reach your first target, save some money and then change your stop-loss order to an entry order.
For inquiries, please leave a comment.
Thank you.
PYTHUSDT trade ideas
PYTHUSDT 1D#PYTH has broken above the descending trendline, and the retest has been completed successfully. It is now on the verge of breaking out above the daily SMA100.
If the daily candle closes above it, the upside targets are:
🎯 $0.1508
🎯 $0.1725
🎯 $0.1941
🎯 $0.2249
🎯 $0.2642
⚠️ As always, use a tight stop-loss and apply proper risk management.

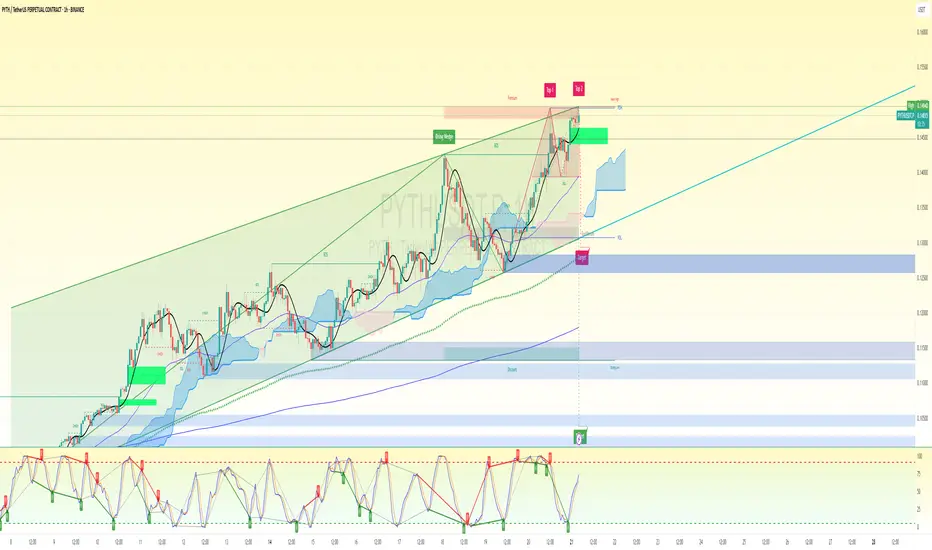
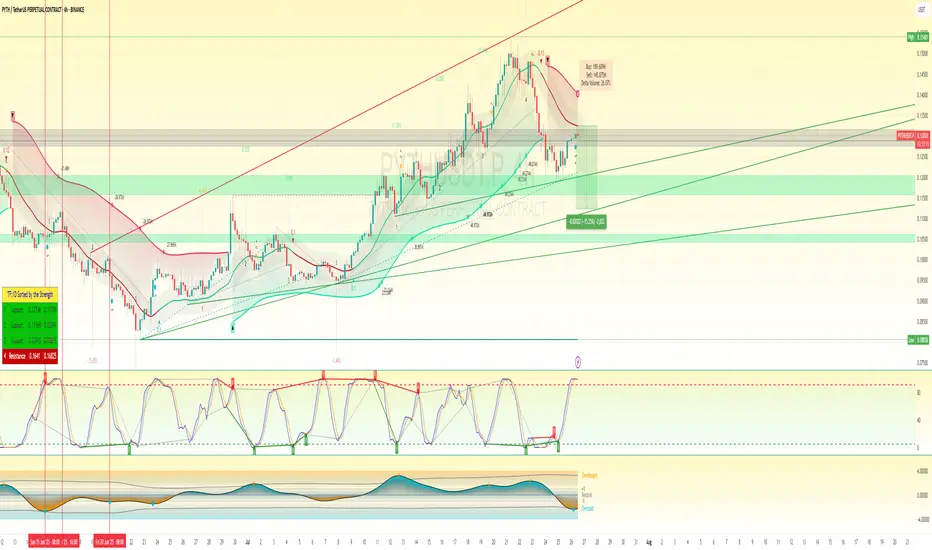
PYTH SHORT set upBias: Rejection at weak high above PDH into premium zone with bearish divergence and overbought oscillator
🔍 Confluences:
✅ Price in premium zone
✅ Wick rejection at weak high
✅ Stochastic RSI double top + bearish divergence
✅ Price extended away from 9/EMA baseline
✅ Possible inducement sweep of PDH liquidity
✅ Low volume on final push (distribution behavior)
🎯 Sniper Entry Zone:
Entry (Short): 0.1440 – 0.1455
(Markets may try one more inducement wick above PDH. Set alerts and place partial limit above 0.1445)
💰 Take-Profit Range (TP1):
TP1 Range: 0.1300 – 0.1320
(Aligns with top of cloud / 4H equilibrium retest zone and PDL proximity)
TP2: 0.1220
(Targeting full EQ zone retest / liquidity void)
🛡️ Stop Loss (SL):
SL: 0.1476
(Hard stop just above the weak high and final supply zone. Small buffer for possible wick)
🧠 Risk-Reward (R:R):
TP1 R:R: ~2.8:1
TP2 R:R: ~5:1
⏳ Estimated Timeframe for TP1:
Within 6–12 hours, assuming the reversal confirms on 1H close and momentum follows through.
🚨 Tactical Notes:
Watch for 1H close back below 0.1410 as added confirmation.
Momentum divergence + overbought suggests exhaustion.
Lock in profits at TP1, trail SL to BE, and let rest run if targeting TP2.
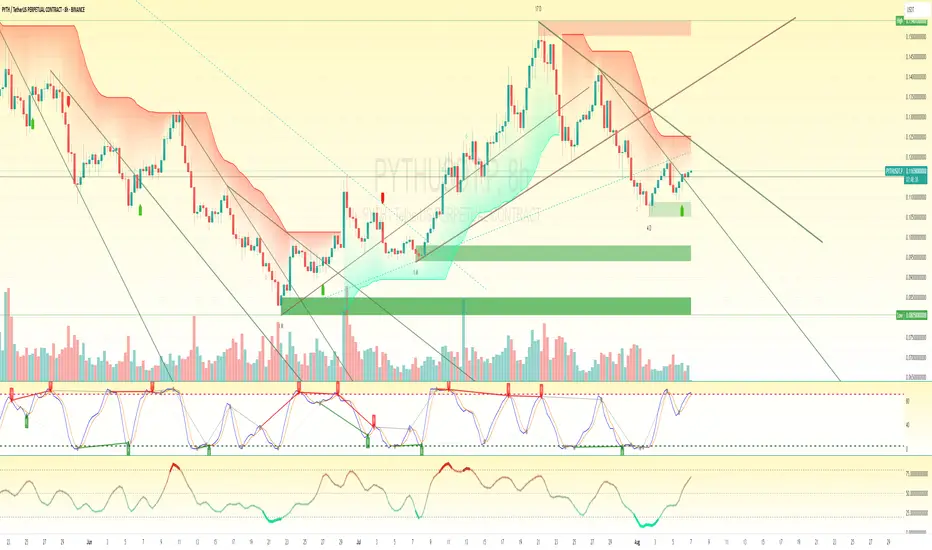
PYTH BEARISH 🔍 Chart Context Analysis
Trend: Clearly bearish structure with persistent lower highs and lower lows.
Price Location: Trading below the EMA cloud and under both descending trendlines — shows bearish control.
Stochastic RSI (8H): In overbought region and beginning to roll over — early signal of bearish momentum building.
MACD/Stochastic Momentum Below: Shows recent bullish recovery but now stalling near the midline, potentially turning.
Volume: Volume is weak and not supporting a strong bullish reversal.
Liquidity Pools Below: Thick demand zones between $0.105 – $0.100 and $0.085 – $0.080 visible.
🟠 Most Probable Setup: Bearish Rejection from EMA Cloud
This is a short trade setup rejecting from the EMA resistance zone and trendline.
🔹 Sniper Entry:
Entry Zone: $0.1160 – $0.1170 (current price range)
Ideally enter near $0.1170 if price sweeps it on a wick and rejects
Stop loss should sit above the recent swing high and trendline confluence
🔹 Stop Loss (SL):
$0.1205
Just above EMA cloud and previous bearish breaker
Invalidates the setup if price sustains above this level
🔹 Take Profit Targets:
TP1 Range: $0.1105 – $0.1080 → (first support + minor liquidity zone)
TP2: $0.1050 → (major demand/4D support low)
TP3 (optional): $0.1000 → (if momentum continues and stochastic breaks down hard)
⏱️ Estimated Timeframe for TP Hits:
TP1: 6–12 hours
TP2: 18–24 hours
TP3: 1.5–2.5 days (if broader bearish move unfolds)
✅ Key Reasons for Bearish Bias
EMA cloud acting as dynamic resistance.
Stochastic RSI overbought and potentially crossing down.
Price under HTF trendlines and structure.
No strong bullish volume spike — indicating weak bull follow-through.
Multiple liquidity pools still uncollected below ($0.105 – $0.100).
🚫 When to Invalidate the Short:
Price closes above $0.1205 on 8H candle.
Bullish volume spike with engulfing candle.
Bullish breakout through both descending trendlines.
PYTH SHORT SET UP (version 2)🔍 Current Context:
Price is trading around $0.13007, just above a major reclaimed support demand zone ($0.126–$0.120).
4H Stochastic RSI is entering the overbought zone (high-risk for new longs).
Price has bounced off a local Fib level + trendline cluster.
Volume delta favors buys, but candles show hesitation near EMA zone.
✅ Most Probable Trade Setup: Bearish Reversal Sniper (Short Bias)
Reason: Price has rallied back into a key resistance zone + 4H EMA cloud, and Stochastic RSI is in overbought. Momentum is stalling under $0.1325. Unless bulls reclaim above $0.1345–$0.1355 cleanly, a rejection and pullback is highly probable.
🧨 Entry (Short):
Entry Range: $0.1320 – $0.1335 (as close to EMA ribbon & resistance cluster as possible)
🎯 Take Profit (TP1 Range):
TP1 Range: $0.1235 – $0.1215 → retest of reclaimed support
TP2 (optional): $0.1170 zone (deeper liquidity pocket)
🛡️ Stop Loss (SL):
Hard SL: Above $0.1358
OR above 4H swing high at $0.1370, if allowing some buffer
📉 Risk-to-Reward:
R: 0.0038
R:R ≈ 2.5–3.5 depending on exit zone
🕰️ Estimated Trade Duration:
TP1 zone hit could take 6–12 hours, based on 4H cycles
TP2 hit in 12–24 hours if momentum holds down
🔁 Invalidation:
Clean break and 4H candle close above $0.1358, invalidates short setup
In that case, wait for pullback to long above $0.136 if strength persists
🚨 Summary:
Most Probable Setup = Short
Reason: EMA rejection + Stoch RSI overbought + weak candle momentum
Action: Enter $0.1320–$0.1335 | SL above $0.1358 | TP1 $0.1235–$0.1215
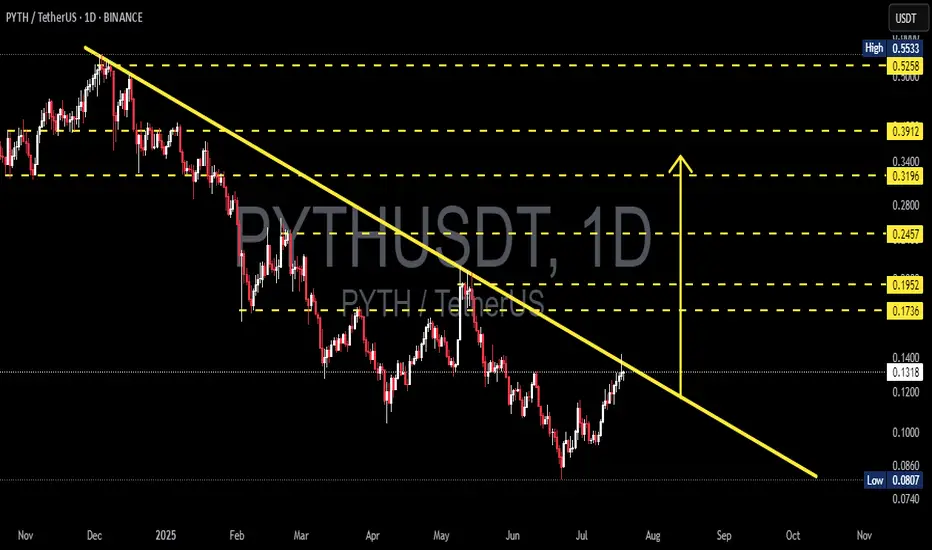
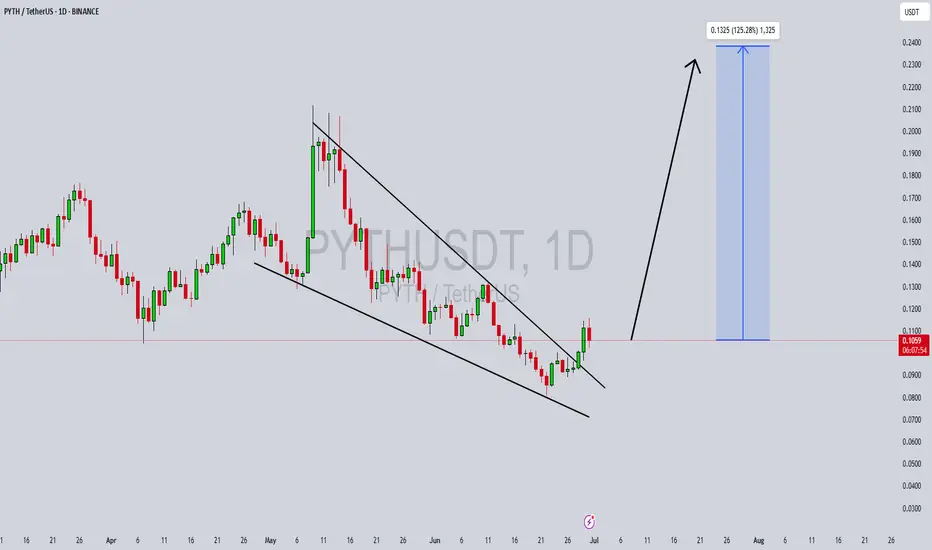
PYTH/USDT Breakout Watch Is the Accumulation Phase Finally Over?📌 Technical Overview:
After nearly 8 months in a strong downtrend, PYTH/USDT is now showing signs of a potential trendline breakout. Price action is testing a critical descending resistance that has been respected since late 2024. This could be the turning point for a major trend reversal.
📉 Historical Context:
PYTH reached a high of $0.55, followed by a consistent downtrend with a series of lower highs and lower lows.
Since June 2025, however, the structure has shifted to higher lows, signaling early accumulation and waning bearish momentum.
📐 Technical Pattern: Descending Trendline Breakout
Price is currently challenging a long-term descending trendline, which has held as resistance since November 2024.
The pattern resembles a falling wedge/descending triangle breakout, typically viewed as a bullish reversal pattern.
A recent bullish candle is attempting to break above the $0.13 level, indicating growing momentum.
🟩 Bullish Scenario: The Reversal is On
If price closes above $0.13–$0.14 and confirms the breakout:
1. Short-Term Targets:
🔼 $0.1736 (Minor resistance / previous demand zone)
🔼 $0.1952 (Breakout retest zone)
2. Mid-Term Targets:
🔼 $0.2457 (Strong consolidation area)
🔼 $0.3196 – $0.3912 (Pre-breakdown range highs)
3. Long-Term Target:
🔼 $0.5258 – $0.5533 (Previous market top)
> A successful breakout could trigger a rally of +200–300%, especially if supported by market-wide bullish sentiment.
🟥 Bearish Scenario: Fakeout Risk
If price fails to hold above the trendline and drops below $0.12:
Support zones to watch:
🔽 $0.1000 (psychological level)
🔽 $0.0860
🔽 $0.0807 (major bottom support)
This would indicate a bull trap, and the market could return to a distribution phase.
🔍 Additional Confluences:
RSI is rising toward 60–65, suggesting bullish momentum is building.
Volume is increasing near the breakout — a good sign of trader interest.
A Golden Cross (EMA 50 crossing EMA 100) could occur soon if upside holds.
✅ Conclusion: Critical Pivot Zone
PYTH is testing a major inflection point. If confirmed, this breakout could end the long-term downtrend and launch a new bullish cycle. A rejection here, however, keeps the bear case alive.
#PYTHUSDT #PYTHBreakout #CryptoAnalysis #AltcoinSetup #TechnicalAnalysis #BreakoutCrypto #TradingView #TrendReversal #CryptoSignals #FallingWedge #BullishMomentum
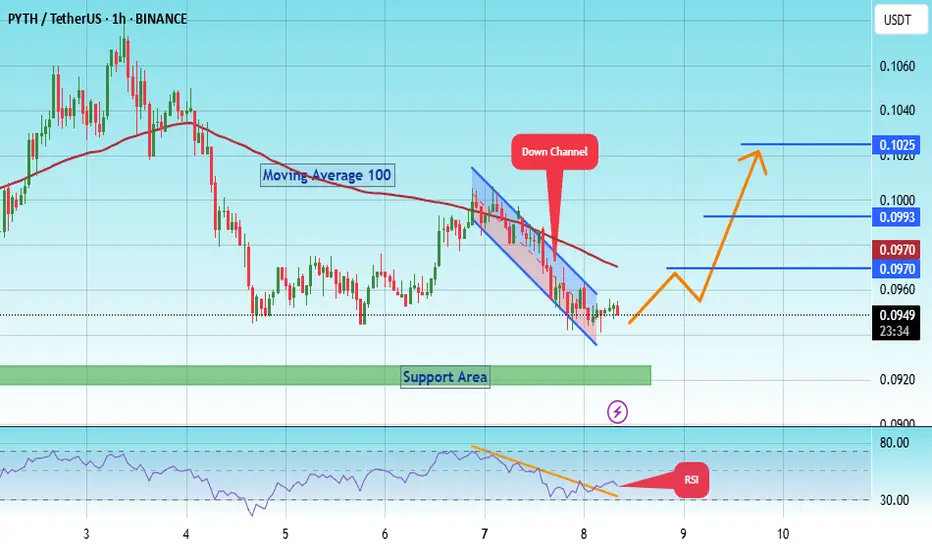
#PYTH/USDT pump to $ 0.1025soon!#PYTH
The price is moving within a descending channel on the 1-hour frame, adhering well to it, and is on its way to breaking it strongly upwards and retesting it.
We have a bounce from the lower boundary of the descending channel. This support is at 0.0938.
We have a downtrend on the RSI indicator that is about to break and retest, supporting the upside.
There is a major support area in green at 0.0920, which represents a strong basis for the upside.
Don't forget a simple thing: ease and capital.
When you reach the first target, save some money and then change your stop-loss order to an entry order.
For inquiries, please leave a comment.
We have a trend to hold above the 100 Moving Average.
Entry price: 0.0950
First target: 0.0970
Second target: 0.0993
Third target: 0.1025
Don't forget a simple thing: ease and capital.
When you reach the first target, save some money and then change your stop-loss order to an entry order.
For inquiries, please leave a comment.
Thank you.
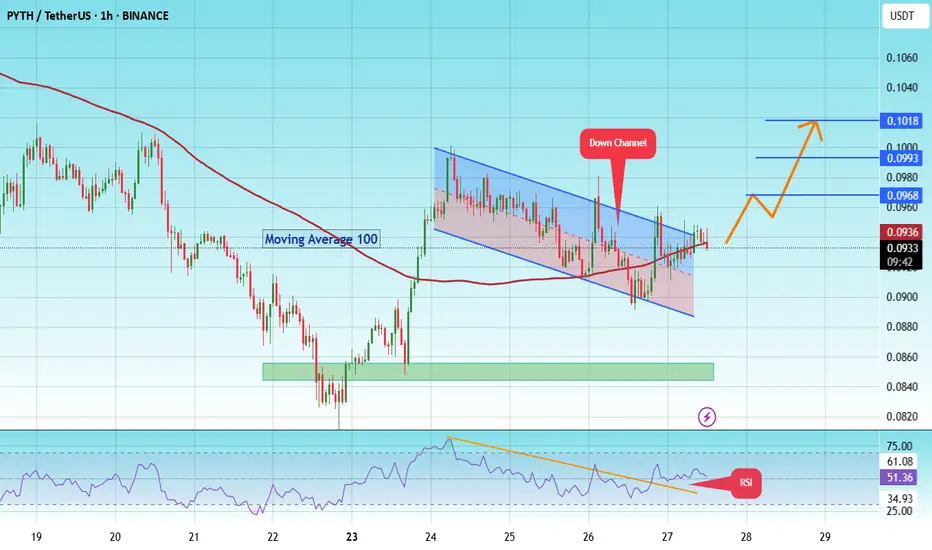
Pyth pump to $0.1018 soon! #PYTH
The price is moving within a descending channel on the 1-hour frame and is expected to break and continue upward.
We have a trend to stabilize above the 100 moving average once again.
We have a downtrend on the RSI indicator that supports the upward break.
We have a support area at the lower boundary of the channel at 0.0895, acting as strong support from which the price can rebound.
We have a major support area in green that pushed the price upward at 0.085.
Entry price: 0.0936
First target: 0.0968
Second target: 0.0993
Third target: 0.1018
To manage risk, don't forget stop loss and capital management.
When you reach the first target, save some profits and then change the stop order to an entry order.
For inquiries, please comment.
Thank you.
Pyth Big long to $0.1155Just recently opened a long trade on pyth. Aiming for $0.1116 to $0.1155
Beautiful setup.
Market is bullish and seems the correction have come to an end on the 1hr tf. Anticipating strong push soon.
Not much to be said here, the price action is clean and the idea is clear, trade with the trend.
Whales are also loading up.
DTT setup

PYTHUSDT Forming Falling WedgePYTHUSDT is setting up for what could be a powerful bullish move, as it has recently formed a classic falling wedge pattern on the chart. This is widely recognized among crypto traders as a strong reversal pattern, often appearing near the end of a downtrend when selling pressure starts to lose momentum. As price action tightens within this wedge, it creates an ideal scenario for a breakout to the upside, especially with good volume providing solid confirmation of buyer interest.
The current volume levels on PYTHUSDT look promising and indicate growing accumulation among investors. When a falling wedge is accompanied by increasing volume near its breakout point, it significantly strengthens the likelihood of a sustained upward trend. Many traders will be looking for a decisive close above the wedge’s resistance line, which could open the door for a rally aiming for gains in the 90% to 100%+ range. This makes PYTHUSDT an attractive option for swing traders and mid-term holders seeking high-potential setups in the crypto market.
What adds to the bullish thesis is the rising interest from investors who are keeping a close eye on PYTHUSDT. As broader market sentiment begins to lean bullish, projects like PYTH that combine a reliable technical structure with growing investor confidence often become top picks. This creates the potential for not just technical buying but also FOMO-driven momentum, which can accelerate price targets once the breakout gains traction.
With all these factors aligning — a well-formed falling wedge pattern, supportive volume, and increased investor attention — PYTHUSDT could be one of the standout altcoins in the coming weeks. Keep watch for confirmation of the breakout and manage your risk wisely to capture the best possible move this pattern has to offer.
✅ Show your support by hitting the like button and
✅ Leaving a comment below! (What is You opinion about this Coin)
Your feedback and engagement keep me inspired to share more insightful market analysis with you!

PYTHUSDT 1D#PYTH has broken out of the falling wedge to the upside on the daily chart and was initially rejected from the EMA50. It's now heading back to retest the wedge.
In case of a successful bounce, the upside targets are:
🎯 $0.1217
🎯 $0.1344
🎯 $0.1471
🎯 $0.1651
🎯 $0.1881
🎯 $0.2173
🎯 $0.2326
🎯 $0.2545
⚠️ Always use a tight stop-loss to manage risk and protect your capital.

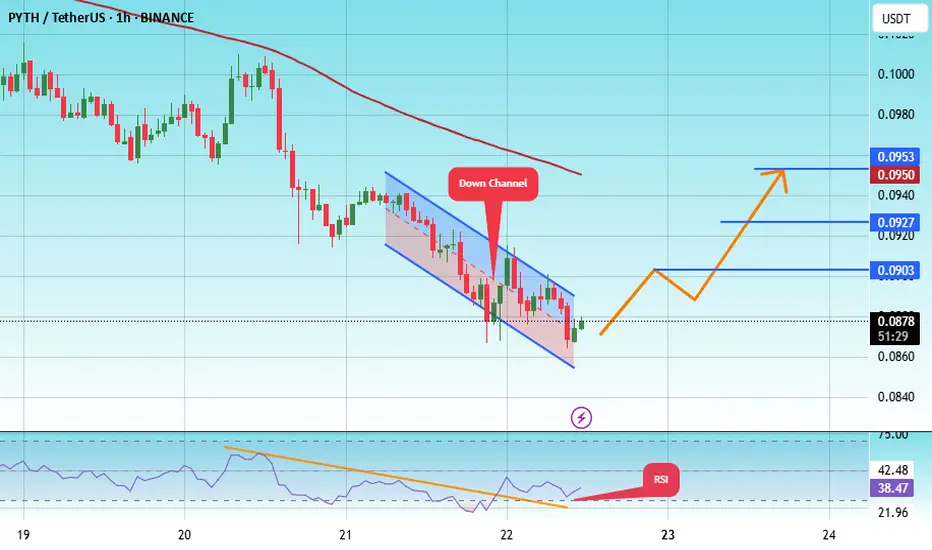
#PYTH/USDT#PYTH
The price is moving within a descending channel on the 1-hour frame, adhering well to it, and is heading for a strong breakout and retest.
We are seeing a bounce from the lower boundary of the descending channel, which is support at 0.0860.
We have a downtrend on the RSI indicator that is about to be broken and retested, supporting the upward trend.
We are looking for stability above the 100 moving average.
Entry price: 0.0880
First target: 0.0903
Second target: 0.0927
Third target: 0.0950
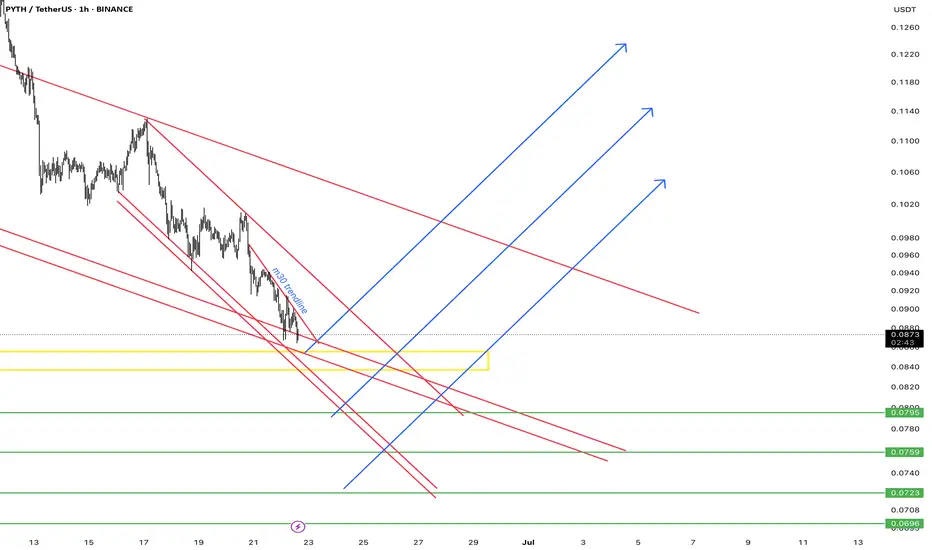
PYTH/USDT Setup — The Calm Before the Boom?
📅 Entry Zones: June 23 & June 30 — prime moments before potential breakout.
🟨 Strong demand zone just below — smart money likely watching this closely.
💥 A breakout above the wedge could ignite a rally toward:
→ 0.099
→ 0.105
→ 0.115+ (where fireworks begin)
🧲 Don’t sleep on this — once the move starts, it might be gone in minutes.
Buy the fear, ride the squeeze.
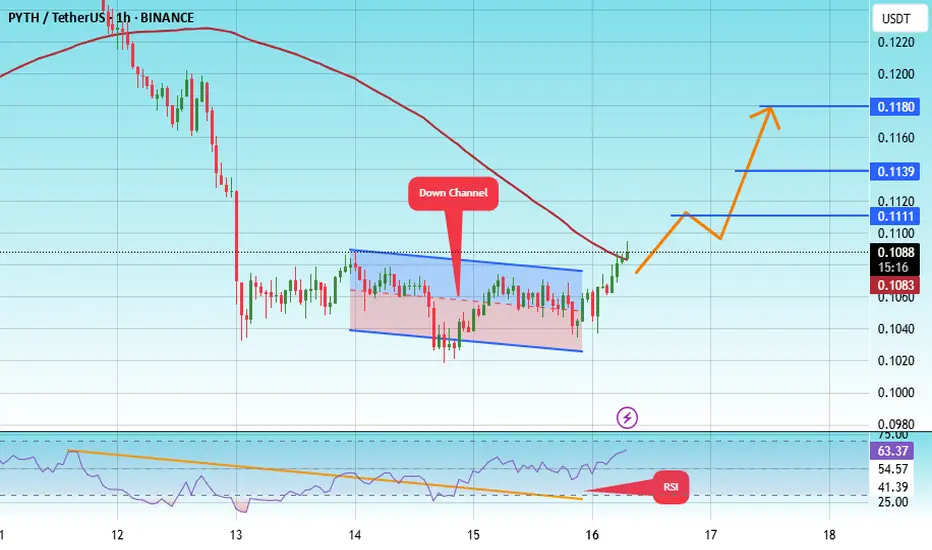
#PYTH/USDT#PYTH
The price is moving within a descending channel on the 1-hour frame, adhering well to it, and is heading toward a strong breakout and retest.
We are experiencing a rebound from the lower boundary of the descending channel. This support is at 0.1030.
We have a downtrend on the RSI indicator that is about to be broken and retested, supporting the upward trend.
We are heading toward stability above the 100 moving average.
Entry price: 0.1080
First target: 0.1111
Second target: 0.1140
Third target: 0.1180
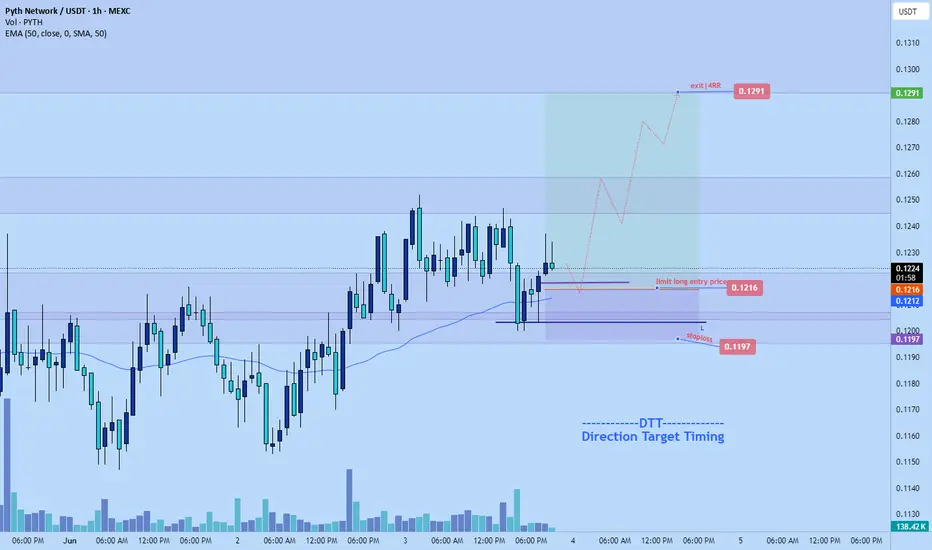
Pyth pump to $0.1290 soon!Just recently set up a limit order to long pyth to 0.1291 area
Roughly 4rr
Details on chart.
Corrective long. DTT methodology applied.
pyth sclap long to $0.1250 todayMarket overall is pushing strongly today.
Pyth just recently flipped to bullish structure on 1hr tf and I don't think it will correct down much before continuing to pump.
Stop: $0.1180 should be enough for invalidation
0.1250 or higher. My tp is not set. I have alarms. Will make a decision to close manually

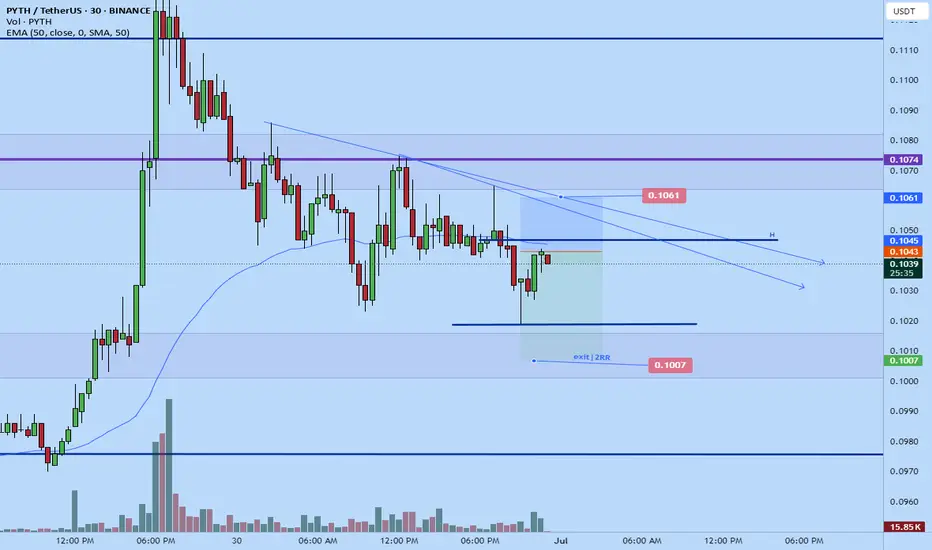
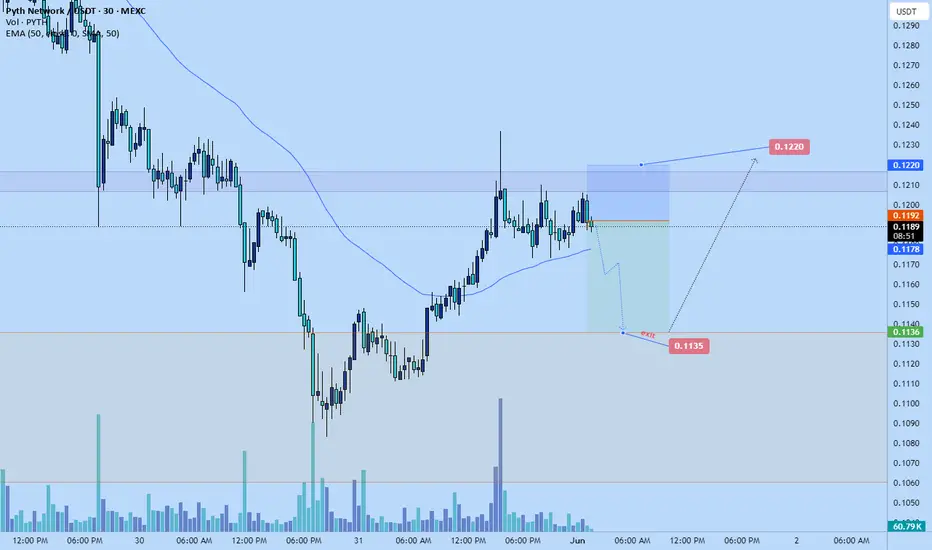
pyth short scalppyth short scalp to 0.1135
market likely to retest lower at that point before bullish continuation. Main support area.
2rr
stop:0.1220
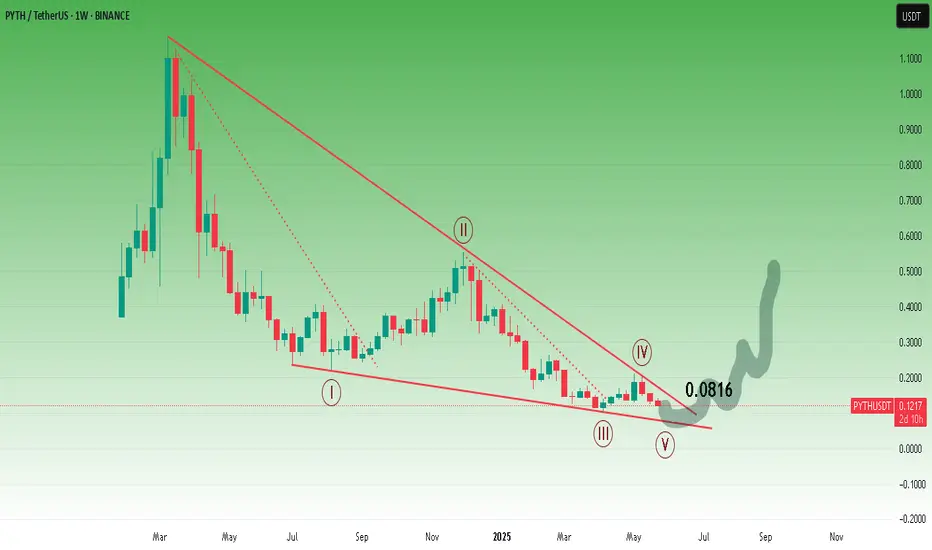
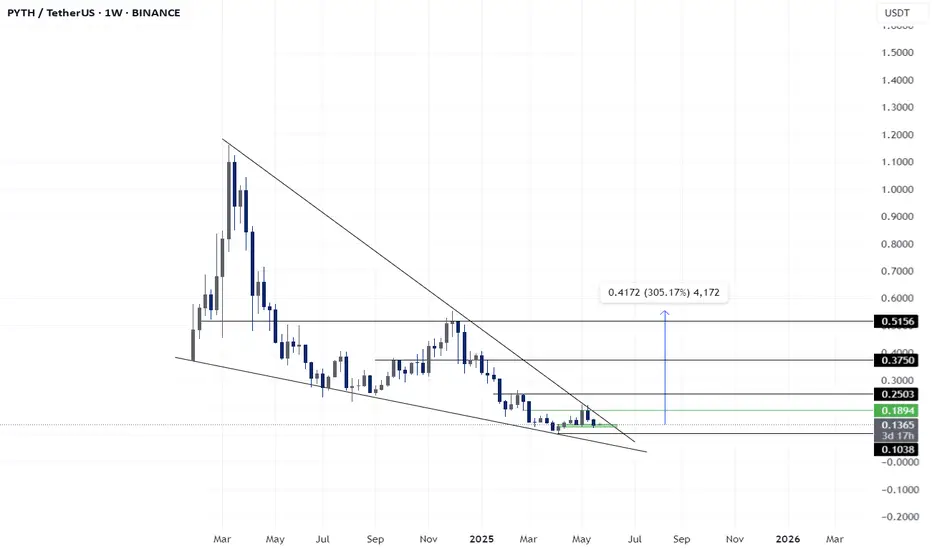
PYTH ROADMAPTo me the view is pretty clear.
* The purpose of my graphic drawings is purely educational.
* What i write here is not an investment advice. Please do your own research before investing in any asset.
* Never take my personal opinions as investment advice, you may lose your money.
PYTH - Super Bullish Wedge PatternBINANCE:PYTHUSDT
𝐊𝐞𝐲 𝐋𝐞𝐯𝐞𝐥𝐬 & 𝐒𝐭𝐫𝐚𝐭𝐞𝐠𝐲:
𝐄𝐧𝐭𝐫𝐲 𝐙𝐨𝐧𝐞: 87 – 91 USDT (marked in green)
This is a demand zone where price previously found support and bounced.
𝐃𝐂𝐀 (Dollar Cost Average): 83.6 USDT
Ideal level for accumulating further if price dips below the entry zone.
𝐒𝐭𝐨𝐩 𝐋𝐨𝐬𝐬 (𝐒𝐋): 78.6 USDT
Placed below major structure support to limit downside risk.
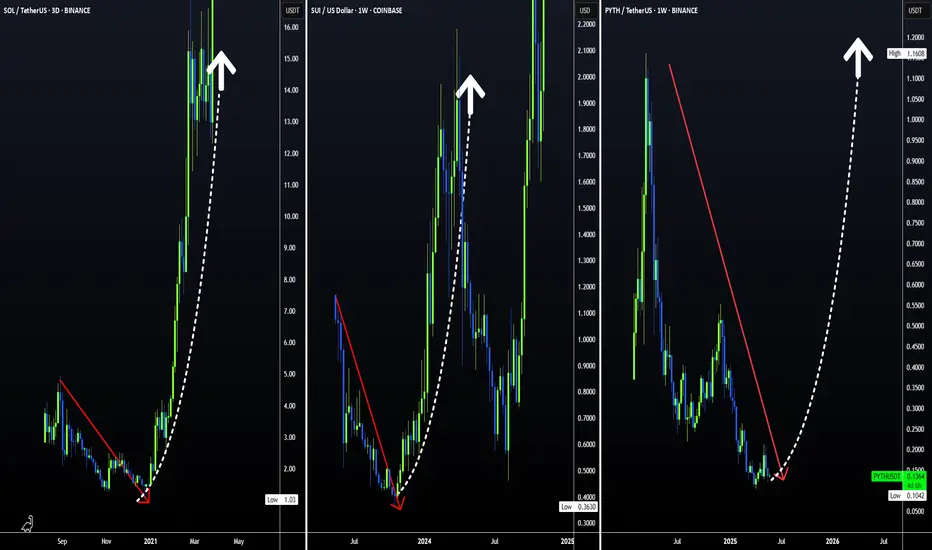
HUGE INCREASES Possible on PYT | Here's WhyPython is a fairly new altcoin with big upside.
From the earlier two charts on the left, we see that initial downturns shouldn't be feared. Historically, SOL and SUI started with downtrends and transitioned into massive upside alts.
Python might especially see parabolic increases, once ETH starts to move towards a new ATH. This will be due to the rotation of liquidity between altcoins in terms of larger and smaller market caps.
Don't miss yesterdays update on ETH!
____________________________
BINANCE:SOLUSDT
COINBASE:SUIUSD
BINANCE:PYTHUSDT
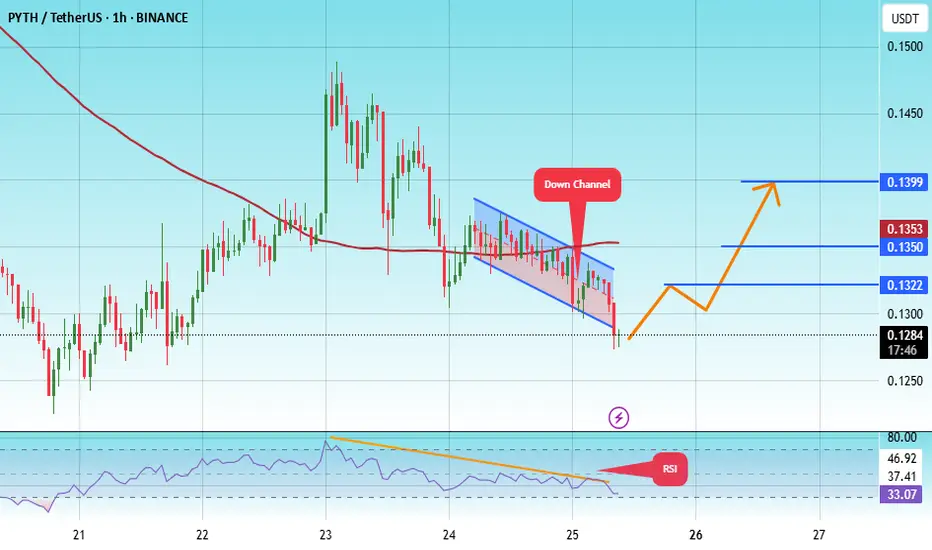
#PYTH/USDT#PYTH
The price is moving within a descending channel on the 1-hour frame, adhering well to it, and is heading for a strong breakout and retest.
We are seeing a bounce from the lower boundary of the descending channel, which is support at 0.1270.
We have a downtrend on the RSI indicator that is about to be broken and retested, supporting the upward trend.
We are looking for stability above the 100 moving average.
Entry price: 0.1280
First target: 0.1322
Second target: 0.1350
Third target: 0.1400