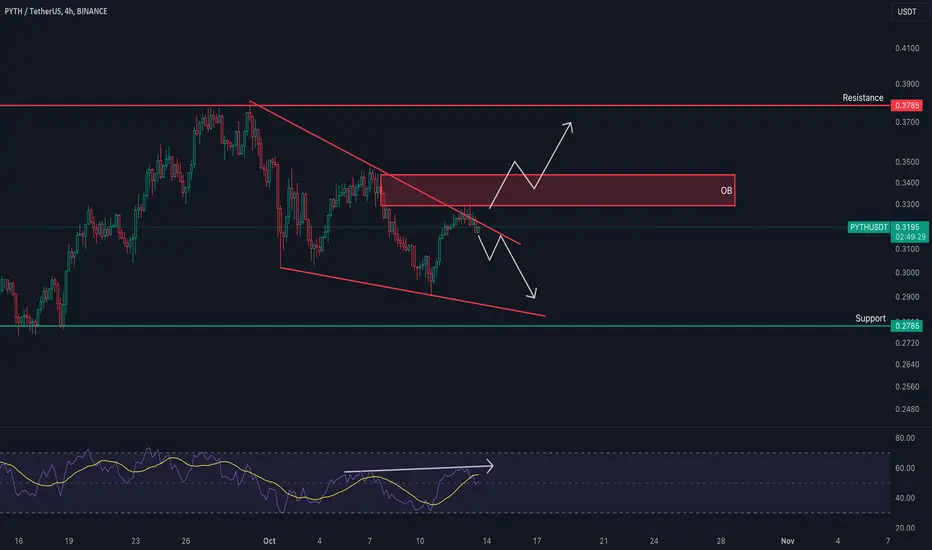
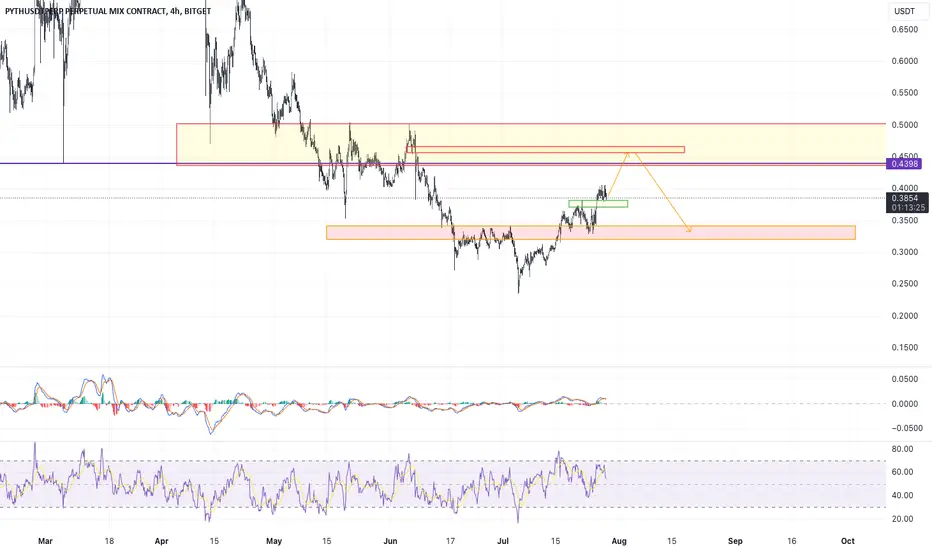
PYTH USDT- CLICK HERE TO CHECK ANALYSISNow price is rejecting from the OB, And RSI shows bearish divergence.
PYTHUSDT trade ideas
PYTH/USDTThis is already an active trade setup but looks like the chart is providing another opportunity to get a good R:R entry.
Large M shape harmonic structure.
Lower demand line appearing to show a partial decline and seller exhaustion at the key level.
Bullish engulfing candle off the key level to boot.
What is not to love here? : )

PYTHUSDTToday's analysis is on PYTH.
Following the Price action, it would be best to view and position oneself for the greater good.
This is one of those alts, that had a good rally at inception and could repeat same run again and again.
Looking forward to the play of the trade, the momentum maybe slow but i'd be watching
Trade wisely
Trader45

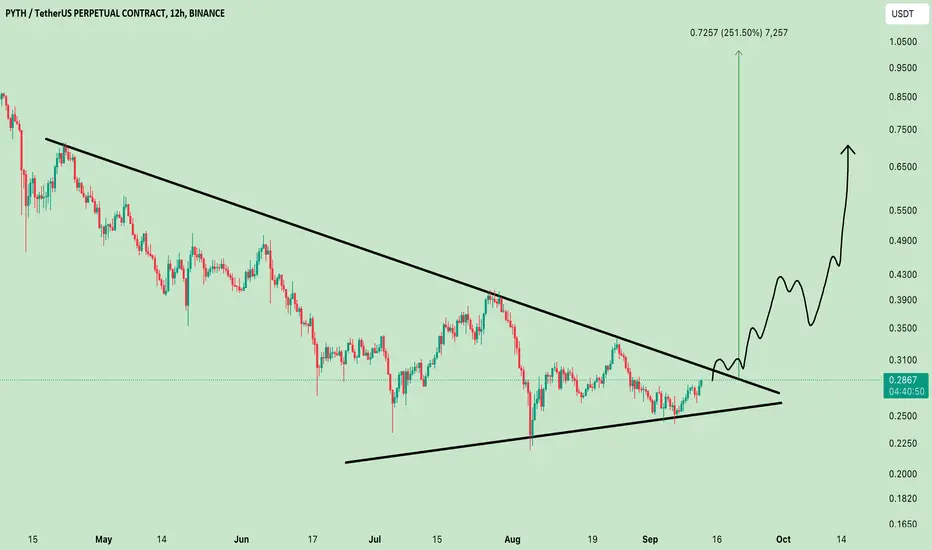
#PYTH/USDT: Bullish Breakout Ahead! SEED_DONKEYDAN_MARKET_CAP:PYTH /USDT: Long Position🚀
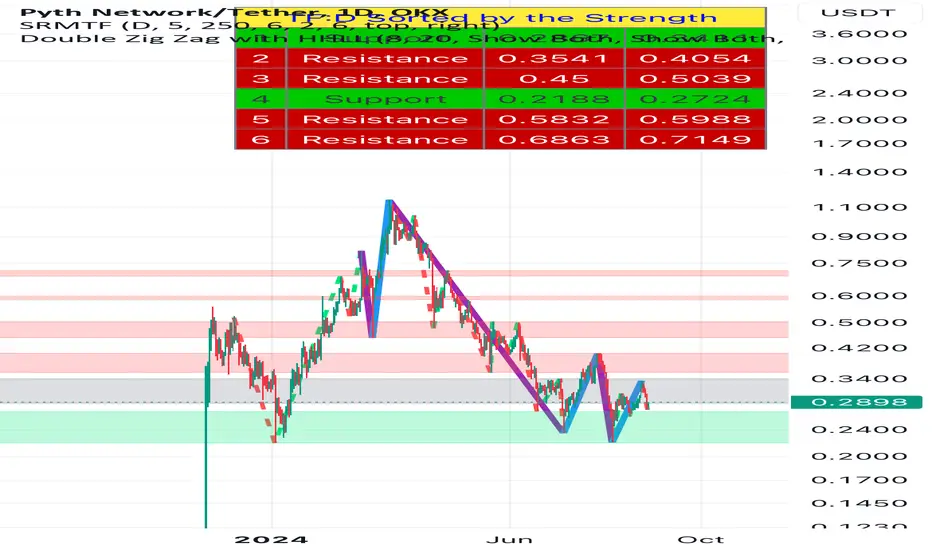
PYTH is forming a descending wedge pattern, which is a bullish reversal setup. The price has consolidated and is approaching a breakout point. If the price breaks above the wedge resistance, a strong upward move can be expected, with significant upside potential indicated in the chart.
Entry Point: Current Market Price (CMP)
Additional Positions: Add more if the price dips to the support zone near 0.25 USDT.
🎯Targets:
$0.39
$0.49
$0.65
$0.72 (Final target)
⛔Stop Loss (SL): $0.24 to manage downside risk.
⚖️Leverage:
Use leverage cautiously, between 5x and 10x depending on your risk tolerance.
DYOR NFA
#Cryptocurrency #Crypto #XRP
PYTHUSDTPYTH ~ 3D
#PYTH So far the price is maintaining this Support Block. if you have Conviction on this coin,. Maybe now is a good time to make purchases in stages.

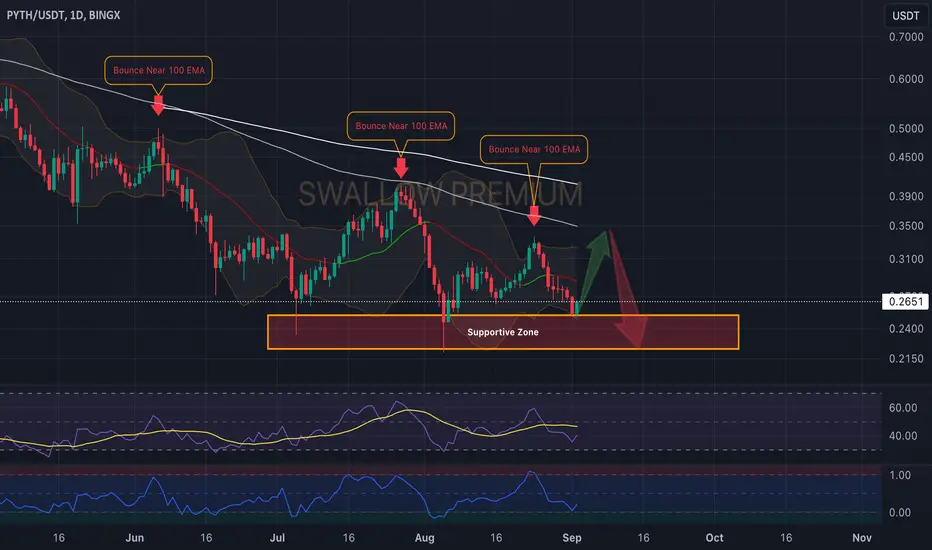
Pyth Network (PYTH): Possible Move To 100 EMA Pyth Network might have a nice little bounce from current zone of support, where price should move to 100EMA. So we are looking for a bounce from support to EMA and a movement inside that zone until we see a clean break of the EMA or support line here.
Swallow Team
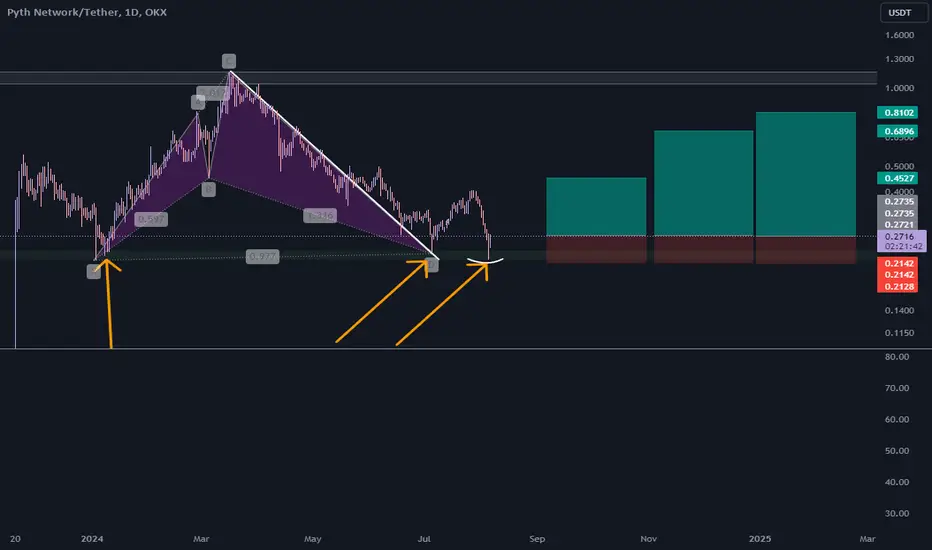
Pythusdt trading opportunityPythusdt is currently in a strong downtrend, forming a falling wedge pattern, indicating a potential reversal.
We anticipate a bottom around the previous low, and plan to accumulate near that zone, considering a possible double bottom formation.
The chart outlines our strategy and accumulation path. A stop-loss is crucial, as a failure to hold the current low could trigger a significant downward move.
Exercise caution in trading.

Pythusdt buy opportunityPythusdt is currently navigating within a potential ascending broadening wedge formation, indicating a widening price range over time.
Our expectation is for the price to adhere to this setup until it reaches the final setup target delineated on the chart. Our strategy involves buying back the coin within the provided buy area, which is anticipated to serve as a robust support and demand zone.
Notably, the highlighted resistance level represents a crucial local barrier. Should the price breach this level, we advocate for proactive action, entering positions on pullbacks towards the breakout level rather than waiting for a retest of the buy-back area.
We encourage the sharing of insights and opinions on this coin for further discussion and analysis.

#PYTH: The Next Big Move? A 350% Opportunity Awaits!Currently trading at $0.287, this setup offers an incredible opportunity to ride the wave up to $1. Don't miss out on this explosive move!
$PYTH.PLong position with stop loss around -5.8% from 1st entry.
Please DYOR before take a position.
Always use your stop loss amd manage ylur own risk!!!

All charts going Private!Hi everyone! I wanted to let you know that I will no longer be sharing public charts on this channel. After much consideration, I've decided to focus on my own trades and provide insights only to a select few in private consultations.
I realized that offering free services can sometimes do more harm than good. Without the right strategy or money management, some people end up losing money. I believe that a more personalized approach will allow me to better support those who are serious about improving their market skills.
For those of you who have followed my public charts, I sincerely wish you success in the ongoing market cycle. Remember, the key to long-term success is staying calm and patient during market fluctuations.
"The last chart posting here is PYTH its known as LINK killer"

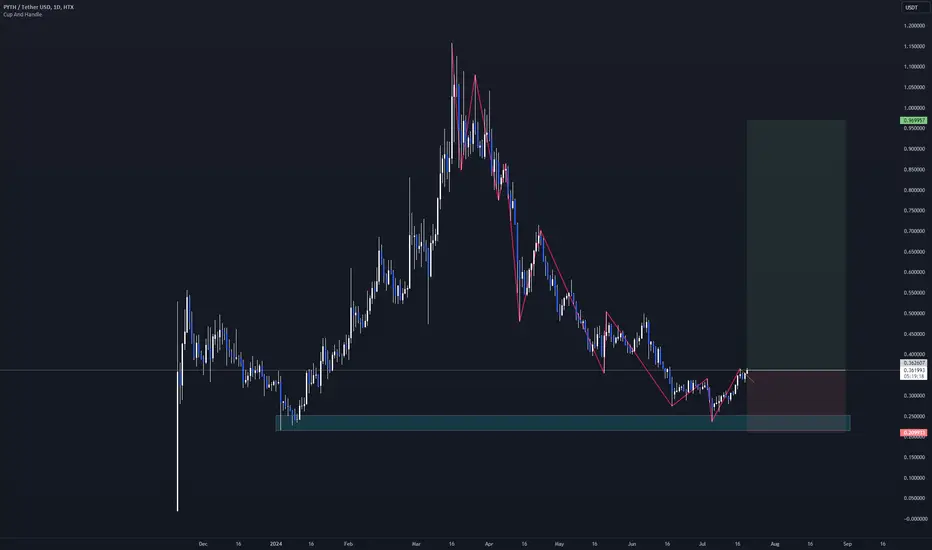
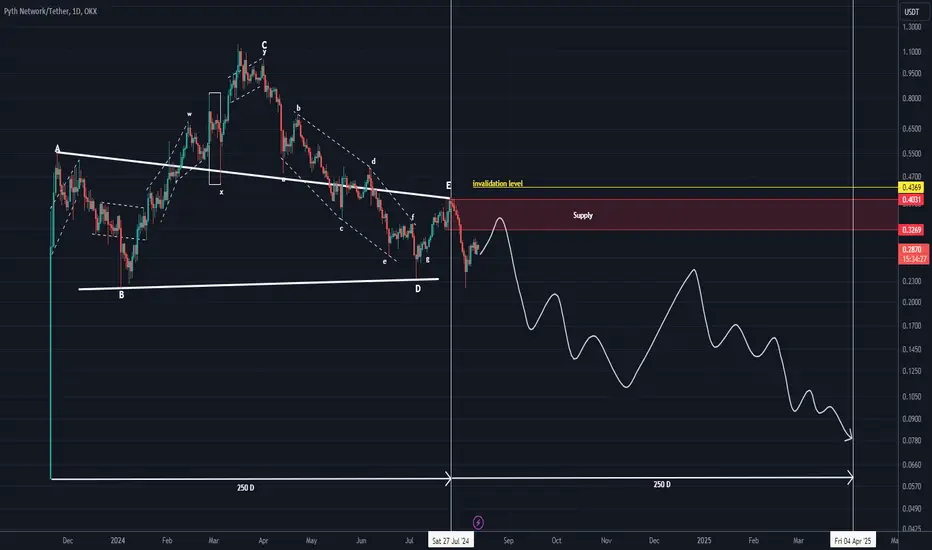
PYTH medium term is bearishBy examining the chart data, we found that PYTH has completed a large degree pattern. This pattern is related to wave A. This pattern has lasted for about 250 days.
It is expected that wave B is also a pattern of the same degree as wave A. It means about 200-250 days.
The supply range is the best range for sell/short positions.
Note that in order to take a position, one must have a trading setup and this is only a medium-term view for PYTH.
Closing a daily candle above the invalidation level will violate the analysis
For risk management, please don't forget stop loss and capital management
Comment if you have any questions
Thank You
PYTHUSDT ANALYSISPAIR : BYBIT:PYTHUSDT.P
Leverage: 5X
Direction: LONG 🔼
SL: HODL
TP: 0.3629
ANALYSIS:
Market Cypher B: 1D TF✅
Bull Bear Power: 5HR TF✅
Nearest Resistance: 0.3629
Nearest Support: 00.1800
⚠️#DYOR

PYTHUSDT ANALYSISPAIR : BYBIT:PYTHUSDT.P
Leverage: 5X
Direction: SHORT
if pyth taps this zone 0.3400 we migth get a huge short from there
follow for more signals, updates and ideas
ANALYSIS:
Market Cypher B: 1D TF✅
Nearest Resistance: 0.1800
Nearest Support: 0.3630
⚠️#DYOR

PYTHUSDT 1DPYTH ~ 1D
#PYTH Very confusing
Whether to buy or worry.
we will give a conclusion.
in a bull market all bearish patterns may be easy to validate or fail structurally.
Losing this Support Block will make this bearish Pattern real, or if SEED_DONKEYDAN_MARKET_CAP:PYTH manages to defend this Support Block, We will say this bearish Pattern will fail.

PYTH/USDTEasy to strategise a long position here, full reset presenting the holy jarmonic structure.
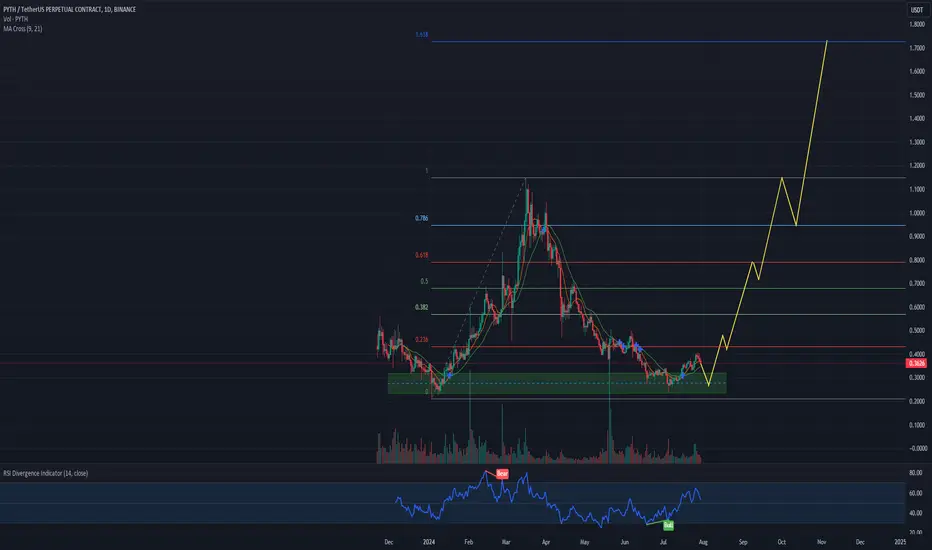
$Pyth Macro chartBuying zone : $0.32-0.25
🎯 Target 1 - $0.48
🎯 Target 2 - $0.8
🎯 Target 3 - $1.15
🎯 Final target - $1.72
PYTHUSDT.PWe do have a local uptrend here. Closest resistance which price would like to test is around 0,45. Will be looking closer for the next move as the price will reach it. Forwardly suppose, that it would like to retest the demand zone around 0,33.
DYOR
Alikze »» PYTH| Descending channel failure🔍 Technical analysis: Descending channel failure
- It has been moving in a downward channel in the 8H time frame and daily.
- Currently, with the failure of the channel roof, it is around the supply area and neck line.
- Therefore, in case of a negative reaction, it can be broken into the channel with pullback and touch the specified targets by maintaining the 0.29 area.
💎 Alternative scenario: In addition, if it stabilizes below the 0.29 area, it can retest the green box.
🛑 Targets: 0.39 - 0.44 and supply area or red box.
🟩 Support: 0.29
»»»«««»»»«««»»»«««
Please support this idea with a LIKE and COMMENT if you find it useful and Click "Follow" on our profile if you'd like these trade ideas delivered straight to your email in the future.
Thanks for your continued support.
Best Regards,❤️
Alikze.
»»»«««»»»«««»»»«««
OKX:PYTHUSDT

H&SBig token unlock coming in about 10 days.
Release of 2.13 billion PYTH tokens which is more then half of the PYTH total supply in circulation. This can ad some sell pressure on the token
Head & shoulder pattern with a target of $2.6


PYTH/USDTPYTH potential impulse suggesting by a double bottom, chart idea comes from a hint giving by a bro. hope it plays well. #ayor
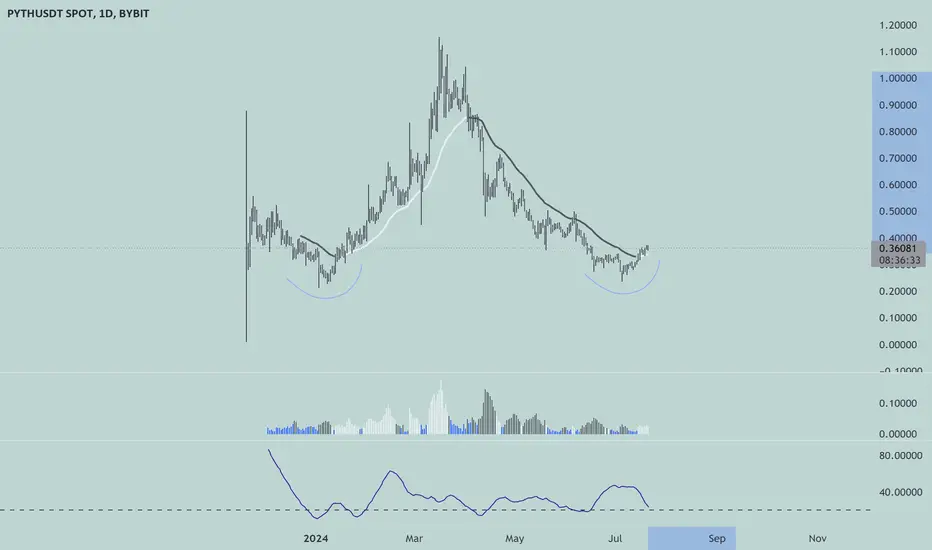
PYTH LONGWe formed double bottom, on daily chart we brok down trend and we enter at CTB. stop loss below weekly double bottom.