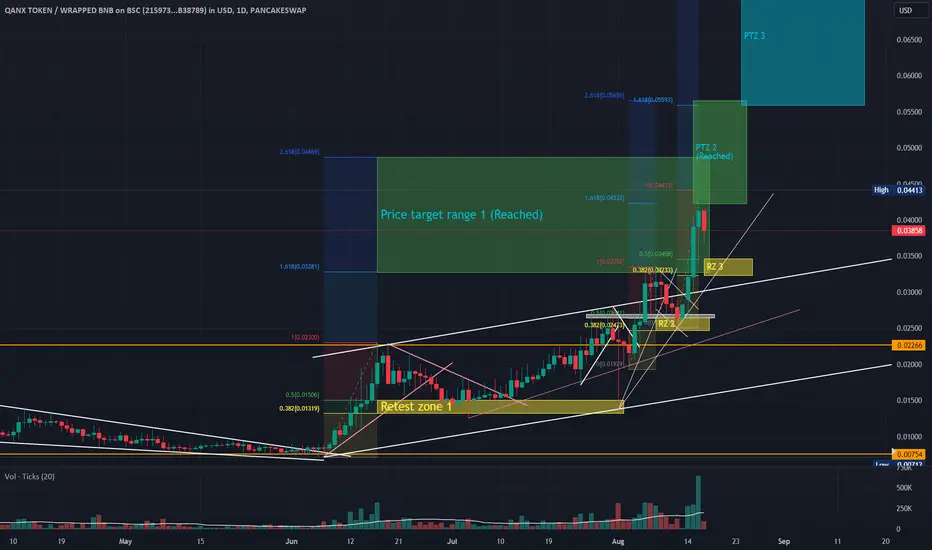
QANX weekly bullish wave hanging by a threadAfter two successful Fibonacci retracements on the daily chart QANX has lost support for the third wave up. However it has just performed a Fibonacci golden zone retest of a potential second wave up on the weekly chart.
0.02 - 0.022 was a potential buy zone, which - for now - seems to have triggered
Key stats
Trading activity
Transactions 84
BuysSells
4737
Volume 24.7 KUSD
Buys volumeSells volume
13.59 K11.11 K
Traders 57
BuyersSellers
3522
About QANXWBNB_215973.USD
Related DEX pairs
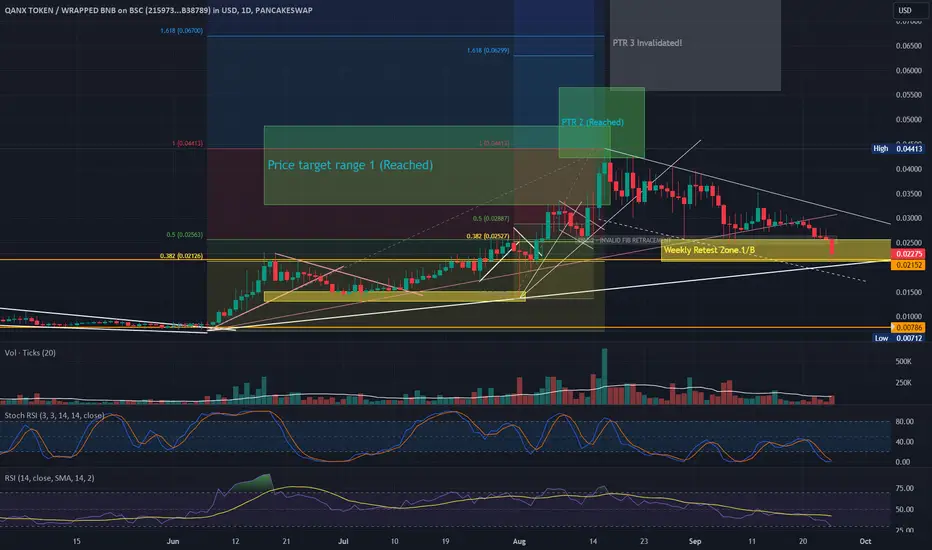
QANX waving upQANX the plenty-language, quantum-resistant blockchain dev environment has been soaring recently. This is a high-risk, low-volume, short-history crypto which makes technical analysis rather risky. Any bigger buy or sell order can move the price in technical-analysis-defying ways. So be aware of that
See all ideas
Summarizing what the indicators are suggesting.
Oscillators
Neutral
SellBuy
Strong sellStrong buy
Strong sellSellNeutralBuyStrong buy
Oscillators
Neutral
SellBuy
Strong sellStrong buy
Strong sellSellNeutralBuyStrong buy
Summary
Neutral
SellBuy
Strong sellStrong buy
Strong sellSellNeutralBuyStrong buy
Summary
Neutral
SellBuy
Strong sellStrong buy
Strong sellSellNeutralBuyStrong buy
Summary
Neutral
SellBuy
Strong sellStrong buy
Strong sellSellNeutralBuyStrong buy
Moving Averages
Neutral
SellBuy
Strong sellStrong buy
Strong sellSellNeutralBuyStrong buy
Moving Averages
Neutral
SellBuy
Strong sellStrong buy
Strong sellSellNeutralBuyStrong buy