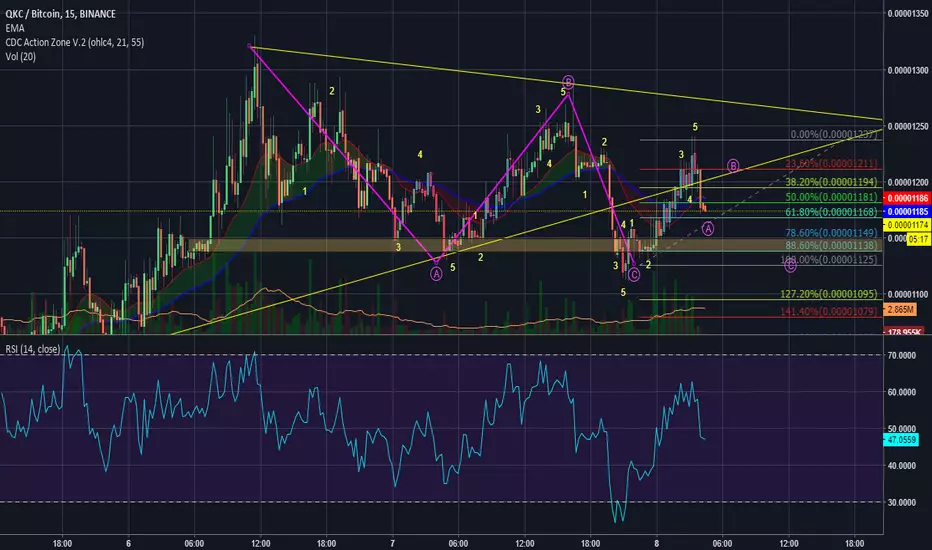
QKCBTCIt seems like bullish pennant to me. From this opportunity, let's earn some satoshis with very small risk :>
QKCBTC trade ideas
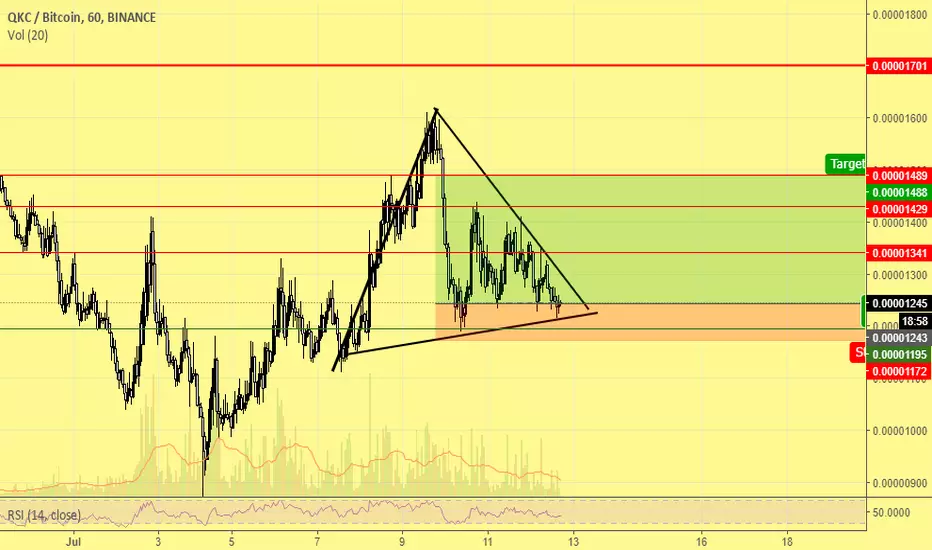

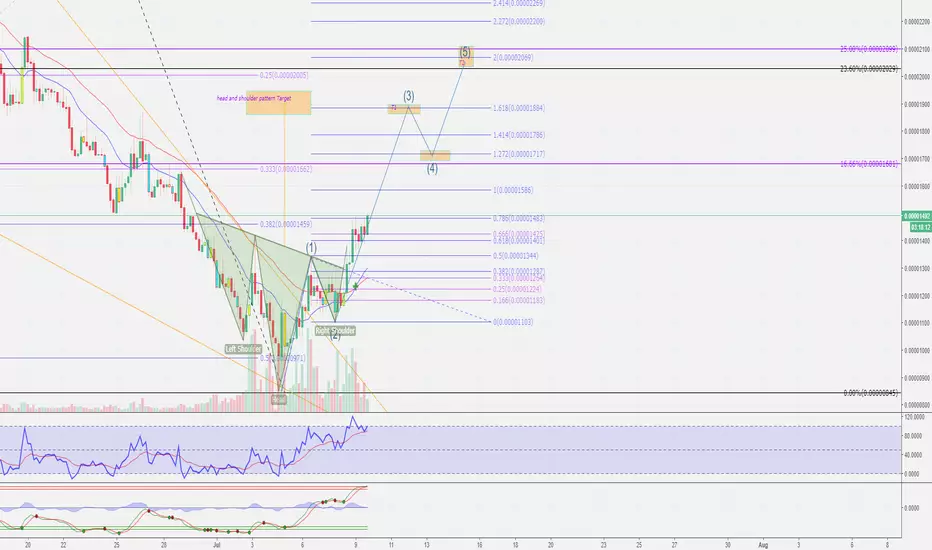
#QUARKCHAIN #BITCOIN #BITCOINPRICE #TRADINGPullback once the descending triangle broke down, that confirms the downtrend.
Right now price follows the ascending triangle so trend should be bullish.
Profit target:
- 1900 Sats
- 2151 Sats
- 2400 Sats


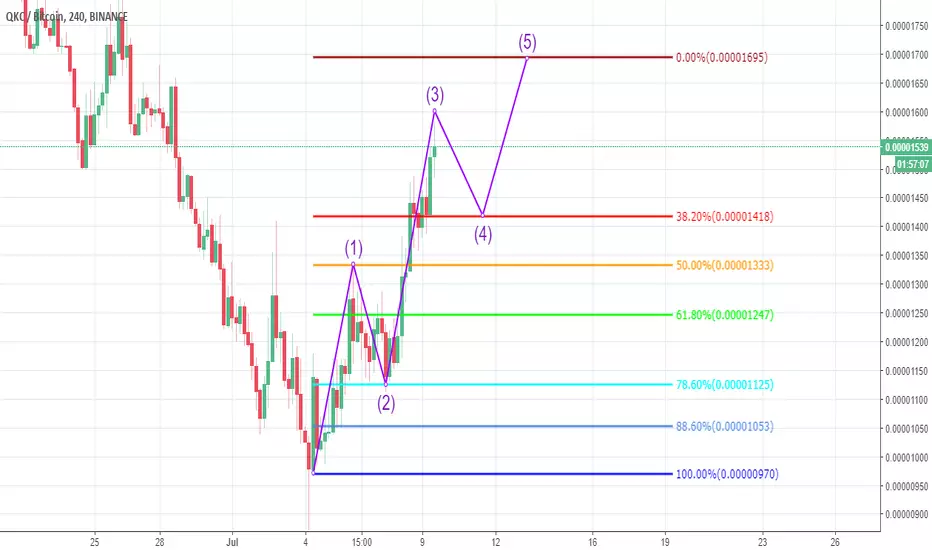
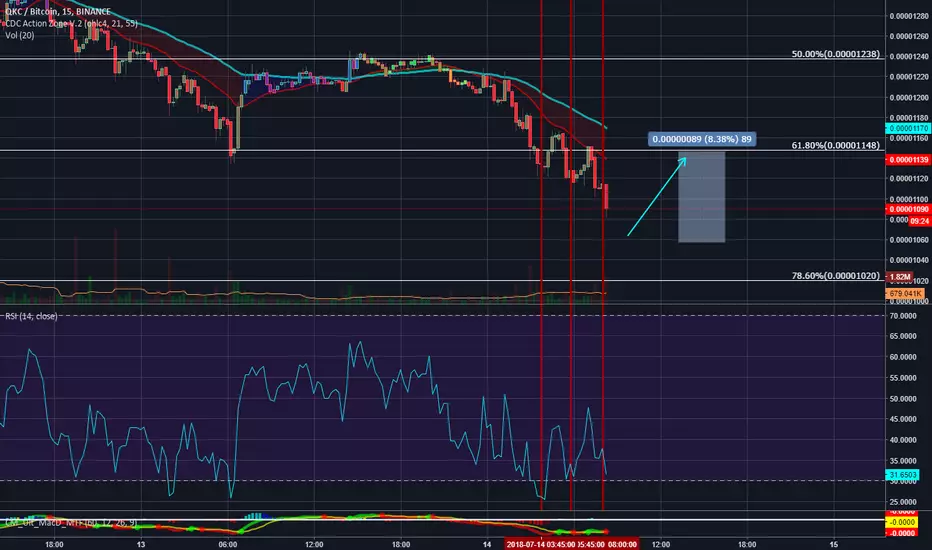
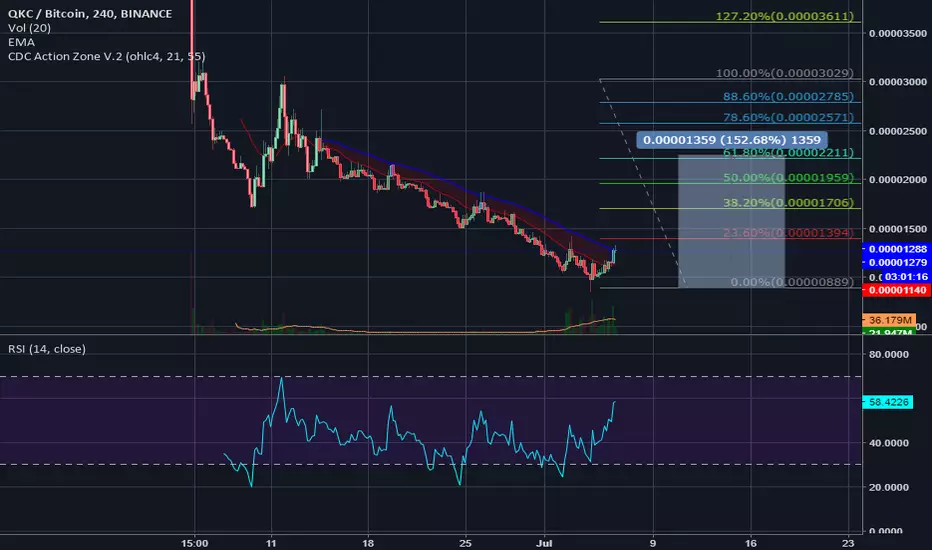
QKC , good time to buy some coins.hi guys, qkc is very cheap today, and he have all chances to start growth.
also MACD in good condition
buy 1050-1150
TP1 1350
TP2 1600
TP3 1800

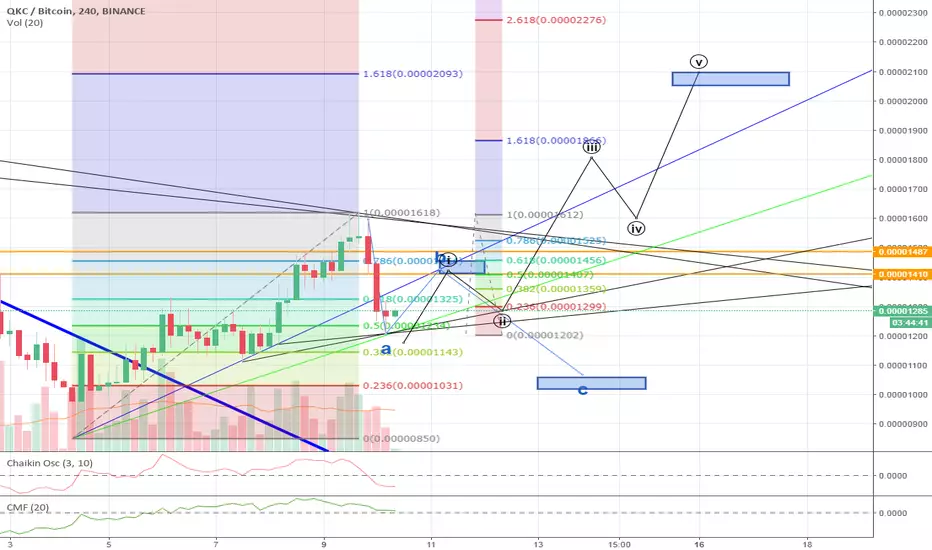
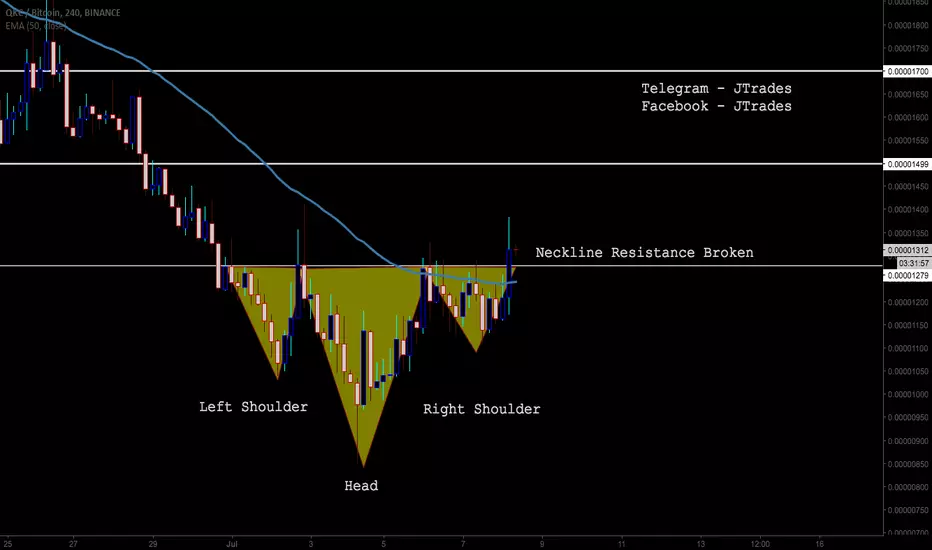
QKC/BTC 8 July 2018QKC was called in my premium signals service and has seen a profit of 17.7% to the top so far!
Inverse Head & Shoulders on the 4 hour time frame is quite a bullish formation and as you can see in prior coin analysis, is a favourite formation of mine.
You all can get in on this call now, I personally think this coin can do easily 300% As it has broken the overall downtrend it has been on since being released to binance. Extremely undervalued if you put aside some BTC for this one you can thank me later!
$QKC / $BTC - it is turning bullish. $QKC / $BTC - it is turning bullish.
Description: QuarkChain is a high-capacity peer-to-peer transactional system that consists of a two-layered blockchain - elastic sharding blockchains (shards) as the first layer, and a root blockchain that confirms the blocks from the shards as the second layer.
QKC is an ERC20 based token to be used solely as the primary token on the network.
Circulating Supply: 357,431,729
Total Supply: 10,000,000,000
Low Market cap
USD MarketCap: $29,187,196.00
Upcoming News & Events
Title: Testnet Launch
Date: 06 July 2018
Description: Public testnet planned to be launched on July 7th in Beijing with a live demo.
Title: Mainnet 1.0
Date: 31 December 2018 (or earlier)
Description: Mainnet 1.0 and Smart Wallet 1.0.
Title: QuarkChain Core 2.0
Date: 29 June 2019 (or earlier)
Description: QuarkChain core 2.0 and Smartwallet 2.0 release.

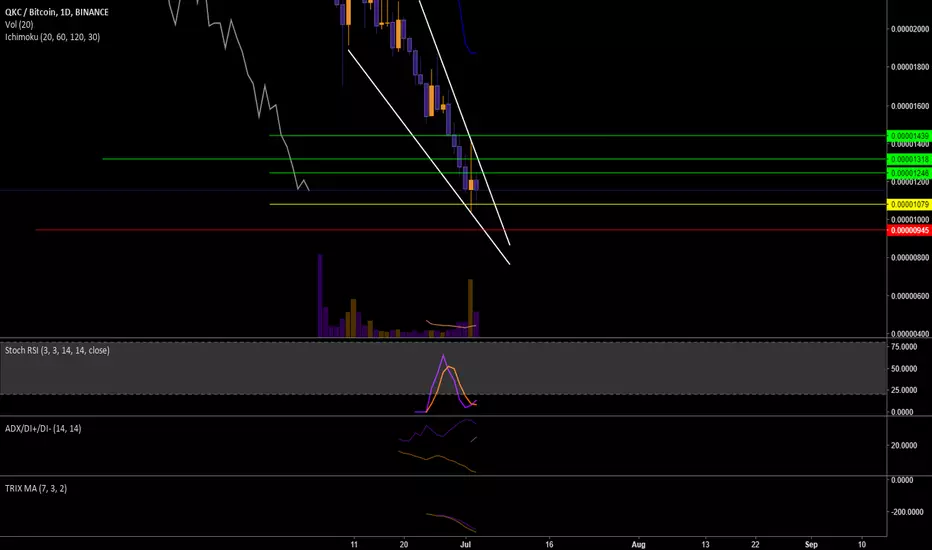

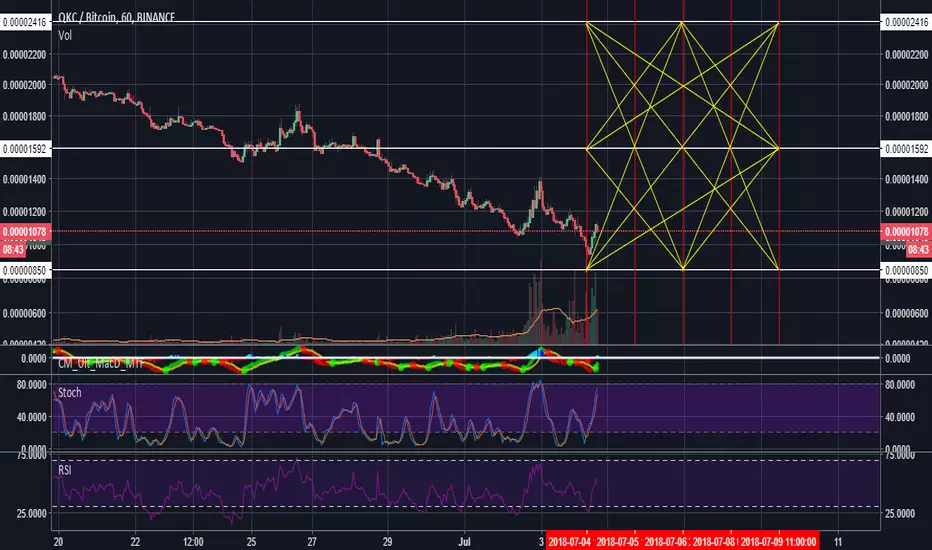
Bought some #QKC #QuarkChain - Probable Bottom & reversal?- Price going down along with decreased volume
- Then volume started to rise and price started to finally fight
- Probable bottom found and bought around this levels.
I'm aiming for that taking profit zones and their % relative to my entry point.

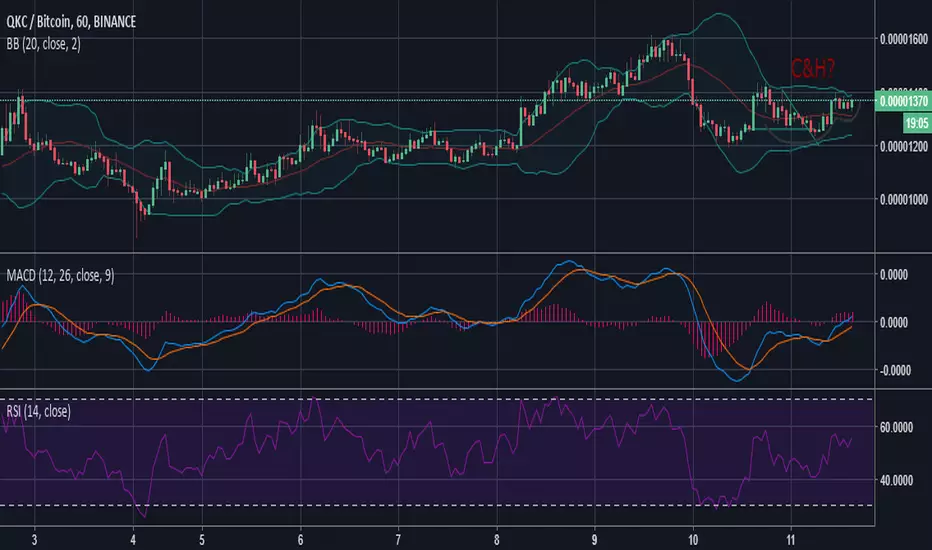
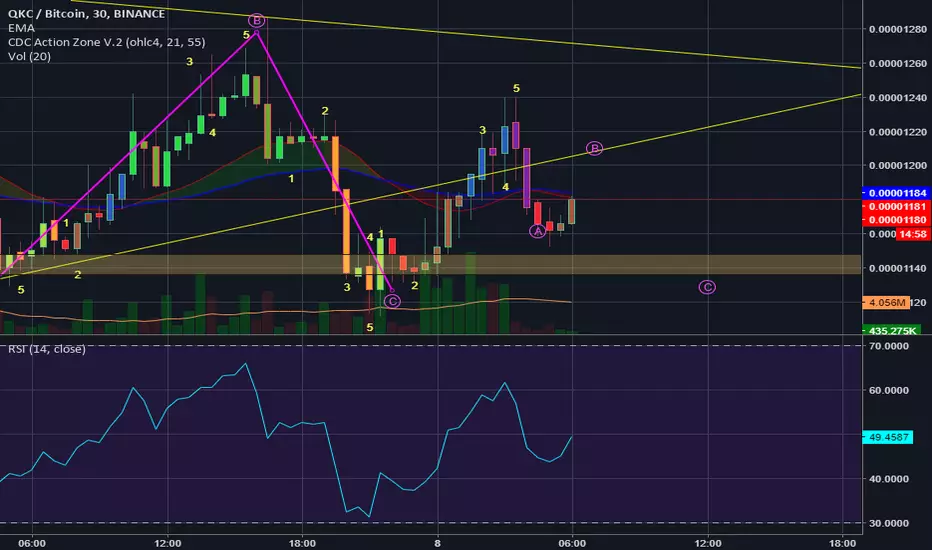
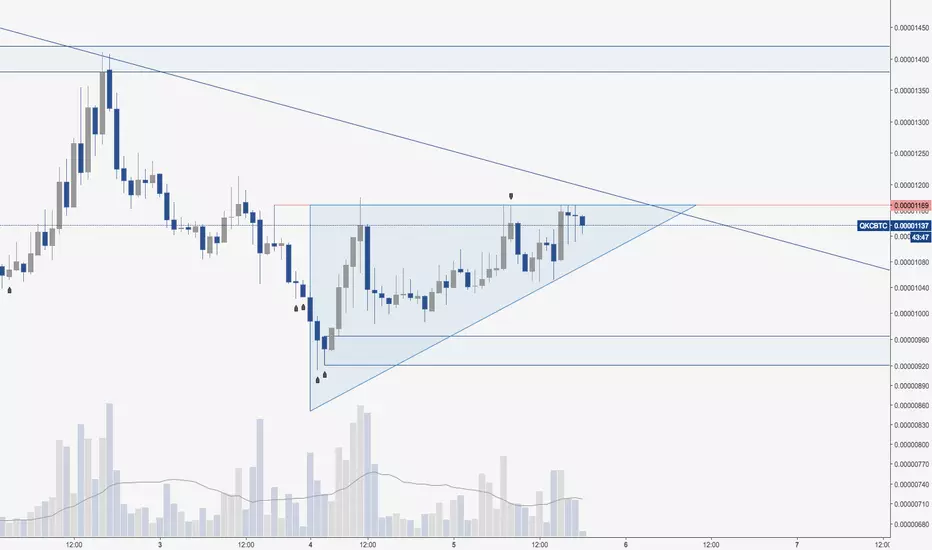
QKC - Ascending triangle and approaching potential breakout. $QKC is up 20% since entry.
1. Approaching long term descending resistance.
2. Ascending triangle (bullish) consolidating with higher lows towards 1169 (red line).
3. Wearing out the present supply zone.
Watching that line closely. Still holding 50% of position.
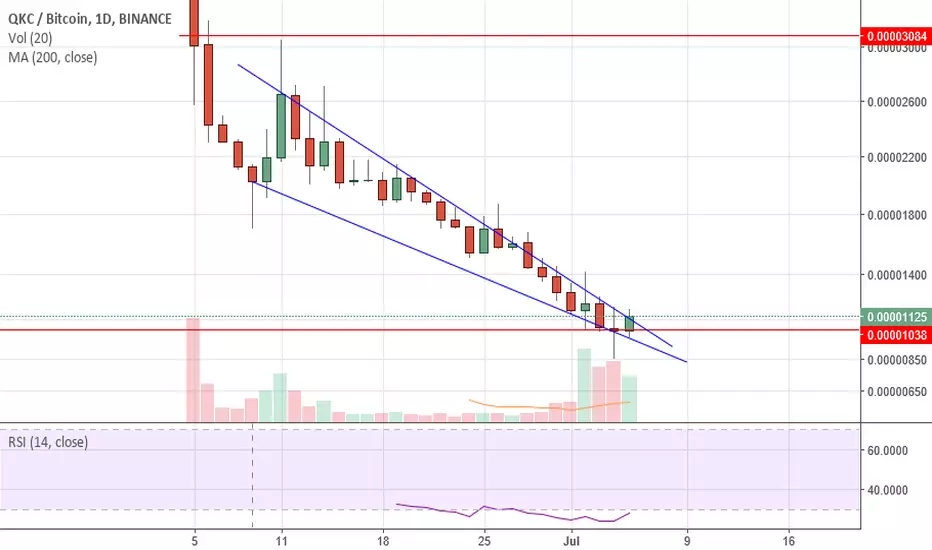
Long on QuarkchainAfter 30 days downhill we have testnet in less than 36 hours. Testnet is due for 07. July China time
TA show several very strong bullish indicator:
1. Morning star reversal candle on Daily chart
2. Falling vedge which is prepared to breakout
3. High volume
4. RSI still oversold and turning around
BUY and hold
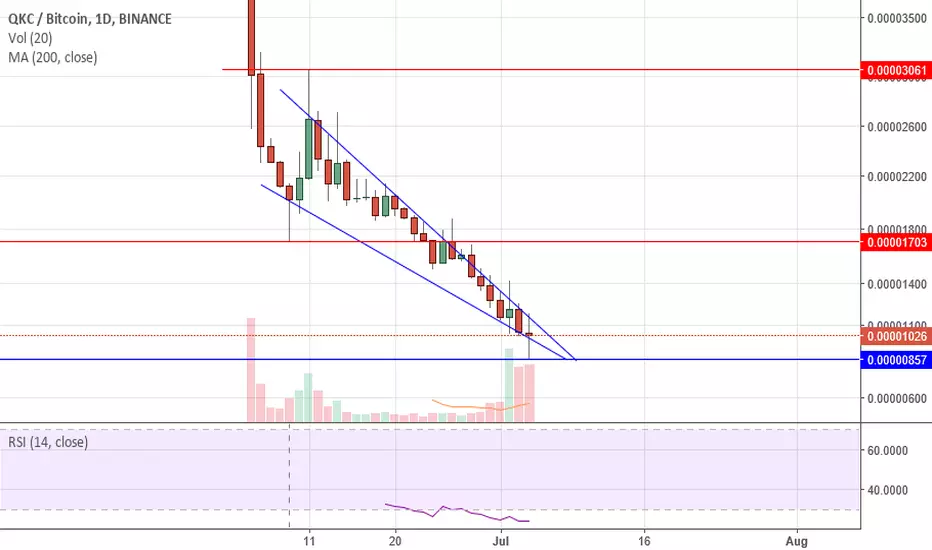
Doji reversal, fallng vedge - bullishFor those who wanna wait breakout oke - wait the breakout, and for those who understand what is doji, falling vedge and oversold - strong buy.
qkc whats next , to the moon ?? !!!not a financial advice , like if you find it good
target 1 - 1600 sats
target 2 - 1800 sats
target 3- 2000 sats
