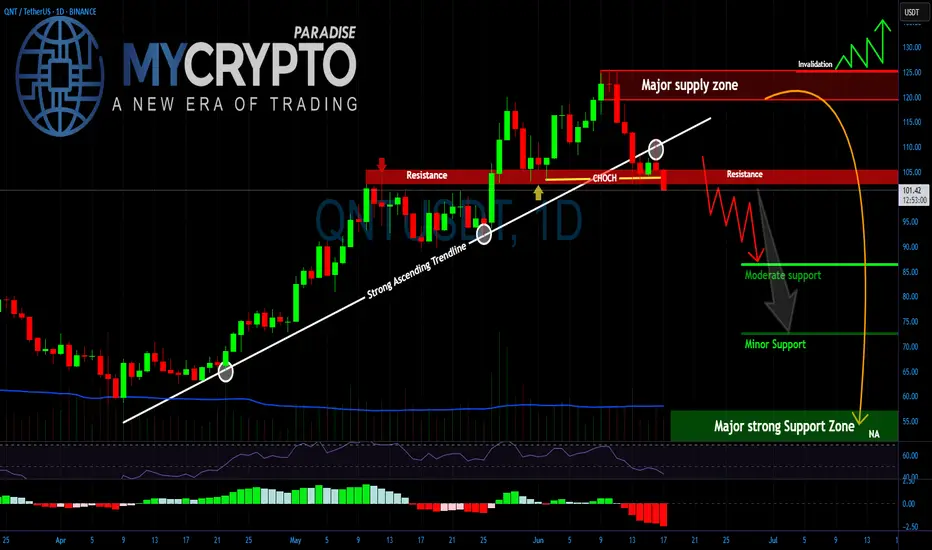
QNT Is Breaking Down — Are You ReadyYello Paradisers, Have you seen what just happened with #QNTUSDT? After weeks of grinding higher, the structure has cracked and that crack could turn into a landslide if you're not ready. This isn’t the time for hope or guesswork. It's the time for strategy.
💎#Quant has broken below a major ascend
QNT Accumulating Under Resistance — Big Move Ahead?QNT is showing strength, but a key test lies ahead.
After breaking out of its previous downtrend (red line), QNT has formed a strong rising structure supported by the blue trendline.
The price is currently consolidating just below the key resistance zone, attempting to gather momentum. This is a c

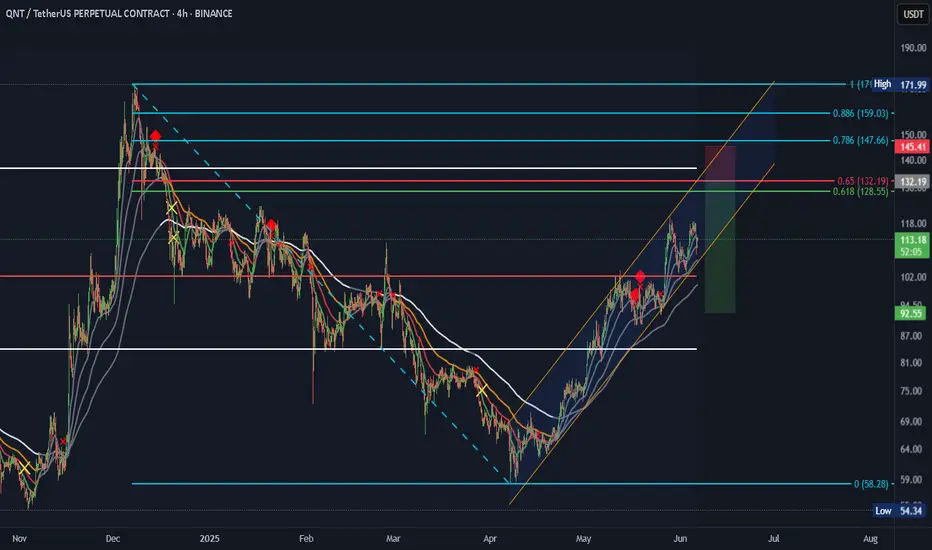
QNT SHORT SETUP QNT SHORT SETUP
ENTRY : 132.19
PROFIT : 92.55
STOP : 145.41
ALL trading ideas have entry point + stop loss + take profit + Risk level.
hello Traders, here is the full analysis for this pair, let me know in the comment section below if you have any questions, the entry will be taken only if all rule
QNT - FVG Long Set-UPBINANCE:QNTUSDT
🔍 𝐊𝐞𝐲 𝐙𝐨𝐧𝐞𝐬:
Support Zone (Demand): $96.17–$102.98 (green box)
Former resistance turned support.
Aligns with ascending trendline – a critical confluence zone.
𝐒𝐭𝐨𝐩-𝐋𝐨𝐬𝐬 𝐋𝐞𝐯𝐞𝐥: $88.77
Below structural low and invalidation of bullish thesis.
Target Zone (Resistance): $120.16
P

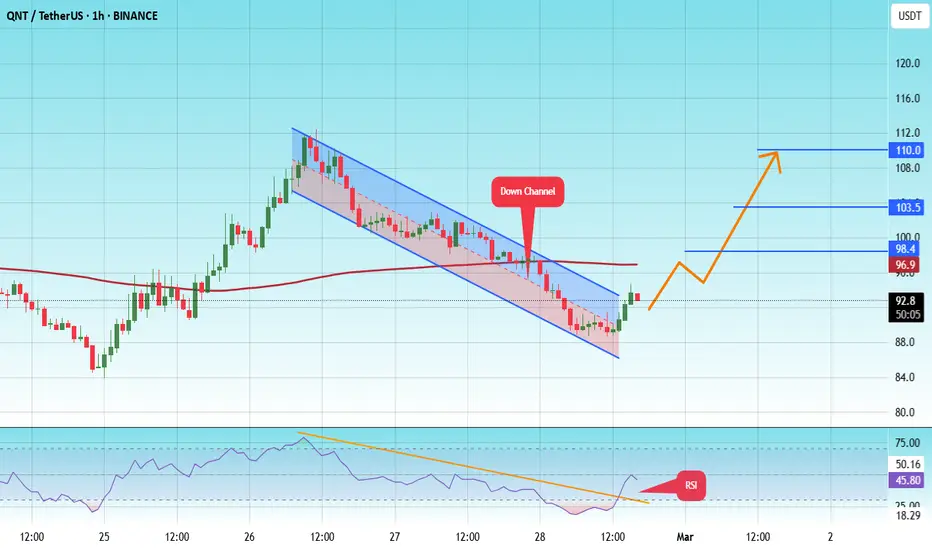
#QNT/USDT#QNT
The price is moving in a descending channel on the 1-hour frame and is expected to continue upwards
We have a trend to stabilize above the moving average 100 again
We have a descending trend on the RSI indicator that supports the rise by breaking it upwards
We have a support area at the low
QNTUSDT | Attractive Zone, But Buyer Strength Still LackingQNTUSDT left behind a clean demand zone on its way up, and that area could offer a decent long opportunity with the right confirmation.
However, if you ask for my broader view, I’m still cautious. Buyers haven’t proven enough strength yet. CDV isn’t convincing, and order flow lacks aggression.
Tha

QNT Buy the dip. Buy the dip. Target for cycle 666 if we go big :) new all time high would be T1
Should be up from next month for true alt szn
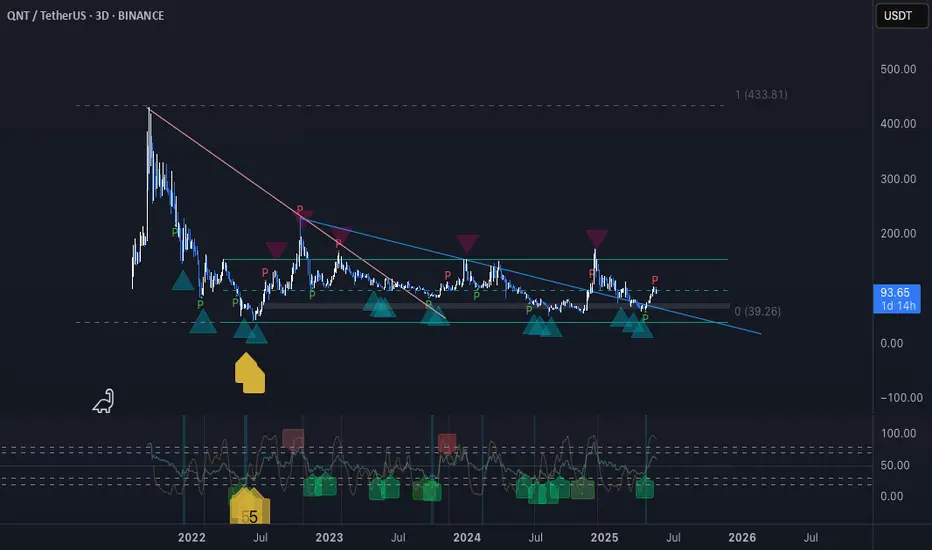
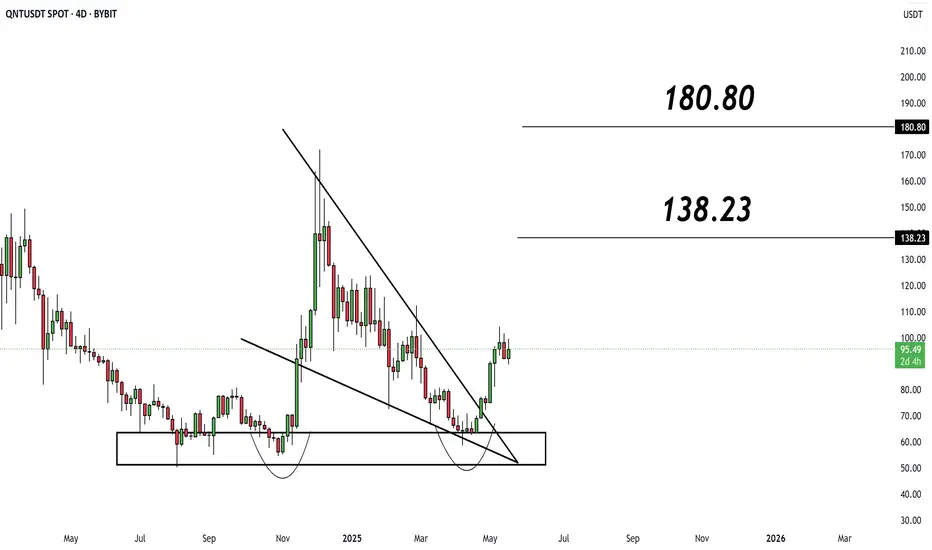
Technical Analysis for QNT/USDT – 4D Chart
The chart shows a classic Double Bottom pattern formed within a strong support zone between $70–$80, followed by a bullish breakout from a Falling Wedge – a reliable reversal pattern.
✅ Technical Highlights:
✅ Falling Wedge Breakout: A bullish breakout confirms momentum shift.
✅ Current Price: $9
QNTUSDT 2D AnalysisQNT ~ 2D Analysis
#QNT Buy on retesting this support block or buy after successfully breaking this resistance line with a short term target of at least 10%+.

QNTUSDT UPDATE
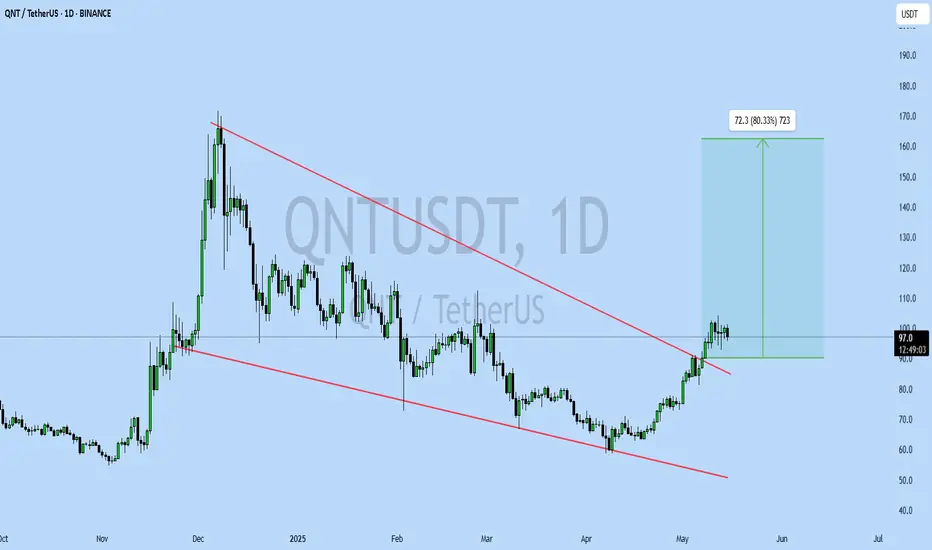
Pattern: Falling Wedge Breakout
Current Price: \$97.0
Target Price: \$160
Target % Gain: 80.33%
Technical Analysis: QNT has broken out of a falling wedge pattern on the daily chart, showing strong bullish momentum. Price retested the breakout zone around \$90 and is now consolidating near \$97,
See all ideas
Summarizing what the indicators are suggesting.
Oscillators
Neutral
SellBuy
Strong sellStrong buy
Strong sellSellNeutralBuyStrong buy
Oscillators
Neutral
SellBuy
Strong sellStrong buy
Strong sellSellNeutralBuyStrong buy
Summary
Neutral
SellBuy
Strong sellStrong buy
Strong sellSellNeutralBuyStrong buy
Summary
Neutral
SellBuy
Strong sellStrong buy
Strong sellSellNeutralBuyStrong buy
Summary
Neutral
SellBuy
Strong sellStrong buy
Strong sellSellNeutralBuyStrong buy
Moving Averages
Neutral
SellBuy
Strong sellStrong buy
Strong sellSellNeutralBuyStrong buy
Moving Averages
Neutral
SellBuy
Strong sellStrong buy
Strong sellSellNeutralBuyStrong buy
Displays a symbol's price movements over previous years to identify recurring trends.
Curated watchlists where QNTUSDT.P is featured.

Interoperability Crypto: Communication station
14 No. of Symbols
See all sparks