QNT Waking Up? The Sleeping Giant Eyes $160+Summary
Quant (QNT) remains in a multi-year accumulation range" since its 2021 cycle top. The asset shows textbook signs of liquidity engineering, and the next decisive move hinges on structural breaks above key price levels. Institutional momentum is quietly building beneath the surface, supported by both technical and fundamental factors.
Macro Structure & Price Context
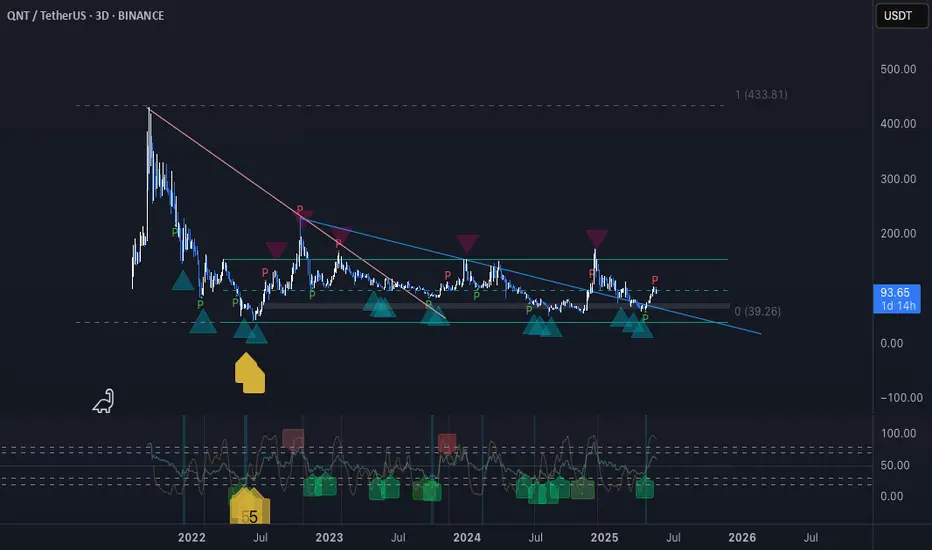
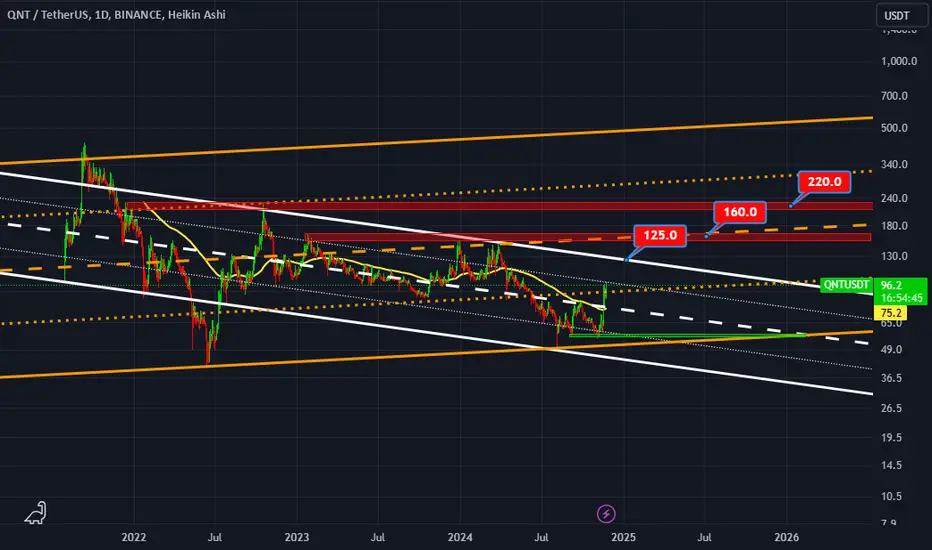
QNT's price action has respected a clear horizontal accumulation zone between $56 and $160 since 2021. The range has repeatedly swept liquidity both above and below key horizontal levels, signaling methodical accumulation by larger entities. This behavior aligns with institutional patterns where liquidity is engineered prior to expansion phases.
The Fibonacci retracement levels from the previous bull market cycle illustrate confluence with price action:
0.382 retracement aligns near current accumulation.
0.618 - 0.786 retracements ($260-$280) serve as long-term targets where liquidity inefficiencies remain unmitigated.
The $160 level is especially critical, as historical rejections confirm its role as a structural ceiling within this macro range. A successful breakout would shift the asset into price discovery towards $200-$280.
Mid-Term Structure & Momentum Indicators
Cup & Handle Formation (4H / Daily)
A well-formed cup & handle structure has emerged on the 4-hour and daily timeframes, signaling potential bullish continuation. The handle portion is consolidating above $104-$113, which has flipped from resistance to potential support.
Golden Cross (Daily)
A golden cross between the EMA 50 and EMA 200 on the daily chart further strengthens the bullish bias, marking a potential shift into a sustained uptrend.
Liquidity Sweep & Reaction
Recent price action filled a FVG zone at $85, sweeping liquidity and rebounding with strength. This move suggests the lower bound liquidity has been harvested and may no longer attract price in the near term.
Liquidity & Volume Pressure Zones
Order book depth indicates significant unexplored price action above $110.
Liquidity clusters and volume profiles suggest minimal resistance between $110 and $130, with price requiring acceptance above $110 to justify exploration beyond $130 and $160.
Above $130: Clearer path to $160.
Above $160: Opens inefficiencies towards $200-$280.
Liquidity & Momentum Zones
Above $130: Positive sentiment, confirms handle formation, increases probability of testing $160 again.
$160 Breakout: Structural shift from range-bound to trending. Opens doors to rapid liquidity grabs towards $200-$280.
Below $104: Reverts to bearish range-bound behavior, risks another sweep towards $85 and $56 liquidity pools.
$56: Ultimate liquidity grab zone if macro conditions worsen (unlikely in current market).
Fundamental & Macro Drivers
Regulatory Tailwinds
QNT's alignment with ISO 20022 and emerging CBDC infrastructure positions it as a compliant, institutional-grade token.
EU partnerships and banking adoption continue to solidify its fundamental narrative.
US Crypto Strategy
The US is aggressively positioning itself as a global crypto hub.
Regulatory clarity and institutional interest support compliant assets like QNT.
Market Environment
BTC dominance is declining, suggesting capital rotation into altcoins is near.
Historical patterns show sub-60% BTC.D aligns with altseason triggers.
Altcoin ignition phases typically follow periods like the current, where BTC sustains ATH and dominance contracts.
Geopolitical Developments
Tariff adjustments and easing global tensions free capital for risk-on assets.
Increased cross-border financial innovation benefits QNT's positioning.
Conclusion & Institutional Perspective
QNT is postured for a late-stage accumulation breakout. Institutional players are likely targeting the inefficiencies left in the $200-$280 zone. The presence of a strong macro structure, clear liquidity engineering, and aligning fundamentals in both EU regulation and US market positioning make this asset attractive.
The path of least resistance, provided BTC continues to hold above its ATH and dominance slides, points towards an eventual breakout of $160. Above this level, QNT’s inefficiencies demand mitigation, and the $280 magnet is a realistic mid-term institutional target.
Risk below $104 remains, but structurally the asset favors upside as long as it respects the $130 area and BTC dominance trends lower.
QNTUSDT.P trade ideas
QNT/USDT - massive boxQNT/USDT is printing one of the most classic textbook patterns a massive box range that has developed over the past 1000 days. This type of long-term consolidation typically leads to explosive moves once the breakout occurs, and historically, box patterns of this scale rarely fail when confirmed.
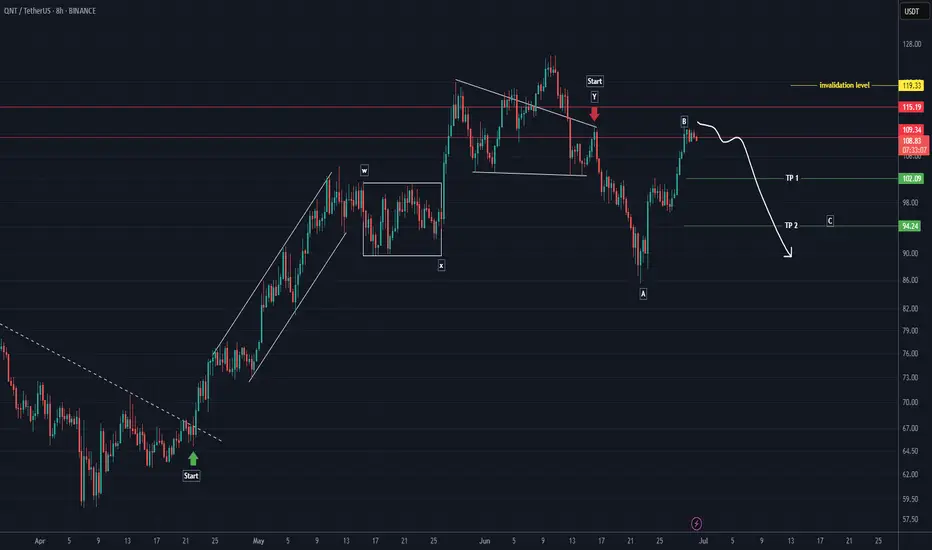
QNT Analysis (8H)From the point where we placed the red arrow on the chart, it seems that NEIRO’s correction has begun.
This correction appears to be a diagonal (diametric) pattern, and we are currently at the end of wave F.
Wave G could complete within the green zone, where we can look for a Rebuy setup.
The targets are marked on the chart.
If a daily candle closes below the invalidation level, this analysis will be invalidated.
For risk management, please don't forget stop loss and capital management
When we reach the first target, save some profit and then change the stop to entry
Comment if you have any questions
Thank You
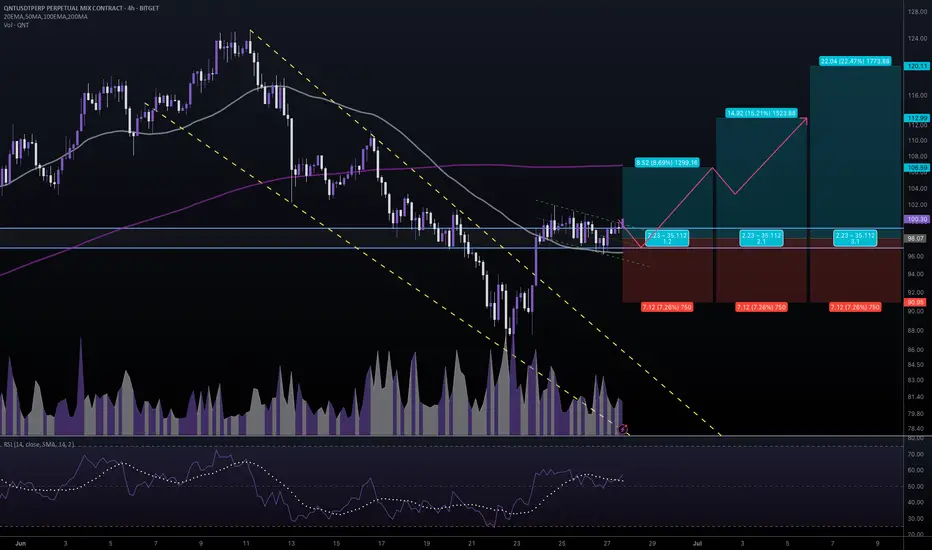
#QNTUSDT #4h (Bitget Futures) Bull flag near breakoutQuant regained 50MA support after breaking out of the falling wedge, bullish continuation seems likely.
⚡️⚡️ #QNT/USDT ⚡️⚡️
Exchanges: Bitget Futures
Signal Type: Regular (Long)
Leverage: Isolated (6.0X)
Amount: 4.6%
Current Price:
100.30
Entry Zone:
99.22 - 96.92
Take-Profit Targets:
1) 106.59
2) 112.99
3) 120.11
Stop Targets:
1) 90.95
Published By: @Zblaba
GETTEX:QNT BITGET:QNTUSDT.P #4h #Quant #RWA quant.network
Risk/Reward= 1:1.2 | 1:2.1 | 1:3.1
Expected Profit= +52.1% | +91.3% | +134.8%
Possible Loss= -43.6%
Estimated Gaintime= 1-2 weeks
QNTUSDT | Attractive Zone, But Buyer Strength Still LackingQNTUSDT left behind a clean demand zone on its way up, and that area could offer a decent long opportunity with the right confirmation.
However, if you ask for my broader view, I’m still cautious. Buyers haven’t proven enough strength yet. CDV isn’t convincing, and order flow lacks aggression.
That said, this week started with noticeable buyer presence across the board. If that momentum spills into QNTUSDT, this zone might hold and push price higher.
It’s early for full conviction, but not a bad place for a calculated entry — as long as risk is controlled.
📌I keep my charts clean and simple because I believe clarity leads to better decisions.
📌My approach is built on years of experience and a solid track record. I don’t claim to know it all but I’m confident in my ability to spot high-probability setups.
📌If you would like to learn how to use the heatmap, cumulative volume delta and volume footprint techniques that I use below to determine very accurate demand regions, you can send me a private message. I help anyone who wants it completely free of charge.
🔑I have a long list of my proven technique below:
🎯 ZENUSDT.P: Patience & Profitability | %230 Reaction from the Sniper Entry
🐶 DOGEUSDT.P: Next Move
🎨 RENDERUSDT.P: Opportunity of the Month
💎 ETHUSDT.P: Where to Retrace
🟢 BNBUSDT.P: Potential Surge
📊 BTC Dominance: Reaction Zone
🌊 WAVESUSDT.P: Demand Zone Potential
🟣 UNIUSDT.P: Long-Term Trade
🔵 XRPUSDT.P: Entry Zones
🔗 LINKUSDT.P: Follow The River
📈 BTCUSDT.P: Two Key Demand Zones
🟩 POLUSDT: Bullish Momentum
🌟 PENDLEUSDT.P: Where Opportunity Meets Precision
🔥 BTCUSDT.P: Liquidation of Highly Leveraged Longs
🌊 SOLUSDT.P: SOL's Dip - Your Opportunity
🐸 1000PEPEUSDT.P: Prime Bounce Zone Unlocked
🚀 ETHUSDT.P: Set to Explode - Don't Miss This Game Changer
🤖 IQUSDT: Smart Plan
⚡️ PONDUSDT: A Trade Not Taken Is Better Than a Losing One
💼 STMXUSDT: 2 Buying Areas
🐢 TURBOUSDT: Buy Zones and Buyer Presence
🌍 ICPUSDT.P: Massive Upside Potential | Check the Trade Update For Seeing Results
🟠 IDEXUSDT: Spot Buy Area | %26 Profit if You Trade with MSB
📌 USUALUSDT: Buyers Are Active + %70 Profit in Total
🌟 FORTHUSDT: Sniper Entry +%26 Reaction
🐳 QKCUSDT: Sniper Entry +%57 Reaction
📊 BTC.D: Retest of Key Area Highly Likely
📊 XNOUSDT %80 Reaction with a Simple Blue Box!
📊 BELUSDT Amazing %120 Reaction!
📊 Simple Red Box, Extraordinary Results
📊 TIAUSDT | Still No Buyers—Maintaining a Bearish Outlook
📊 OGNUSDT | One of Today’s Highest Volume Gainers – +32.44%
I stopped adding to the list because it's kinda tiring to add 5-10 charts in every move but you can check my profile and see that it goes on..

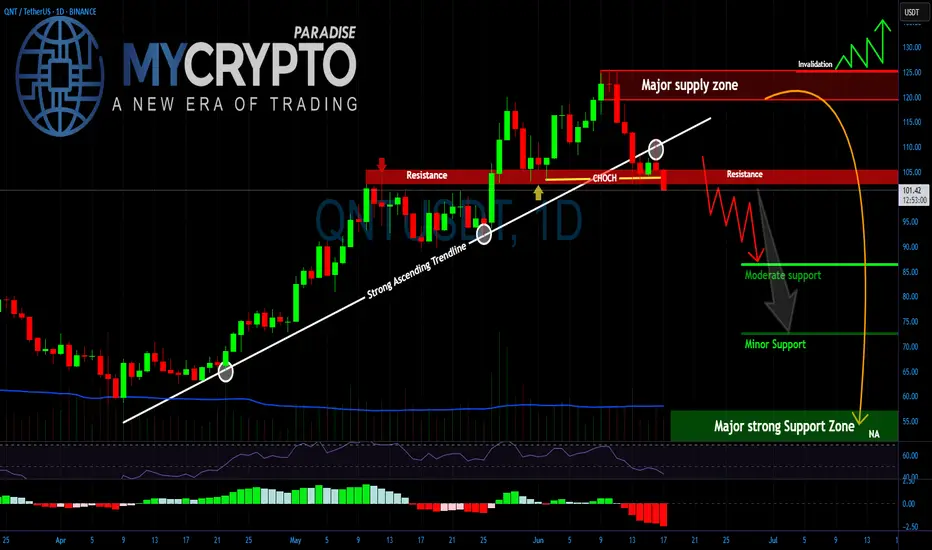
QNT Is Breaking Down — Are You ReadyYello Paradisers, Have you seen what just happened with #QNTUSDT? After weeks of grinding higher, the structure has cracked and that crack could turn into a landslide if you're not ready. This isn’t the time for hope or guesswork. It's the time for strategy.
💎#Quant has broken below a major ascending trendline that’s held since April, marking a pivotal shift in its momentum. The market just printed a clean Change of Character (CHoCH) around the $105–106 level, right at the confluence of a key support-turned-resistance zone. That CHoCH level, once a strong foundation for bullish continuation, has now flipped into a headwind. As long as the price stays below this range, we remain in the danger zone.
💎 Adding fuel to the fire is the major supply zone looming above, from $122 to $128. This area has already triggered rejection in the past and will now serve as the final invalidation for any short-term bullish dreams. A reclaim of this zone is highly unlikely in the near term, given the structure and momentum.
💎Now with the trendline cleanly broken and the market unable to hold higher lows, all eyes are on the lower support zones. The $85 region may provide a temporary cushion, but the real magnet lies deeper. We are closely watching the $72–75 area for signs of temporary relief, but the main high-probability reaccumulation zone is sitting all the way down at $55–60. This zone will likely attract smart money accumulation if the market gets there, it will not be by accident.
💎 This isn’t the time to be catching falling knives. Unless #QNT can reclaim the broken trendline and push back above the $106–110 range with conviction, the path of least resistance is down. That also means every lower high that prints now is an opportunity for trained eyes.
Stay ready. Stay focused. And always play the long-term game like a pro.
MyCryptoParadise
iFeel the success🌴
QNT Accumulating Under Resistance — Big Move Ahead?QNT is showing strength, but a key test lies ahead.
After breaking out of its previous downtrend (red line), QNT has formed a strong rising structure supported by the blue trendline.
The price is currently consolidating just below the key resistance zone, attempting to gather momentum. This is a classic sign of healthy price action — retesting higher levels while maintaining support.
As long as QNT holds the strong rising support line and the lower support zone, the bullish structure remains intact. A clear breakout above the resistance zone could trigger the next leg higher.
However, if price breaks below the rising support, we could see a pullback toward the lower zone for re-accumulation.
For now — it’s a wait and watch at the resistance. Bulls need to prove their strength.
DYOR, NFA

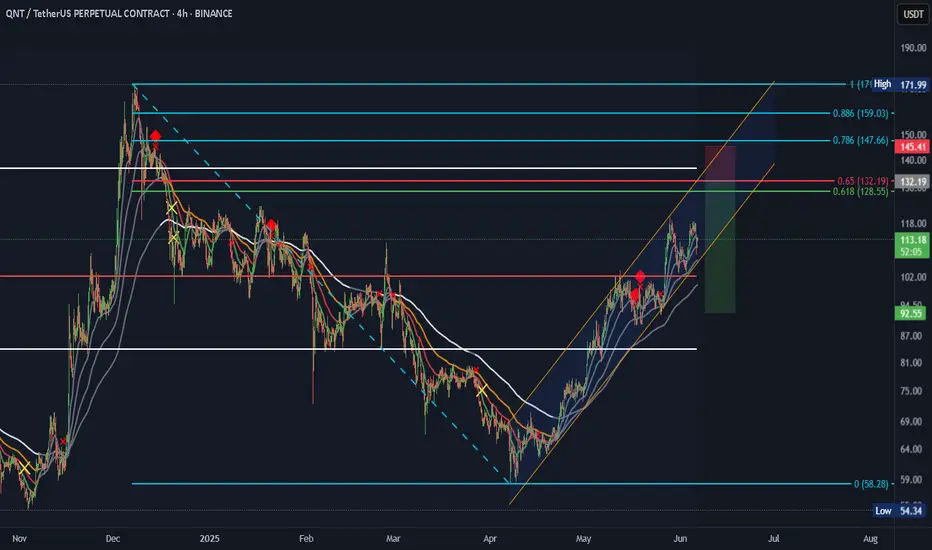
QNT SHORT SETUP QNT SHORT SETUP
ENTRY : 132.19
PROFIT : 92.55
STOP : 145.41
ALL trading ideas have entry point + stop loss + take profit + Risk level.
hello Traders, here is the full analysis for this pair, let me know in the comment section below if you have any questions, the entry will be taken only if all rules of the strategies will be satisfied. I suggest you keep this pair on your watchlist and see if the rules of your strategy are satisfied. Please also refer to the Important Risk Notice linked below.
Disclaimer
QNT - FVG Long Set-UPBINANCE:QNTUSDT
🔍 𝐊𝐞𝐲 𝐙𝐨𝐧𝐞𝐬:
Support Zone (Demand): $96.17–$102.98 (green box)
Former resistance turned support.
Aligns with ascending trendline – a critical confluence zone.
𝐒𝐭𝐨𝐩-𝐋𝐨𝐬𝐬 𝐋𝐞𝐯𝐞𝐥: $88.77
Below structural low and invalidation of bullish thesis.
Target Zone (Resistance): $120.16
Previous local high and psychological round numbe

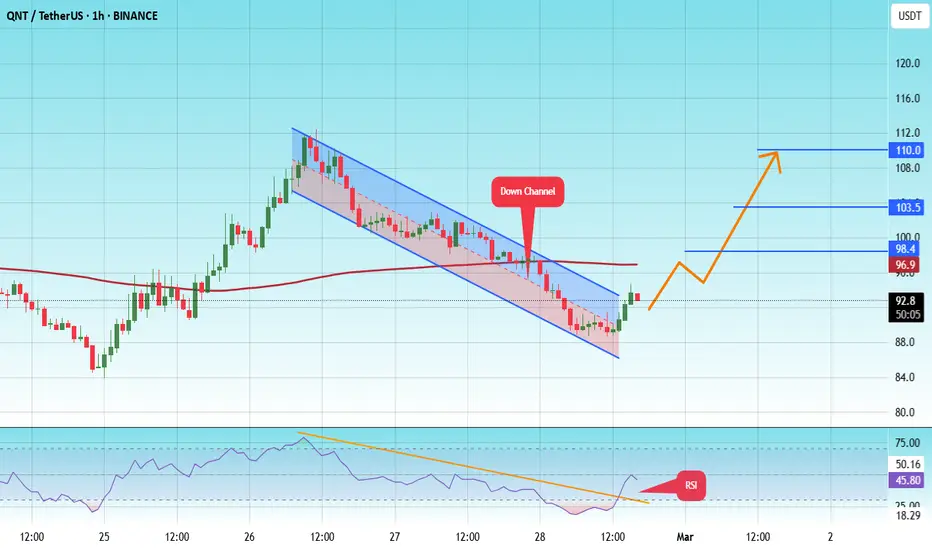
#QNT/USDT#QNT
The price is moving in a descending channel on the 1-hour frame and is expected to continue upwards
We have a trend to stabilize above the moving average 100 again
We have a descending trend on the RSI indicator that supports the rise by breaking it upwards
We have a support area at the lower limit of the channel at a price of 86
Entry price 92
First target 98
Second target 103
Third target 110
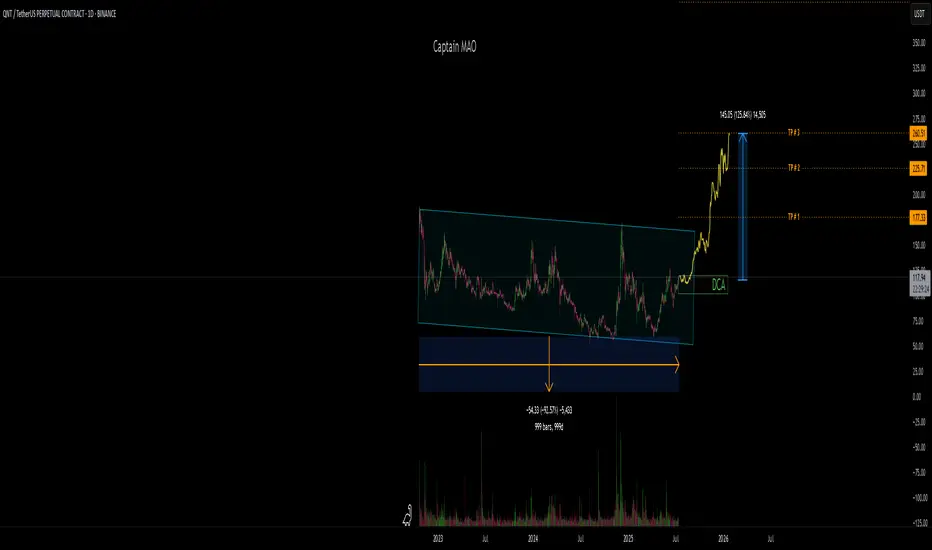
QNT Buy the dip. Buy the dip. Target for cycle 666 if we go big :) new all time high would be T1
Should be up from next month for true alt szn
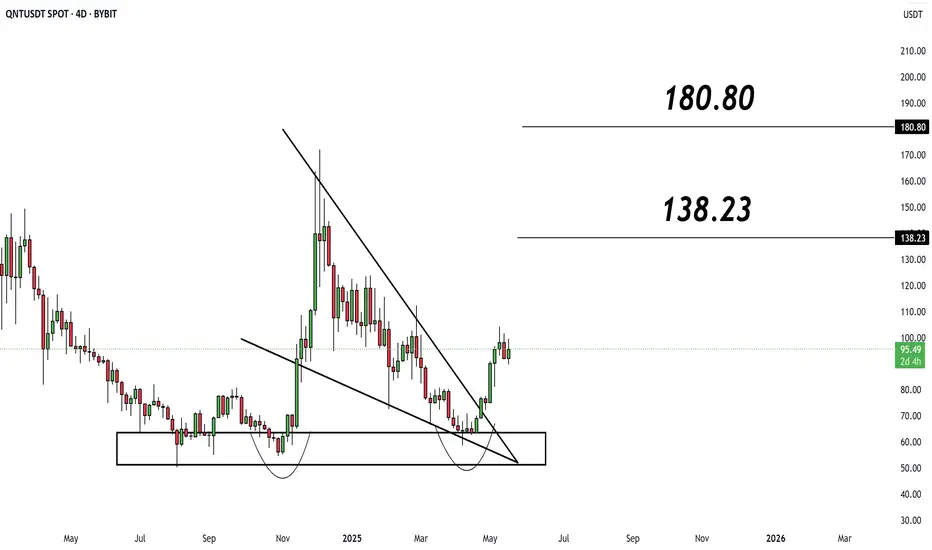
Technical Analysis for QNT/USDT – 4D Chart
The chart shows a classic Double Bottom pattern formed within a strong support zone between $70–$80, followed by a bullish breakout from a Falling Wedge – a reliable reversal pattern.
✅ Technical Highlights:
✅ Falling Wedge Breakout: A bullish breakout confirms momentum shift.
✅ Current Price: $94.51
✅ Strong Support Zone: $70–$80
✅ Clear upside targets are marked on the chart.
🎯 Potential Price Targets:
Target 1: $138.23
Target 2: $180.80
⚠️ Alternative Scenario:
If the price fails to hold above the $90–$94 range, we may see a retest of the $85–$80 area before any sustained upward movement.
💡 Conclusion:
QNT is showing strong reversal signals after a long accumulation phase. The breakout from the falling wedge pattern and reclaiming of key levels suggest a bullish momentum building toward higher targets. Holding above $90 is crucial for continuation.
QNTUSDT 2D AnalysisQNT ~ 2D Analysis
#QNT Buy on retesting this support block or buy after successfully breaking this resistance line with a short term target of at least 10%+.

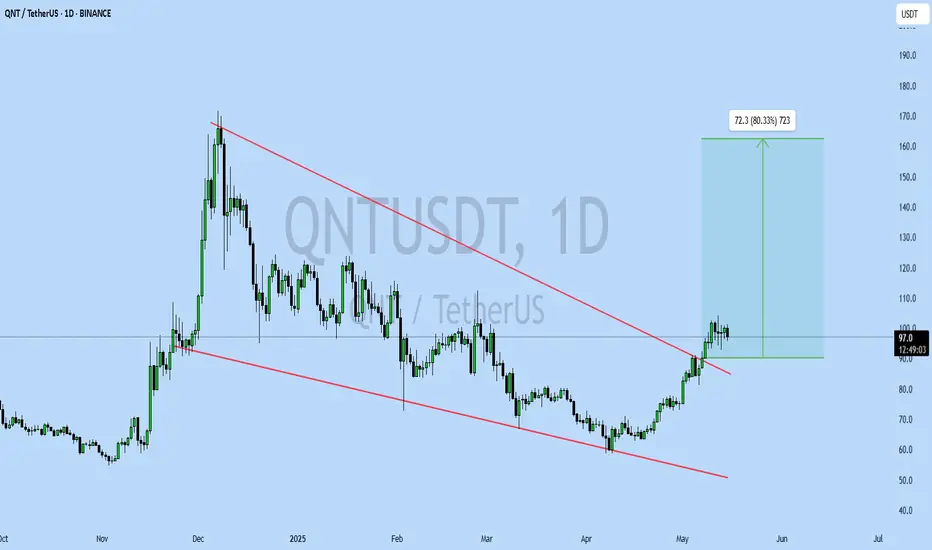
QNTUSDT UPDATE
Pattern: Falling Wedge Breakout
Current Price: \$97.0
Target Price: \$160
Target % Gain: 80.33%
Technical Analysis: QNT has broken out of a falling wedge pattern on the daily chart, showing strong bullish momentum. Price retested the breakout zone around \$90 and is now consolidating near \$97, suggesting potential continuation toward the \$160 target.
Time Frame: 1D
Risk Management Tip: Always use proper risk management.
TradeCityPro | QNT: Range Top Test in RWA Uptrend Structure👋 Welcome to TradeCity Pro!
In this analysis, I’m going to review the QNT coin — one of the RWA projects currently ranked 71 on CoinMarketCap with a market cap of $1.19 billion.
⏳ 4-Hour Timeframe
As you can see, there’s a clear uptrend along with a trendline that has pushed the price up to the 100.7 level.
💥 At the moment, the price has formed a range box between 93.1 and 100.7, with multiple touches on both ends. Currently, the price is testing the top of this range at 100.7 once again.
🔍 If the 100.7 resistance is broken, we can consider entering a long position. This trigger is valid for a long, and if confirmed, the price could potentially move toward the next target at 121.8.
✨ For a short position, we first need to see the trendline break and the 93.1 level get triggered. That would serve as our first confirmation of a possible trend reversal.
📉 A breakdown below the 50 level on the RSI would be the first momentum-based sign of this reversal. If selling volume also increases at the same time, we’ll have confirmation of a volume divergence.
⚡️ On the other hand, a break of the trendline itself might act as an early trigger, but I personally wouldn’t open a position on that alone — it’s too risky. As long as the price holds above 93.1, the overall uptrend remains intact.
📝 Final Thoughts
This analysis reflects our opinions and is not financial advice.
Share your thoughts in the comments, and don’t forget to share this analysis with your friends! ❤️

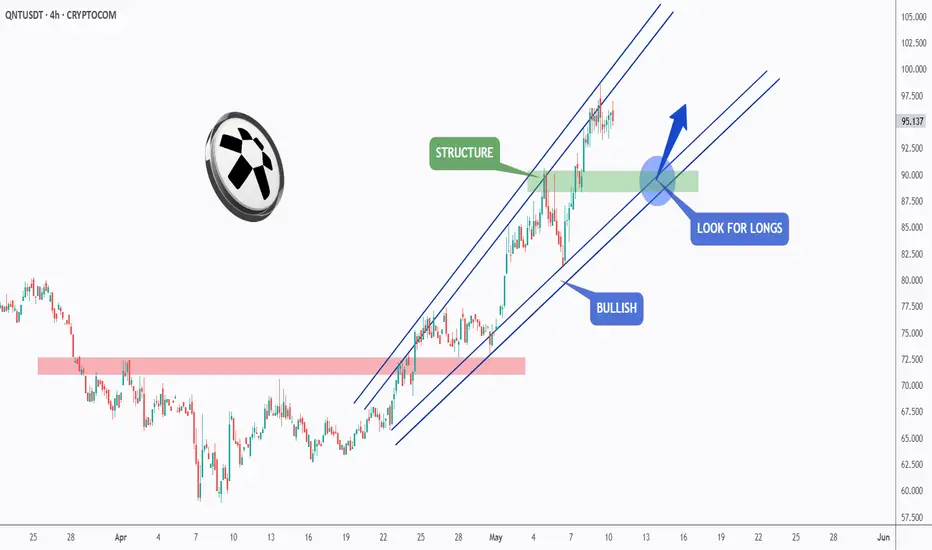
QNT - The Bulls are Leading!Hello TradingView Family / Fellow Traders. This is Richard, also known as theSignalyst.
📈After breaking above the last major high marked in red, QNT has been overall bullish trading within the rising wedge pattern marked in blue.
Moreover, the green zone is a strong demand and structure.
🏹 Thus, the highlighted blue circle is a strong area to look for buy setups as it is the intersection of structure and lower blue trendline acting non-horizontal support.
📚 As per my trading style:
As #QNT retests the blue circle zone, I will be looking for bullish reversal setups (like a double bottom pattern, trendline break , and so on...)
📚 Always follow your trading plan regarding entry, risk management, and trade management.
Good luck!
All Strategies Are Good; If Managed Properly!
~Rich
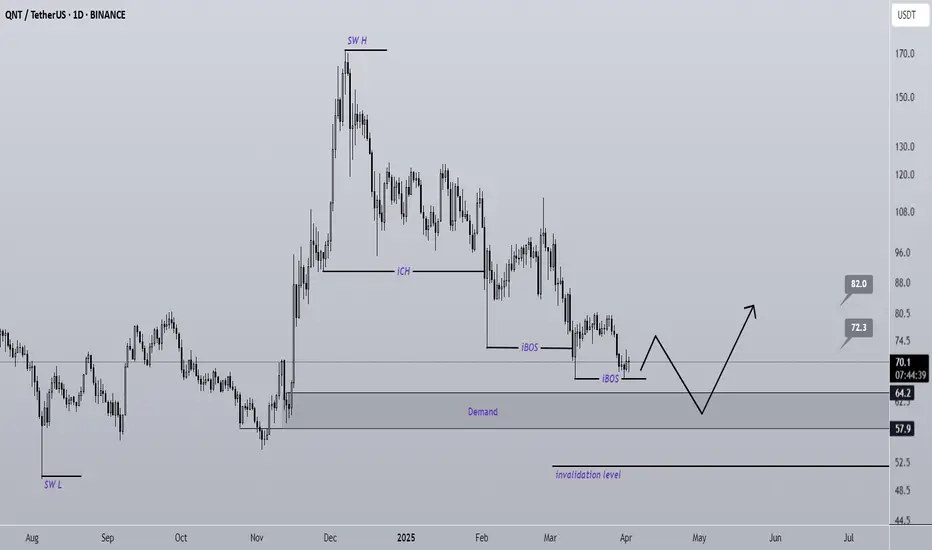
QNT is about to take off like a rocket soon (1D)The higher structure of QNT is bullish, but its internal structure has turned bearish.
Therefore, we can look for buy/long positions in fresh and unmitigated Demand zones.
Targets are marked on the chart.
A daily candle closing below the invalidation level will invalidate this analysis.
Do not enter the position without capital management and stop setting
Comment if you have any questions
thank you
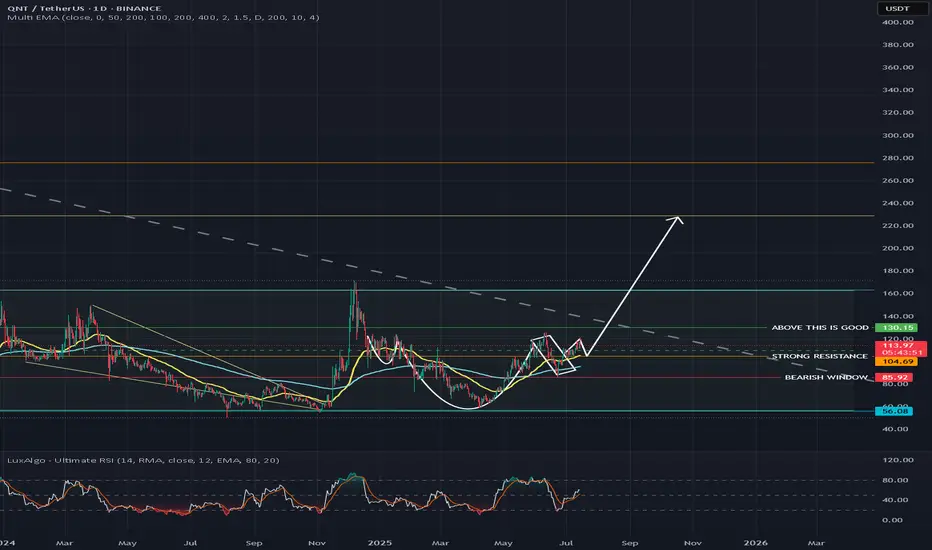
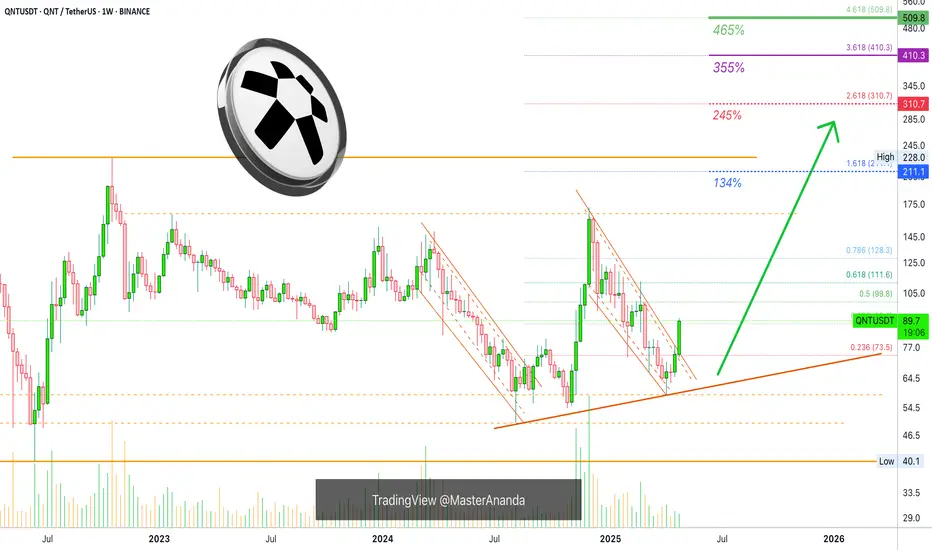
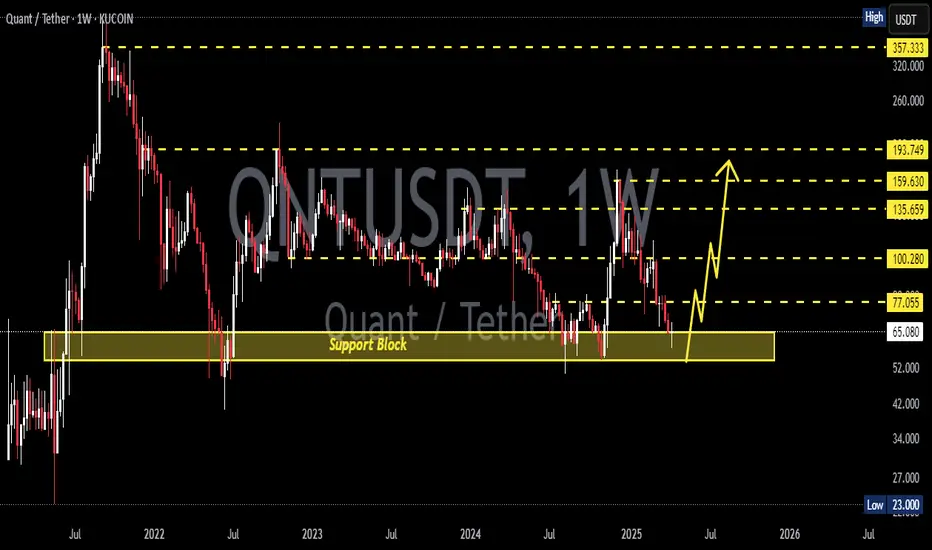
Quant's 2025 All-Time High Potential Revealed In This AnalysisQuant has been producing higher lows since June 2022, a solid base.
QNTUSDT is about to close its fourth week green and this week is a full green candle. A strong advance/bullish breakout and months of bearish action recovered to now trade within the bullish zone.
What is happening here is the same dynamic that will be happening across all the Altcoins. After a major low on 7-April we get growth, growth, growth. Allow for small swings because the market never moves straight down nor straight up, it fluctuates creating waves.
Down-waves, up-waves but something is certain, higher highs and higher lows long-term. We are now within a strong bullish phase.
The high in December 2024 produced the highest prices since October 2022 and was corrected to a long-term higher low. A higher high will happen next comes next and this is the beginning of this higher high. The easy target being $211 and this is a higher high but for this higher high to be technically relevant it has to go even higher so we are aiming for $230 or higher, $310.
Will Quant go beyond $310? It is possible and do-able, also highly probable. The $410 target is a strong target but can be done. Can I be honest with you? It is possible that Quant moves even higher producing a new All-Time High by the time the 2025 bull market runs its course.
Find more details on the chart.
Namaste.
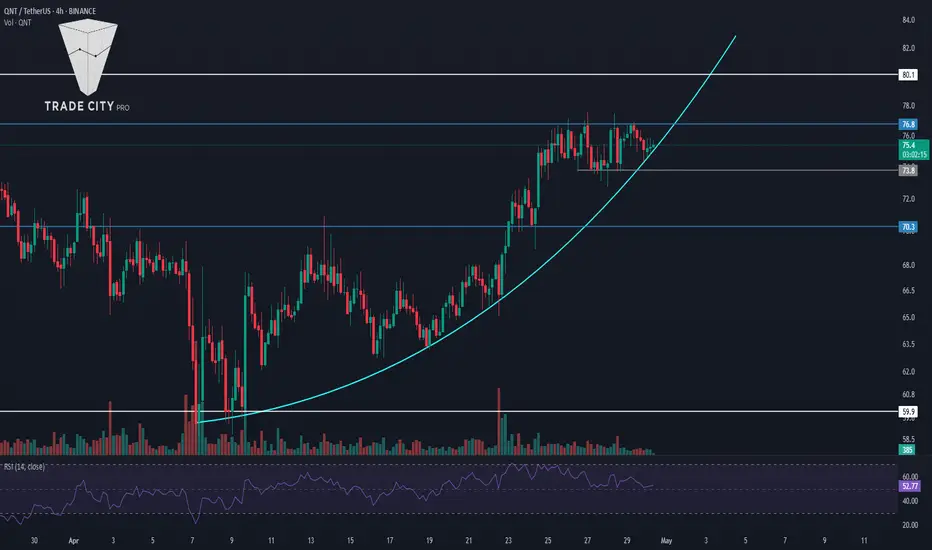
TradeCityPro | QNT: Ranging Near Key Resistance in RWA Favorite👋 Welcome to TradeCity Pro!
In this analysis, I want to review the QNT coin for you. This project is one of the RWA projects that has been heavily hyped in recent months.
✔️ Currently, this coin has a market cap of $908 million and ranks 72 on CoinMarketCap.
⏳ 4-Hour Timeframe
On the 4-hour timeframe, as you can see, there is an upward trend along with a curved trendline that has caused the price to move from the bottom of 59.9 to 76.8.
💫 After the price reached the resistance at 76.8, a ranging box has formed, and volume has also been decreasing. A temporary support bottom has formed at the 73.8 area, and the price is ranging between these levels.
📊 Now, with the ranging box that has formed, the price has reached the curved trendline, and this trendline can potentially lead to bullish momentum entering the market.
💥 On the other hand, the RSI oscillator is also on important support at the 50 level, and if the price is supported by this trendline, the RSI moves upward again, and volume increases, we can enter a long position with the breakout of 76.8.
🔍 An important point about this entry is that there is a very strong resistance at the 80.1 area, and if you enter a position on the breakout of 76.8, you probably won't see much profit until the price reaches 80.1.
🎲 So basically, the 76.8 trigger is a preliminary trigger for the breakout of 80.1, and if I open a position on the breakout of 76.8, I won’t close it at 80.1 and will wait to see if the price breaks through the 80.1 area or not. In my opinion, this position is worth the risk because if 80.1 breaks, a very large reward could result from this position.
🔽 But if you want to take less risk, you can wait and open your position with the breakout of 80.1 itself. Naturally, since this area is a major resistance and the entry point is higher than 76.8, opening a position at that level will be harder and the likelihood of getting a proper confirmation candle is lower than with 76.8.
📉 For a short position, if we want to get a trigger from the chart itself, considering the decreasing volume and price reaching the curved trendline, if this trendline breaks and the 73.8 trigger is activated, we can enter a position. RSI confirmation would also be the break of the 50 area, and with that break, we could also get momentum confirmation.
🔑 But the point is that we must also consider market conditions. For example, in the current market conditions, the overall trend of Bitcoin and indexes like Total and Total2 has been bullish in recent weeks, and we can’t get bearish confirmation from these indexes.
✨ So it's possible that with the break of 73.8, the price moves downward, but because the indexes I mentioned also affect altcoins, with the continuation of their bullish trend, the downtrend of QNT may come to an end and its trigger may become a fakeout. That's why it’s better to wait for Bitcoin and the indexes to confirm a trend reversal before looking for short triggers.
📝 Final Thoughts
This analysis reflects our opinions and is not financial advice.
Share your thoughts in the comments, and don’t forget to share this analysis with your friends! ❤️
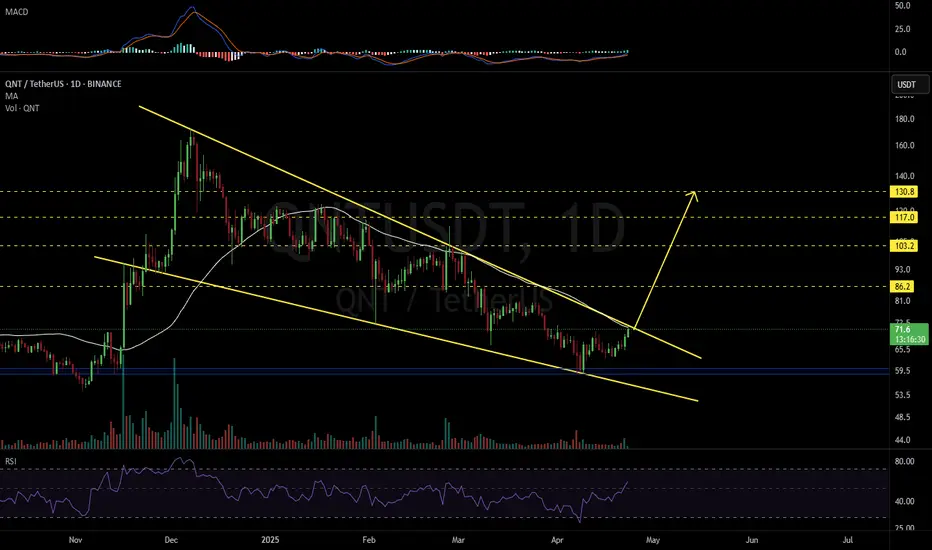
QNTUSDT 1D#QNT is on the verge of breaking out above the falling wedge pattern and the MA50 on the daily chart. In case of a breakout, the targets are:
🎯 $86.2
🎯 $103.2
🎯 $117.0
🎯 $130.8
⚠️ Use a tight stop-loss.
QNT - The best is yet to come!Looks like QNT has a long way ahead, though the major 125$ resistannce is crucial.
QNTUSDT 1WQNT ~ 1W Analysis
#QNT Buy gradually from here if you still have a Conviction on this coin with a short -term target of at least 15%+.
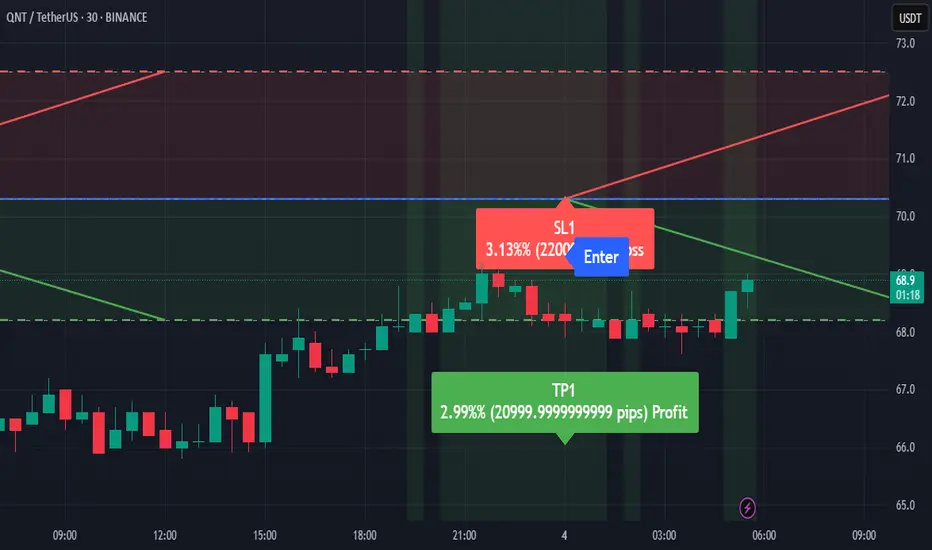
QNTUSDT Short Opportunity: Technical Pullback on the RadarMy analytical model based on EASY Trading AI strategy flags a potential bearish move for QNTUSDT. Current market conditions support a short position entry at 70.3. Why bearish? Price action displays weakening bullish momentum, indicating sellers might retake control. Clear bearish indicators show a target (Take Profit) at 68.2. To protect the position, setting a Stop Loss barrier at 72.5 is essential. Trade actively, keep risks managed, and stay alert to market shifts.