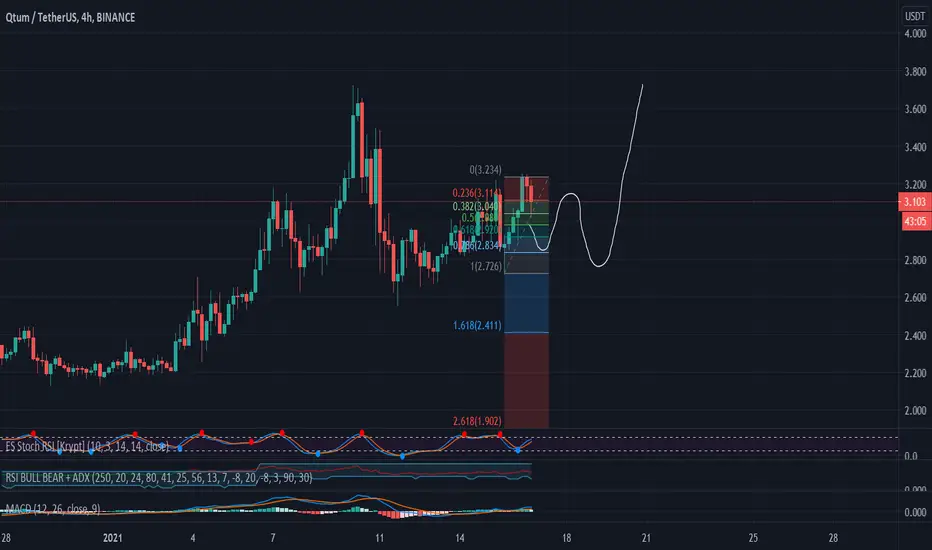
QTUMUSDT is testing daily resistance 🦐IF $QTUM.X will flip resistance into new support, According to Plancton's strategy (check our Academy), we can set a nice order
–––––
Follow the Shrimp 🦐
Keep in mind.
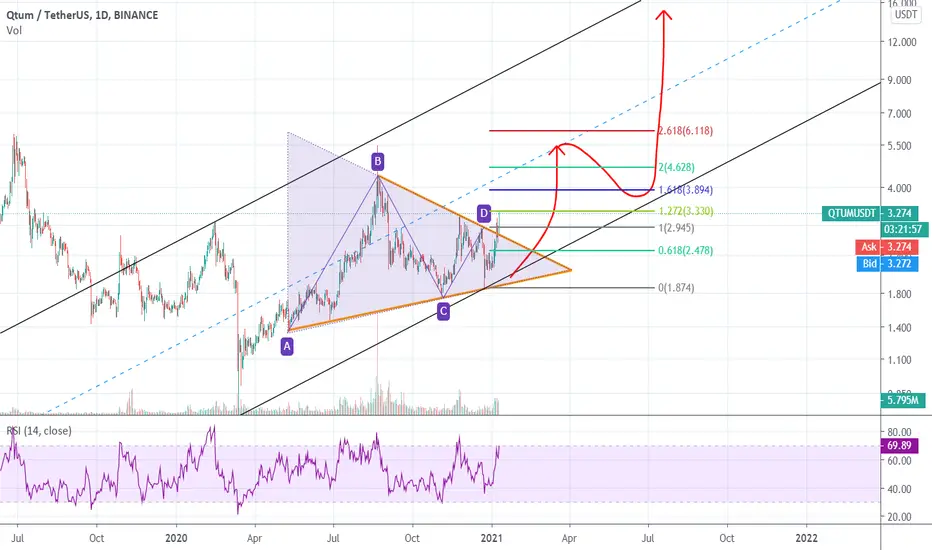
🟣 Purple structure -> Monthly structure.
🔴 Red structure -> Weekly structure.
🔵 Blue structure -> Daily structure.
🟡 Yellow structure -> 4h structure.
⚫️ Black structure -> <4h structure.
Here is the Plancton0618 technical analysis, please comment below if you have any question.
The ENTRY in the market will be taken only if the condition of the Plancton0618 strategy will trigger.
QTUMUSDT.P trade ideas
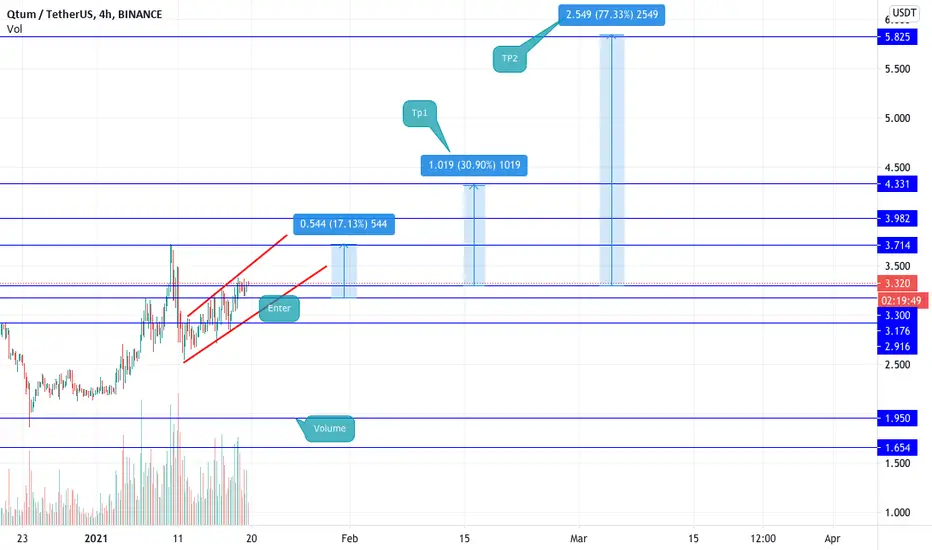
#19 - QTUM/USDTTrade opened today @3.30.
5 previous closed cryptotrades :
#12 : ZEC/USDT : 1st half position return : + 12.11 %.
2nd half position return : +0.12 %.
#13 : IOTA/USDT : 1st half position return : + 28.74 %.
2nd half position return : + 5.43 %.
#14 : GVT/BTC : 1st half position return : + 25.4 %.
2nd half position return : flat.
#16 : TRX/USDT : Position return : flat.
#18 : ATOM/USDT : Position return : - 14.62 %.
Don’t forget to follow the idea if you want to get updates.
If you win on the markets by following this idea, let me know it by commenting.

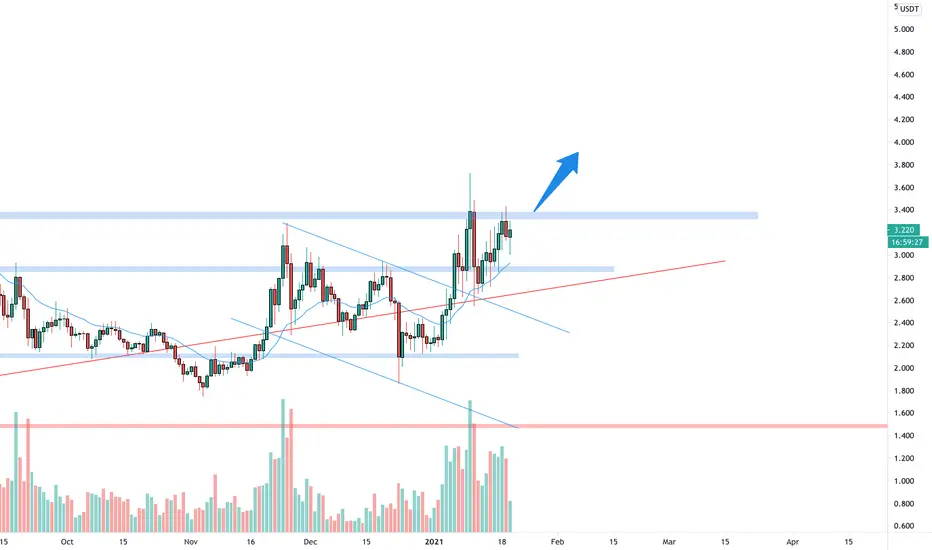
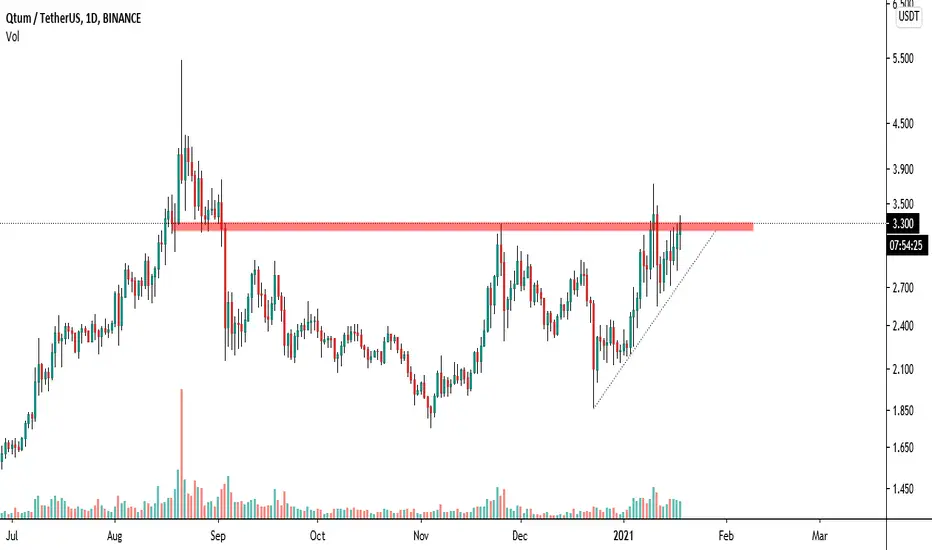
Qtum Price At Resistance S/R FlipQtum Price at the resistance breakout above the resistance will send price higher.
watch this level closely and wait for price to make breakout above the resistance
flip of the resistance will send price higher


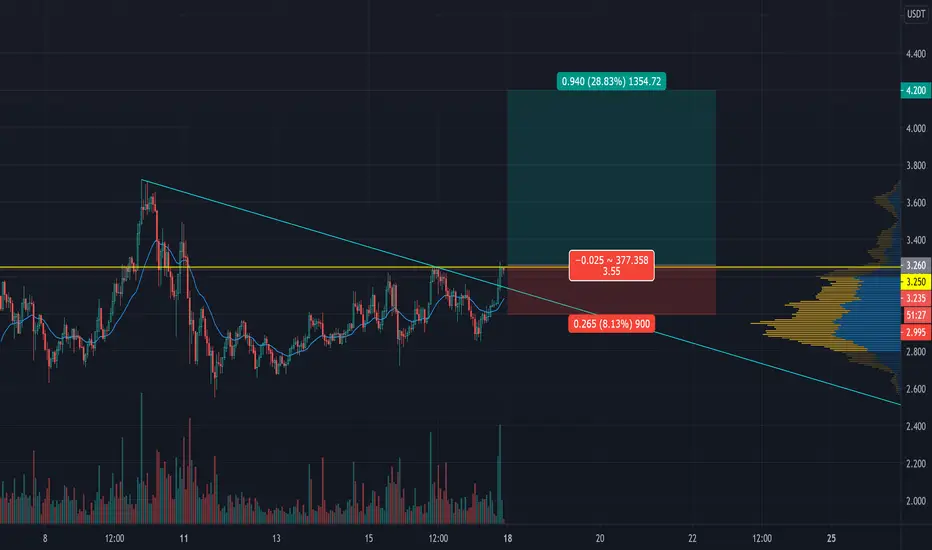
BINANCE: QTUM/USDT (Early Call)🛒 Pair: QTUM/USDT 🛒
== SPOT==
⏰ 1399/10/29 ⏰
🕰 18/01/2021 🕰
#24
Duration:
📈 SHORT - MID📈
Ex: Binance
🛒 Buy : 3.26 🛒
👉Sell Targets👈
🎯TP1: 3.45 🥉
🎯TP2: hidden🥈
🎯TP3: hidden🥇
🎯TP4: hidden🏆
🟥SL: 2.995
---Early Call---
**Buy the break out after closing above 3.25**
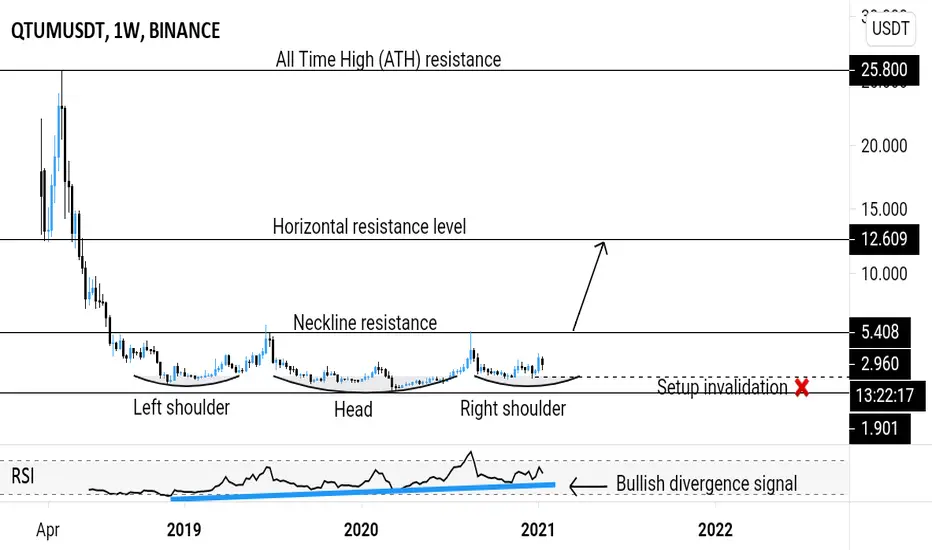
QTUMUSDT - Inverse head and shoulders trend reversal pattern 🔼Analysis 🔎: QTUMUSDT is printing the inverse head and shoulders trend reversal pattern on the weekly timeframe. This is a bullish pattern.
RSI is printing a bullish divergence signal.
Potential breakout.
Buy entry ⬆️ - breakout above the inverse head and shoulders neckline resistance.
Targets 🎯 - horizontal resistance levels.
Setup invalidation ❌ - breakdown below the right shoulder support level.
QTUMUSDTlet QTUM hit 2.83 and then you can enter with high scalp for long terms and tons of profit
this sentence is confirmed IF the BTC dominance stays at this range or become lower to 65% (which is even better)
where can you check the btc dominance? coin360.com

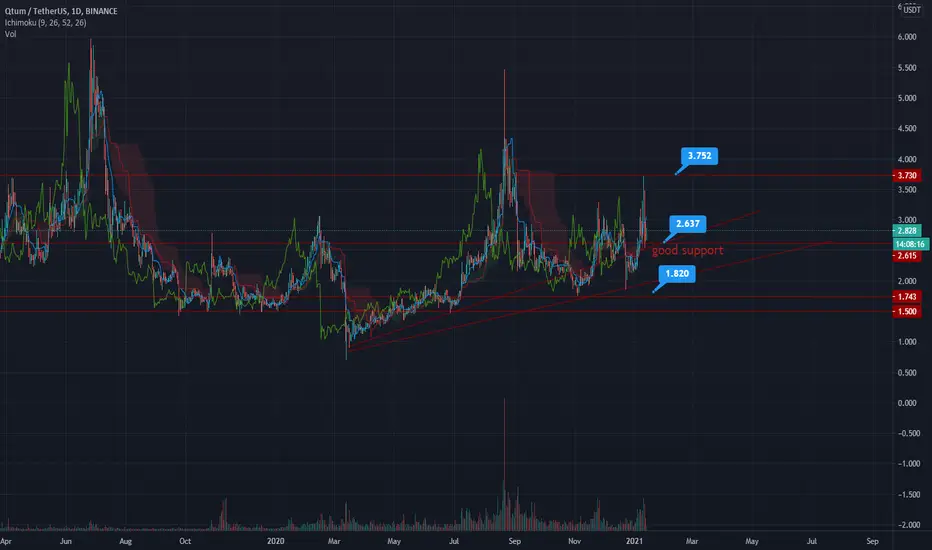
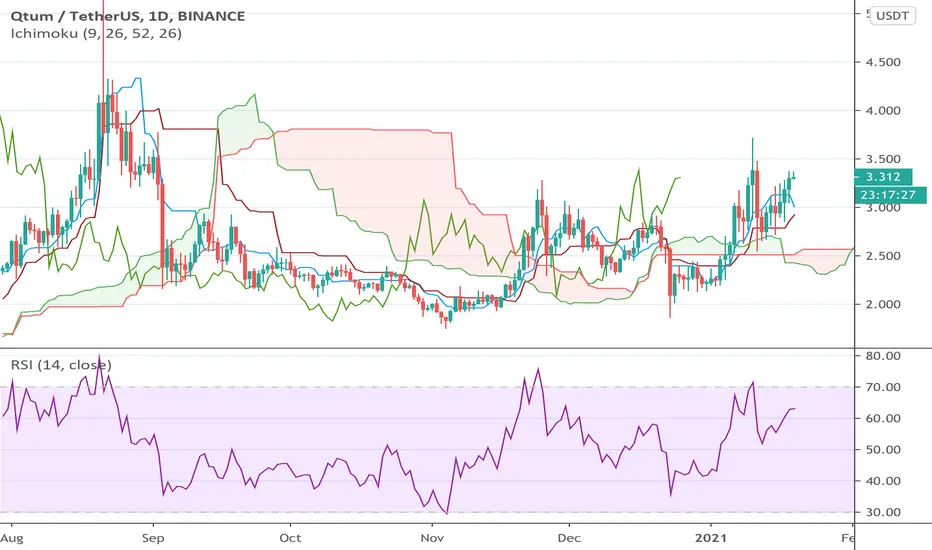
is qtum wanna dive down?we have head and shoulders pattern in the chart also bearish convergence in MACD
if price goes below $2.63( H&S base line) we expecting a feedback to the same line and after that price should go all the way down to the target($1.533)
we have a weak buying signal from ichimoku but seems it's gonna fail
at the end everything is up to BTC moves


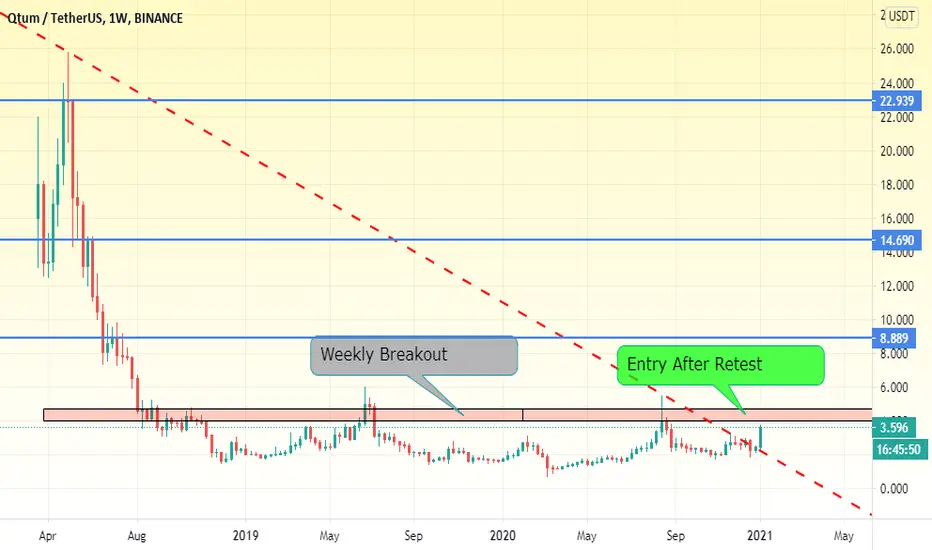
Qtum Weekly Technical AnalysisDear Traders
A descending trendline has been broken, one can buy long or invest in this pair once the weekly breakout zone and conquered and retested!
Our targets are shown by blue levels.
#StayRoyal #StayProfitable
Happy Trading.
Oh QTUM analysis more than 40% profit in 5 days😉Well, my friends, this is from qtum analysis, which reached its two targets and got very close to its third target. I put qtum analysis in 5JAN. If you want to use the analysis I do, be sure to follow me

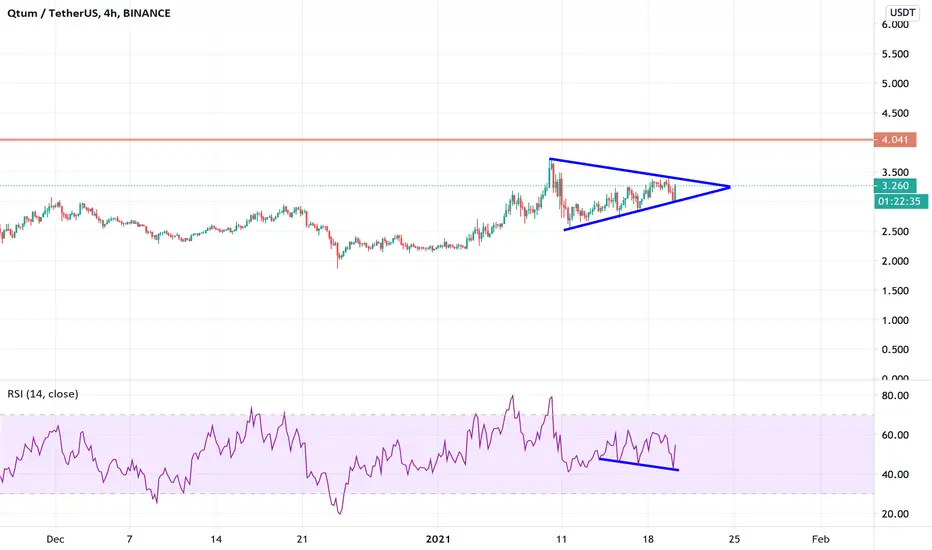
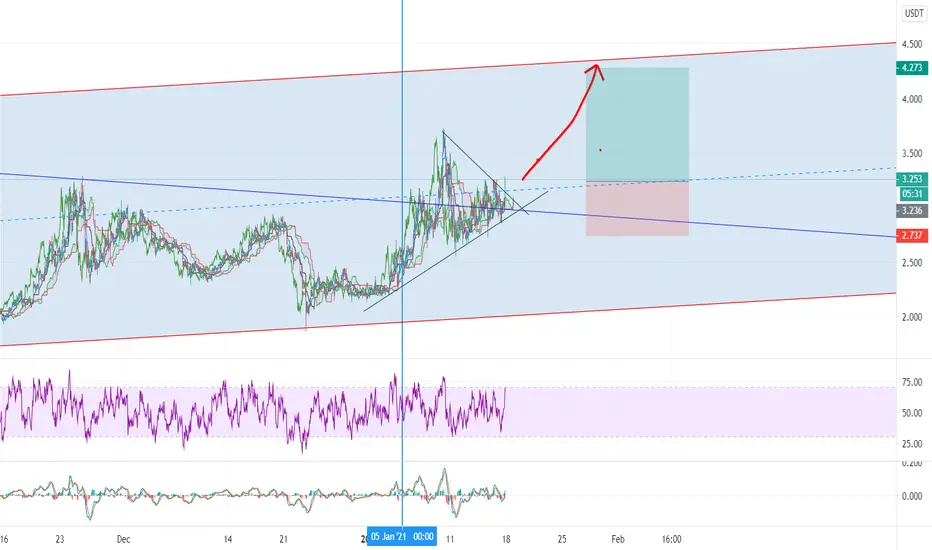
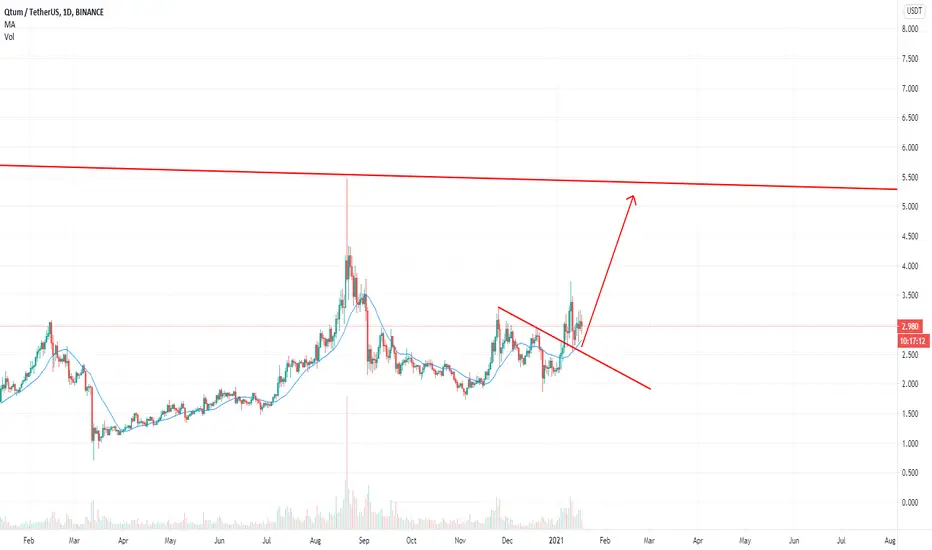
QTUM continuation ideaI've seen this setup on multiple midcaps already.
price should find resistance higher, at around 4,4 USD area and come back to 3 dollar range for final retest and continue higher.

$QTUMUSDT what a nice chart. $QTUM $BTC$QTUMUSDT what a nice chart. $QTUM $BTC
very soon is going to beast mode