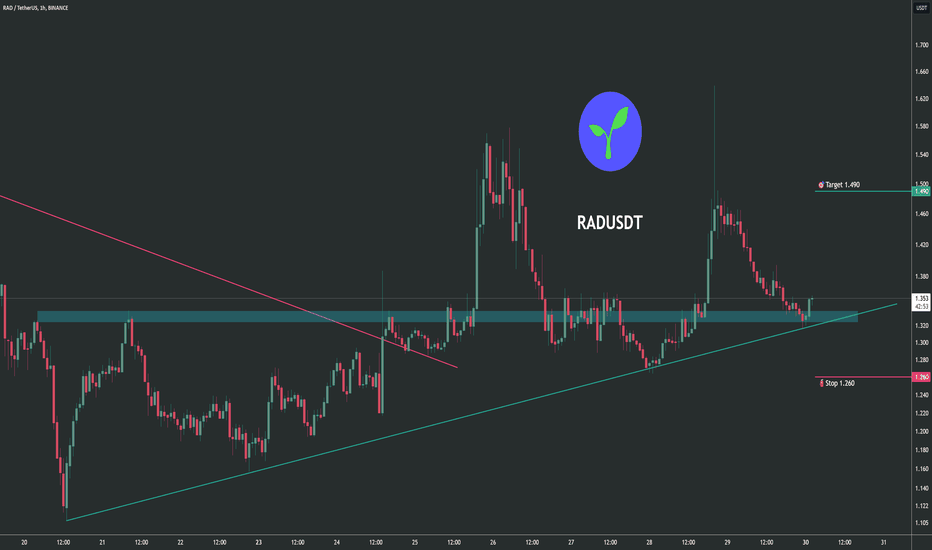
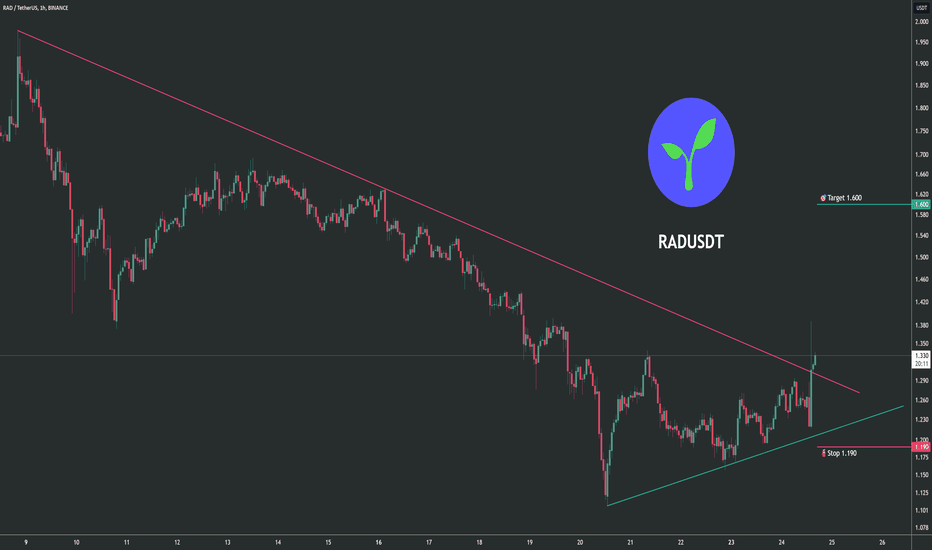
RADUSDT UPDATE
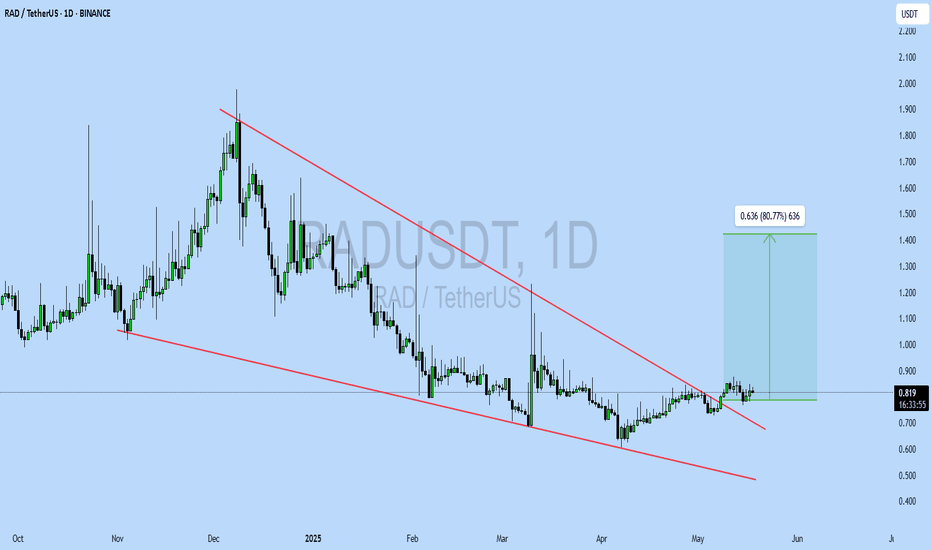
Pattern: Falling Wedge Breakout
Current Price: \$0.819
Target Price: \$1.45
Target % Gain: 80.77%
Technical Analysis: RAD has broken out of a long-term falling wedge on the 1D chart. Price is consolidating above the breakout level, signaling potential continuation. A measured move targets 80% u
RADUSDT CHART ANALYSİS - EDUCATIONAL POSTHow NFT Technology Developed
NFT technology was created in 2017 based on Ethereum smart contracts. Since then, we have witnessed many successful NFT projects and deals. Stories like these perfectly describe the current and future possibilities of the technology.
The development of blockchain tech
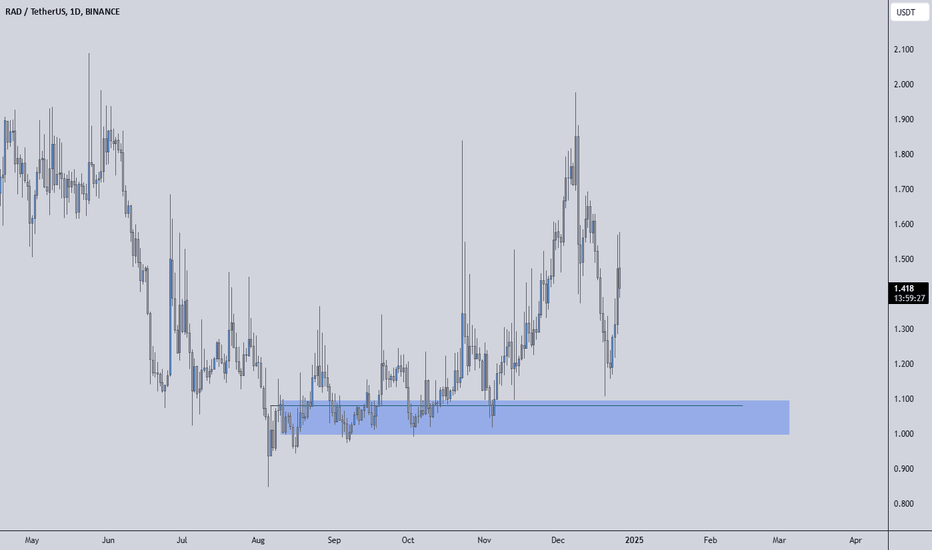
RADUSDT: %220 Daily Volume Spike – The Smartest Entry Revealed!RADUSDT is seeing a massive %220 daily volume spike , signaling an intense surge of activity. For those looking to capitalize on this momentum, the blue box zone represents the most rational and carefully chosen entry point.
Why This Matters:
The Blue Box Advantage: This zone has been meti
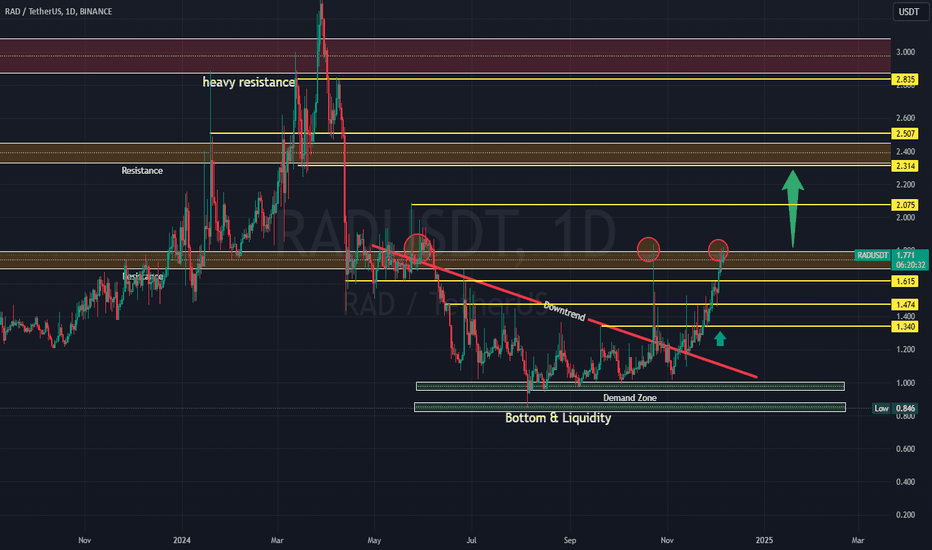
RAD Pump to 2.4XX $ is about to happen after break 1.8XX $ Area Radicle (RAD) has recently experienced a significant price surge, but it's important to be cautious about its future direction.
Key Technical Analysis:
* Fakeout: to 2.4XX is more likely to happen
* Potential Correction: A deeper correction towards the $1.6 or $1.5 support levels is possible.
R
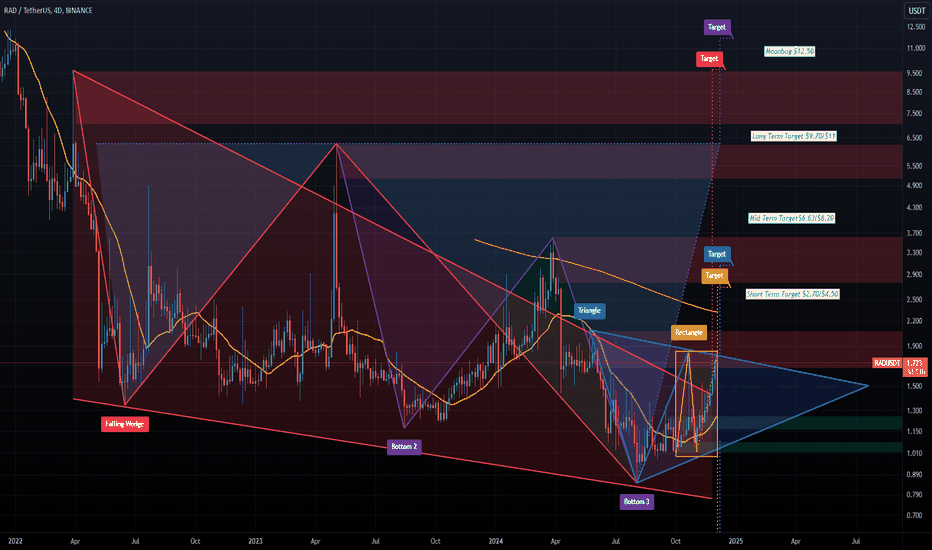
#RAD #Next 7X Gem on Spot! 06/12/2024💎 Next 7X Gem on Spot! 💎
Get ready, traders! We have multiple confirmations for a breakout alert based on the 4D Chart! 🚀
🔥 Key Indicators:
- Falling Wedge Breakout
- Three-Ball Bottom
- Very close to breaking the triangle and rectangle patterns!
⏰ Current Price: $1.72
🎯 Targets: $2.70 | $4.50 |
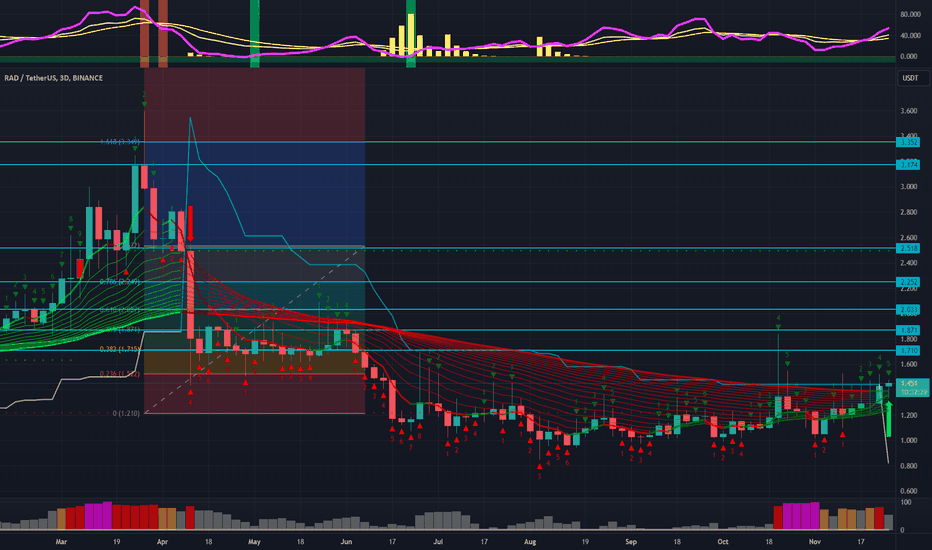
RADICLE - Getting Ready Now (+Targets)Hello ! We can see other coins running nicely like AMPera Token.
AMP also had a similar signal on this time frame. Even thought i did not review it ...
However.. there is a whole list of coins giving signals these days.
TARGET 2.52
Trade Safely !🍀🍀🍀
If you need targets with your coins
just leave a
See all ideas
Summarizing what the indicators are suggesting.
Oscillators
Neutral
SellBuy
Strong sellStrong buy
Strong sellSellNeutralBuyStrong buy
Oscillators
Neutral
SellBuy
Strong sellStrong buy
Strong sellSellNeutralBuyStrong buy
Summary
Neutral
SellBuy
Strong sellStrong buy
Strong sellSellNeutralBuyStrong buy
Summary
Neutral
SellBuy
Strong sellStrong buy
Strong sellSellNeutralBuyStrong buy
Summary
Neutral
SellBuy
Strong sellStrong buy
Strong sellSellNeutralBuyStrong buy
Moving Averages
Neutral
SellBuy
Strong sellStrong buy
Strong sellSellNeutralBuyStrong buy
Moving Averages
Neutral
SellBuy
Strong sellStrong buy
Strong sellSellNeutralBuyStrong buy
Displays a symbol's price movements over previous years to identify recurring trends.
