RAY Technical Analysis on a Weekly Timeframe.Hello Traders,
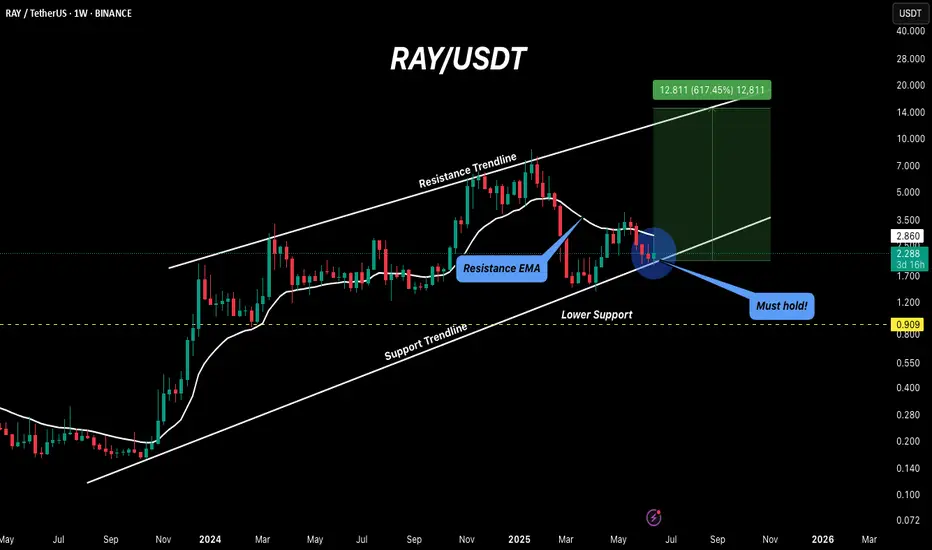
Today, let’s analyze RAYDIUM (RAY) on the weekly timeframe.
RAY has been one of the more consistent projects in the market. The price is currently sitting at the support trendline and just below the 21 EMA resistance. At this point, it’s clear that for a bullish move, the price must
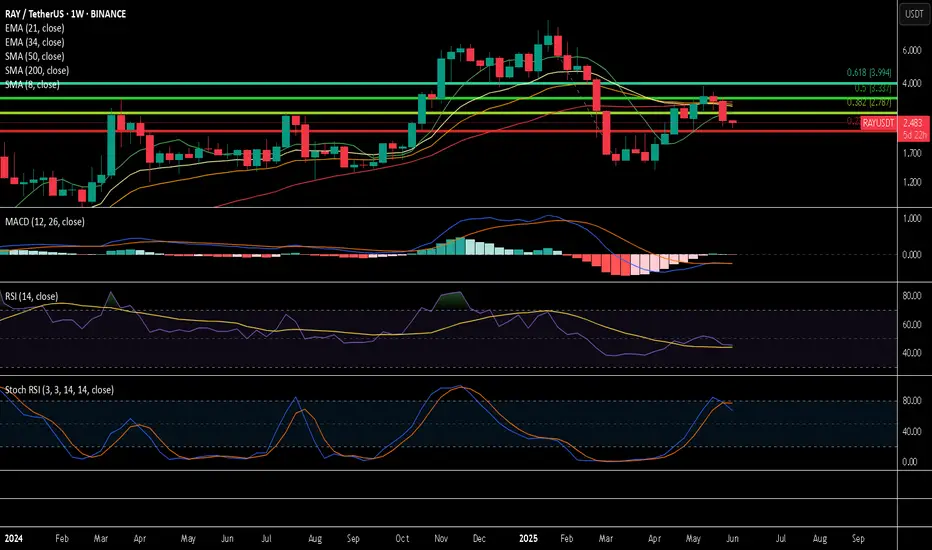
RAY the end or just the start?To first look at Ray we can start with RAYUSDT and move to RAYSOL and RAY BTC.
RAY is not sitting below all of the moving averages. Not an ideal position.
So far MACD cross down does not mean much as the week has not ended yet. Ideally to stay bullish it need to end the week not crossed d
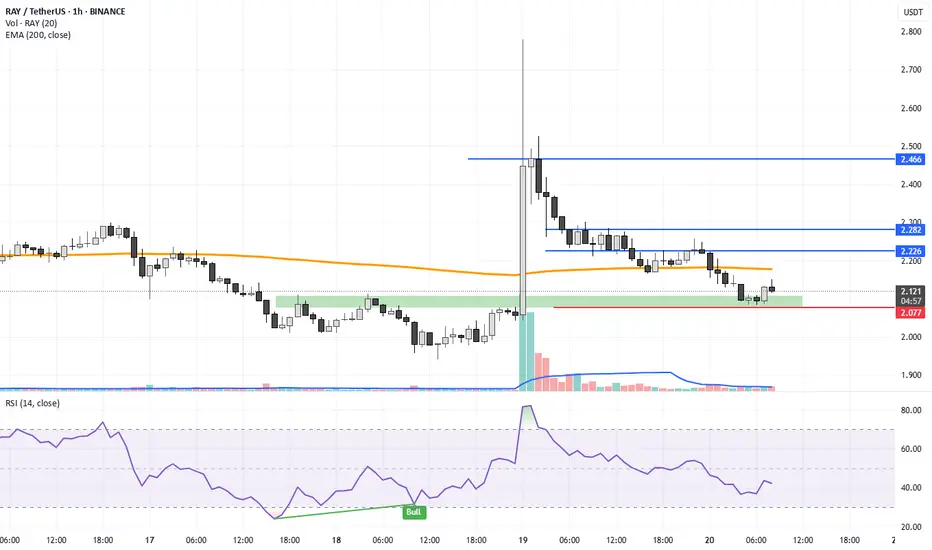
RAYDIUM LONG SETUP ALL trading ideas have entry point + stop loss + take profit + Risk level.
hello Traders, here is the full analysis for this pair, let me know in the comment section below if you have any questions, the entry will be taken only if all rules of the strategies will be satisfied. I suggest you keep thi
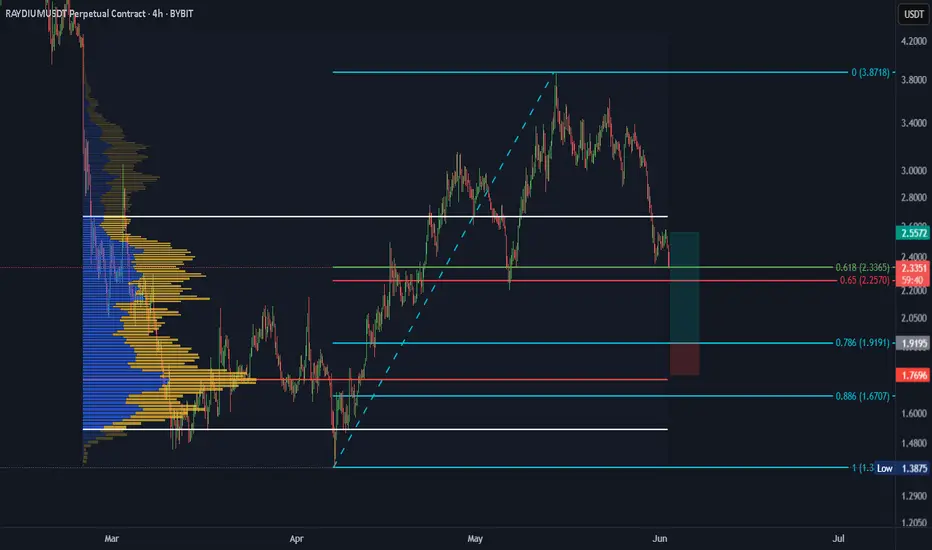
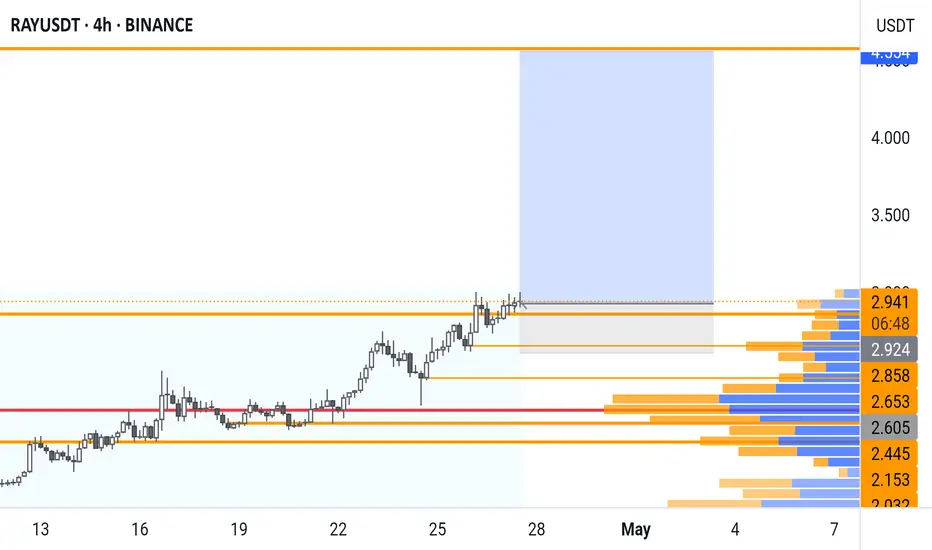
RAY (Raydium) – Long Swing Trade Setup from Major SupportRAY is trading at a major support zone between $2.85 – $3.25, which historically has acted as a base for significant upward moves. With strong support beneath and favorable upside targets, this presents a solid long swing opportunity with clear invalidation.
🔹 Entry Zone:
$2.85 – $3.25 (key support

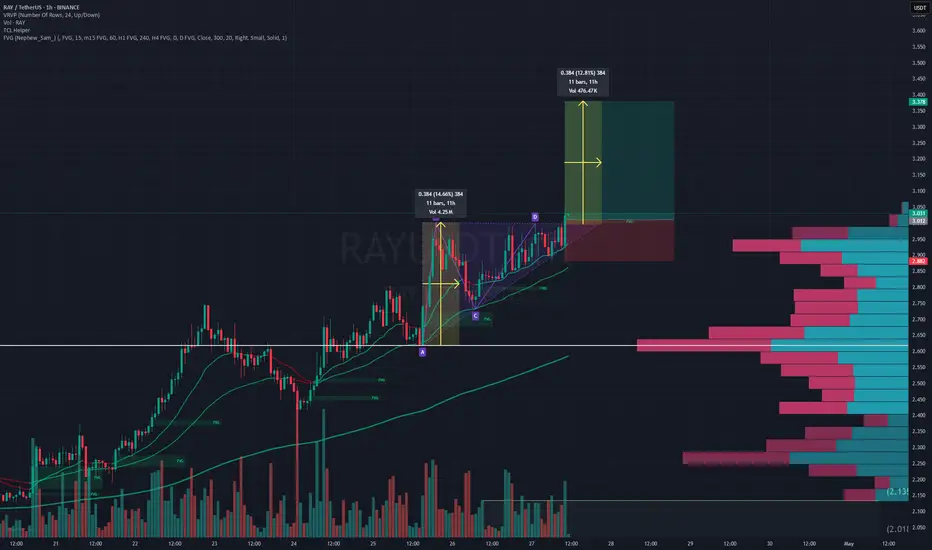
Breaks Out of Red Resistance Zone 🚨 NASDAQ:RAY
Breaks Out of Red Resistance Zone 🚨
NASDAQ:RAY
has successfully broken out of the red resistance zone, which was part of a symmetrical pattern. This breakout could signal a strong bullish move.
📈 Technical Overview:
Pattern: Symmetrical
Breakout Level: Red resistance zon
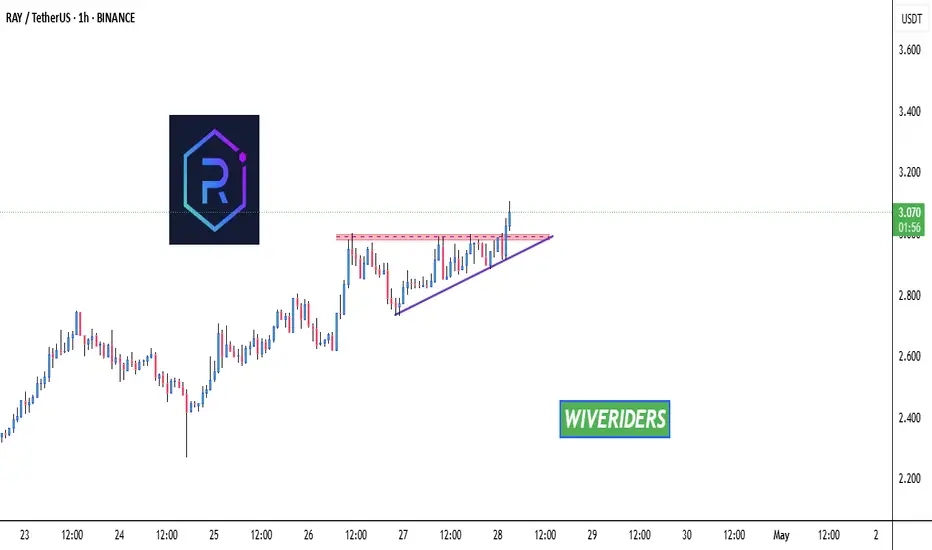
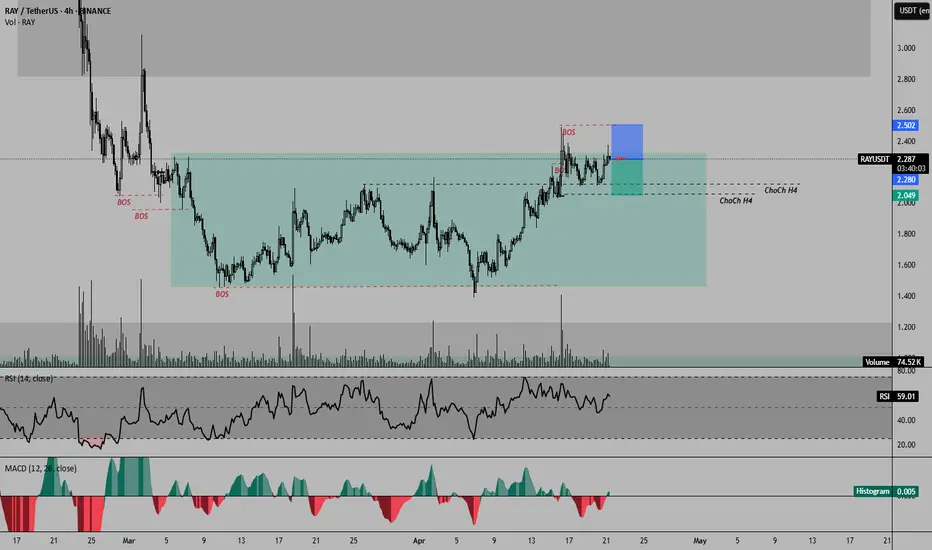
RAYUSDTLONG SET UP RAYDIUM 📈
market optimistic to going up to reach resistance (orange line)
please manage risk your self max5% no over Leverage cause this mid/long trade (swing trade).
support :
1.strong trend price above MA50
2.Initial break (engulfing 4H)
3.Dominan break 4H
4.stop loss support bello
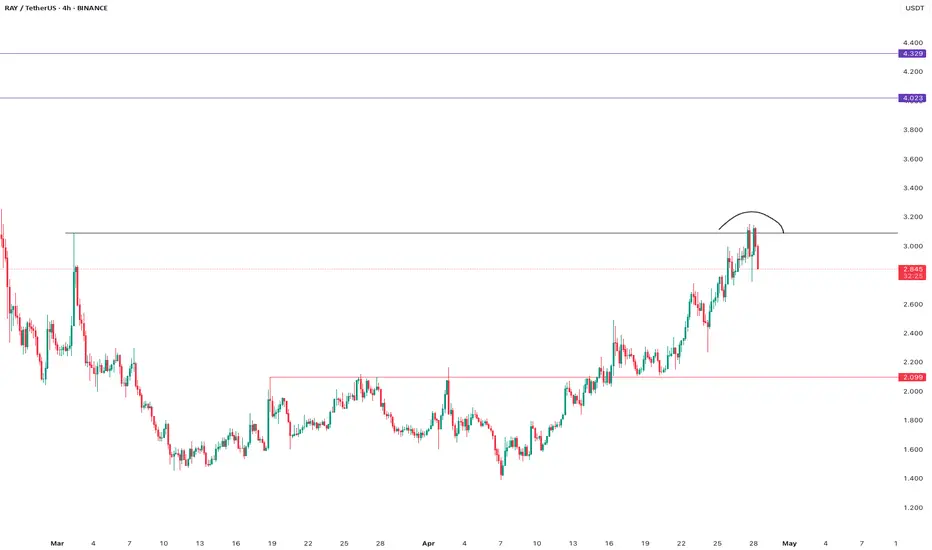
shortBearish diverguence H4 is in an important reciaticism and is being generated a distribution zone therefore minimum risk short
See all ideas
Summarizing what the indicators are suggesting.
Oscillators
Neutral
SellBuy
Strong sellStrong buy
Strong sellSellNeutralBuyStrong buy
Oscillators
Neutral
SellBuy
Strong sellStrong buy
Strong sellSellNeutralBuyStrong buy
Summary
Neutral
SellBuy
Strong sellStrong buy
Strong sellSellNeutralBuyStrong buy
Summary
Neutral
SellBuy
Strong sellStrong buy
Strong sellSellNeutralBuyStrong buy
Summary
Neutral
SellBuy
Strong sellStrong buy
Strong sellSellNeutralBuyStrong buy
Moving Averages
Neutral
SellBuy
Strong sellStrong buy
Strong sellSellNeutralBuyStrong buy
Moving Averages
Neutral
SellBuy
Strong sellStrong buy
Strong sellSellNeutralBuyStrong buy
Displays a symbol's price movements over previous years to identify recurring trends.