RAY pump nowRisk warning, disclaimer: the above is a personal market judgment based on published information and historical chart data on Tradingview, all analysis is only subjective. Hope investors consider, I am not responsible for your investment decision. Thank you.
Good luck
RAYUSD trade ideas

RAY/USDEasy invalidation, will stop manually but easy invalidation.
Can come from a lot lower (3.10s) but buying some spot here.
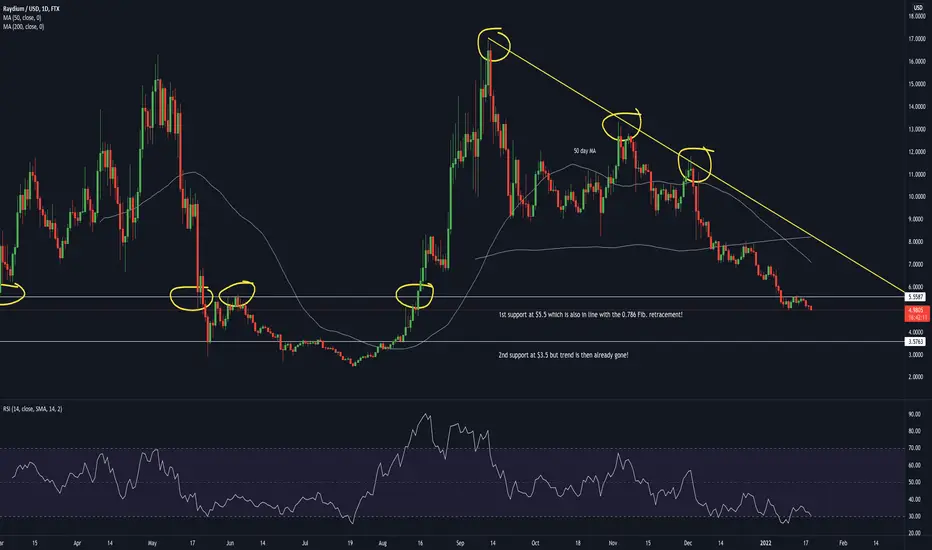
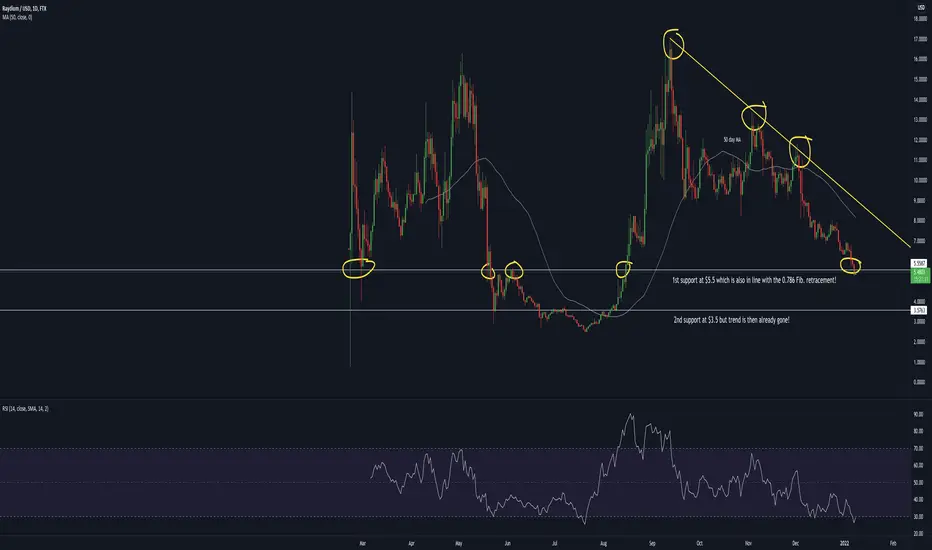
Next support 3.5 USD for Raydium? Raydium below $5.5! Support by $3.5 but trend is then already gone! Nevertheless RAY is a top-pick if you want to doller cost average into the Solana ecosystem!
RAY of sunshine ; yeh i know my last charts were earlyRAY of sunshine ; yeh i know my last charts were early
a ray of sunshine in a desolate landscape
prepare for launch into the stratosphere
SOL SRM RAY the royal trifecta

Raydium support level at $5.51st support for Raydium at $5.5 which is also in line with the 0.786 Fib. retracement!
RAY - Uptrend incomingBig deviations below the low, strong accumulation, money inflows, good project, solana ecosystem,
Only way...

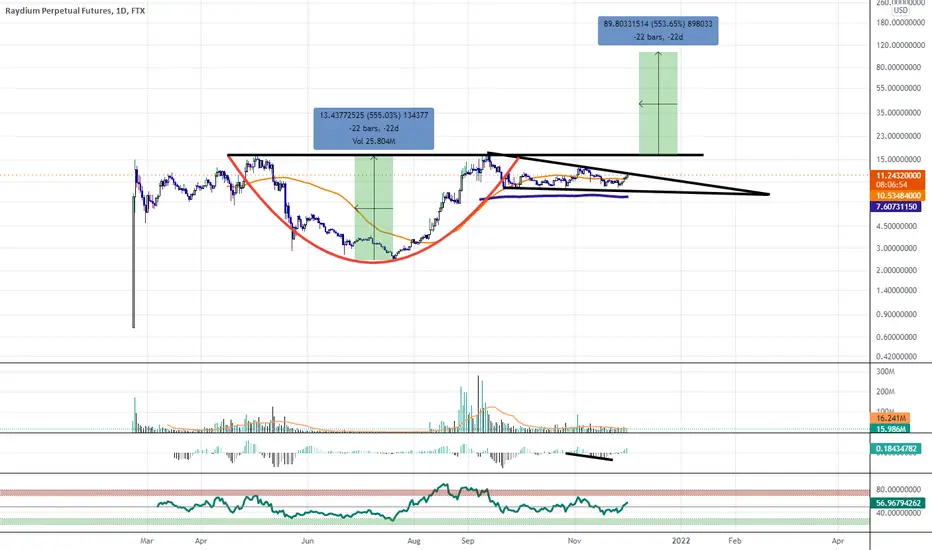
Raydium Cup and Handle with Potential Upside to $100 or HigherI recently uploaded a Bullish Gartley on the4 hour for Raydium and it played out very well but now i can see on the Daily that we have formed a Cup and Handle and the targets could potentially take us up to the low $100s
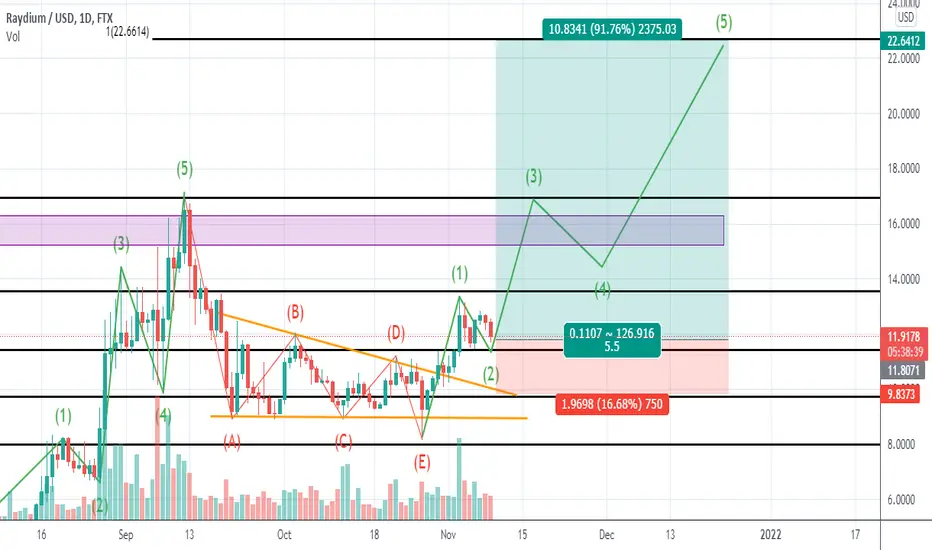
Quintuple Bottom on Raydium?FTX:RAYUSD looking pretty crazy, i cant remember if i have ever seen a quintuple Bottom on a Chart before. This could potentially confirm a bottom to traders and rn would be the lowest risk entry because its pretty easy to manage risk at this level. If RAY closes a daily candle or even a 4h below the $8.986 level, it will probably fall much lower. But since its a rock solid project and the biggest AMM on Solana i highly doubt it, at least it would be kinda devastating for the Solana ecosystem and signal weakness to investors.
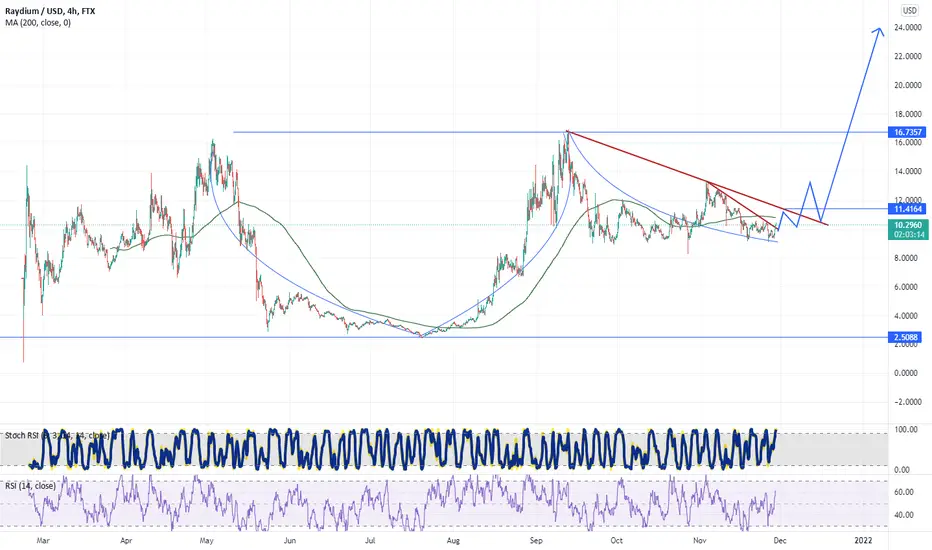
Oscillators on all higher time frames looking primed for tremendous upside potential.

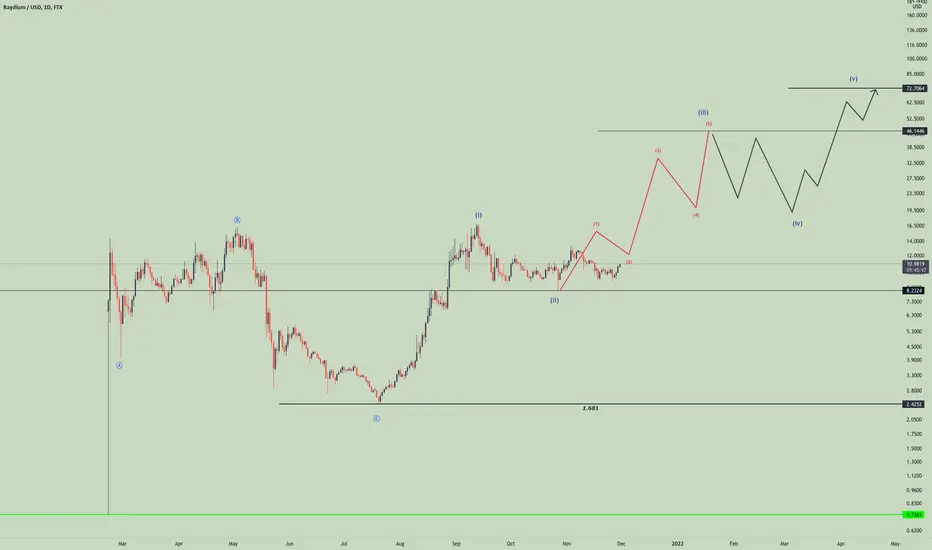
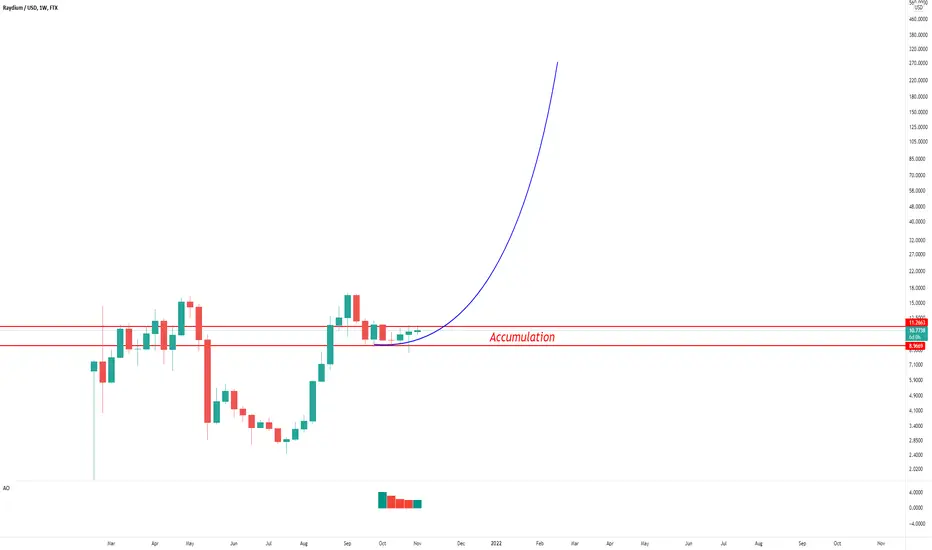
ray macromacro wave 1 was a massive impulse. now accumulation under resistance, i assume a massive breakout for wave 3
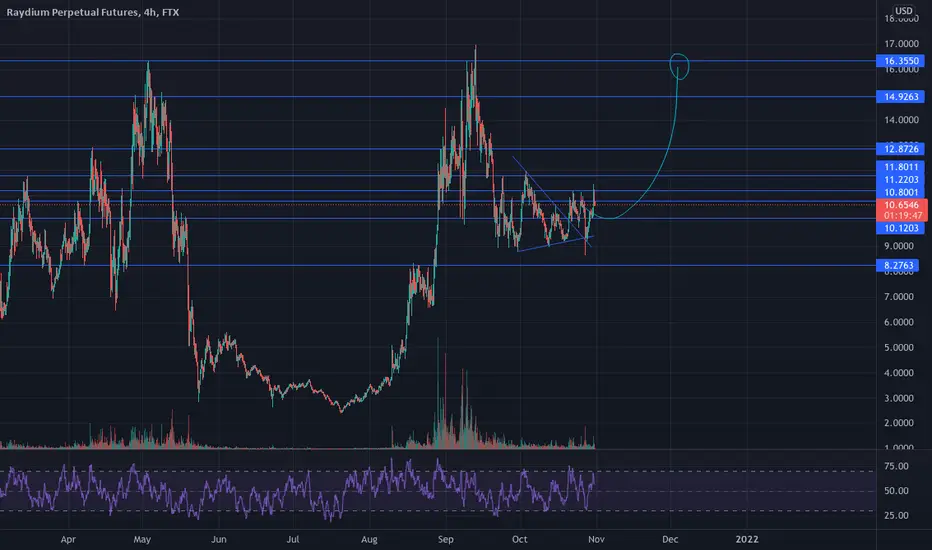
Ray's time is closing!Little falling wedge is broken, next bigger falling wedge around 11,4$
If we look at the big picture, you'll see a cup with handle formation. It's going to come with huge movements, i think.
Please support me with your likes and tips!
Repositioning a Bullish Stance on Raydium Right now at The PCZWe pulled back to the PCZ of the Bullish Gartley; perfect time to try to reposition myself here after getting stopped out earlier trying to trade the breakout attempt while it was above the PCZ at higher prices.
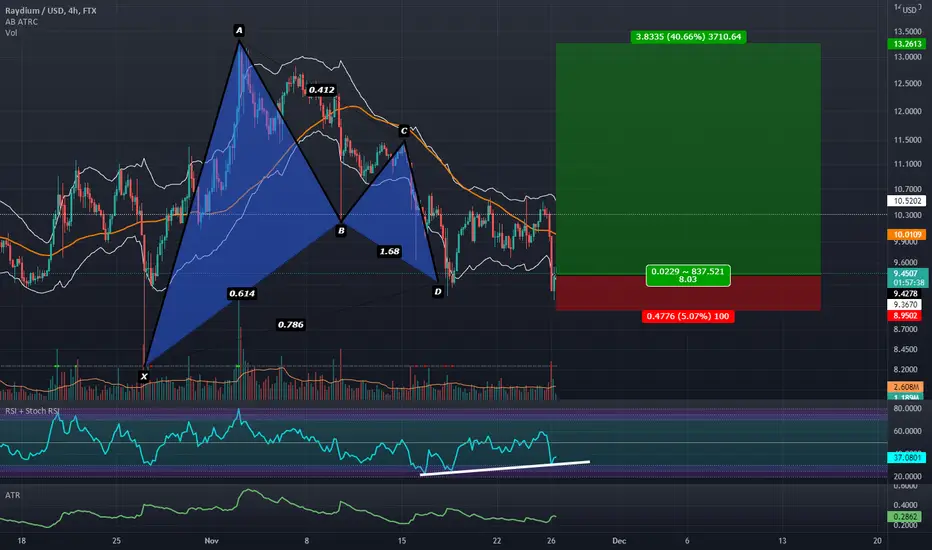
Bullish Gartley Springing Ray Back Into ActionThis looks like a Bullish Spring and a Back Test of what is statistically a Bearish Descending Triangle Pattern that if continues can take us up to the 88.6% Retracement.

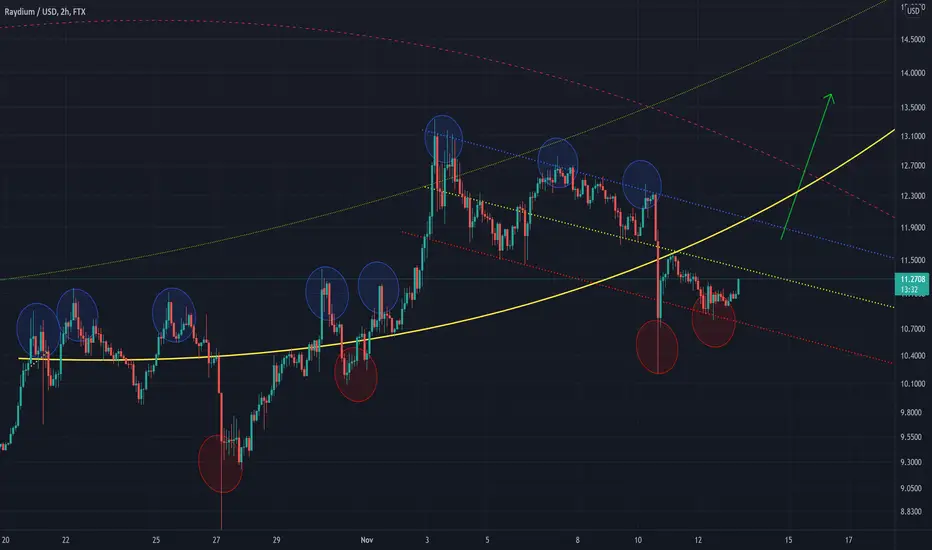
RAY curved channel and trajectoryA probable RAY trajectory between supports and resistances.
For a broader view take a look at my linked chart below.
Just sharing my personal charts for learning purposes only. This is not an investment recommendation.
Raydium updateRay has held the top of the Wyckoff range, retesting and turning it into support.
I entered a small leveraged position last night on the S/R flip of the .382 but woke up to being stopped out.
RAY looks kind of similar to BTC in that it has pulled back and retested the top of its range. Will wait and see now if it holds and look for an entry.

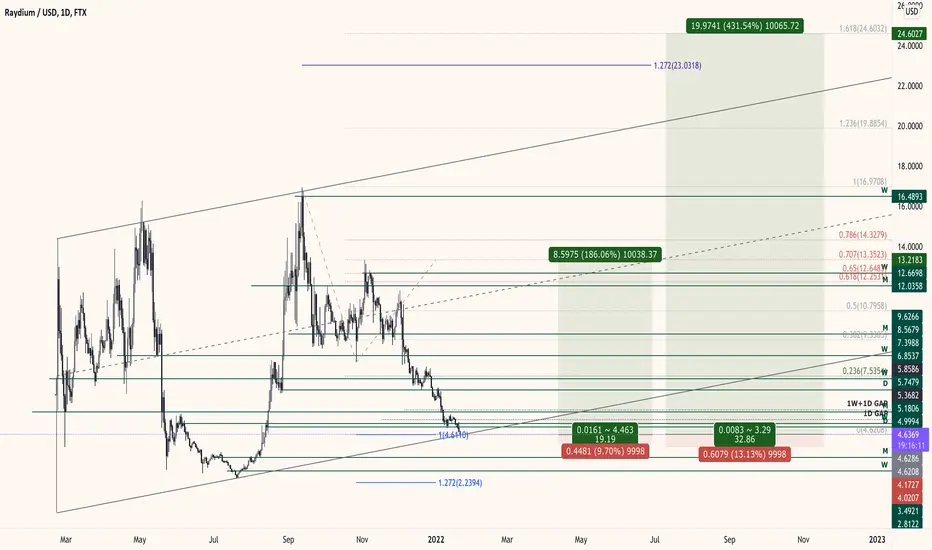
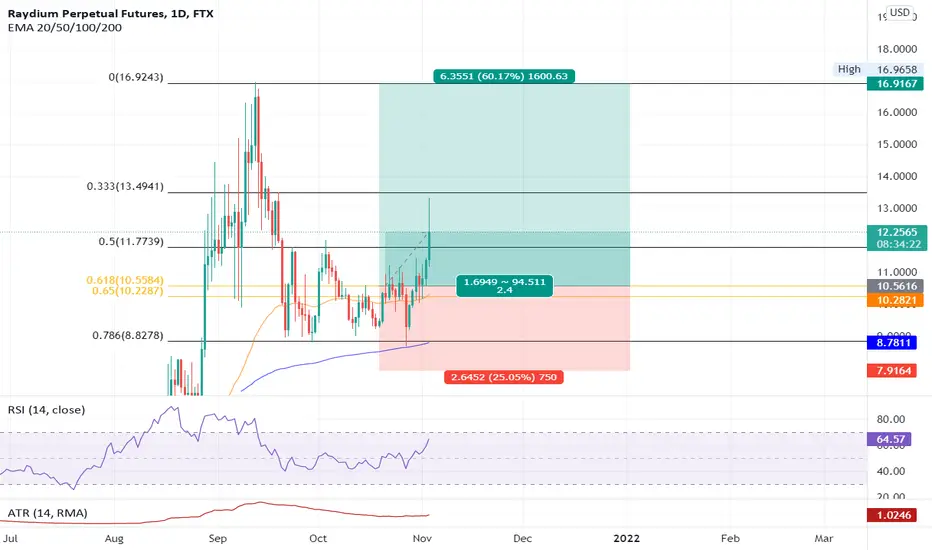
RaydiumBeen watching Raydium for a while, I'm going to look for entry if it can hold the 0.382 on the daily. The symmetrical triangle looks to be playing out which I'm viewing as a bullish pennant, target is around $25.

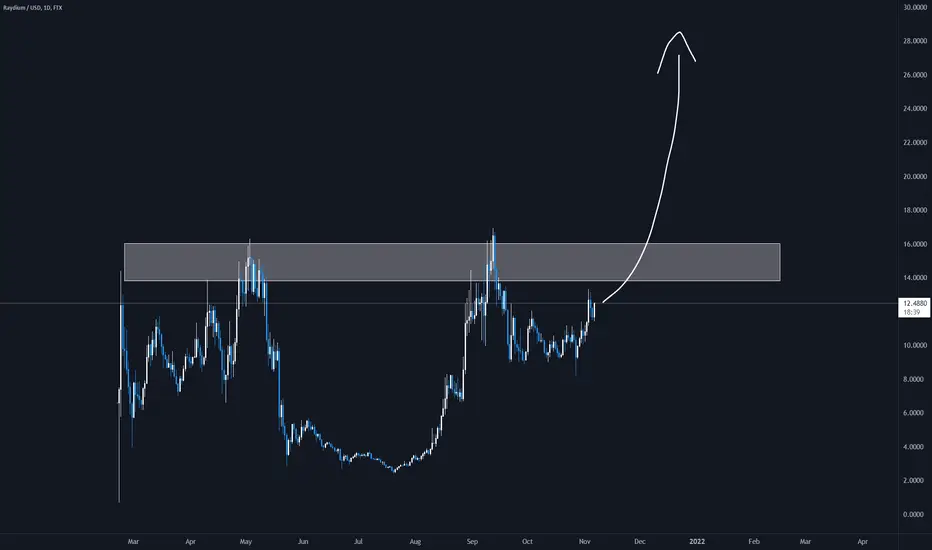
A Parabolic Rise Coming.Many will struggle to believe the moves they see in crypto that I believe are coming, Timelines are always the hardest part and usually we end up moving a lot higher/faster than anticipated, these projections will change if we make a new low under our accumulation zone but it won't change much in the long run as the clear direction is up.
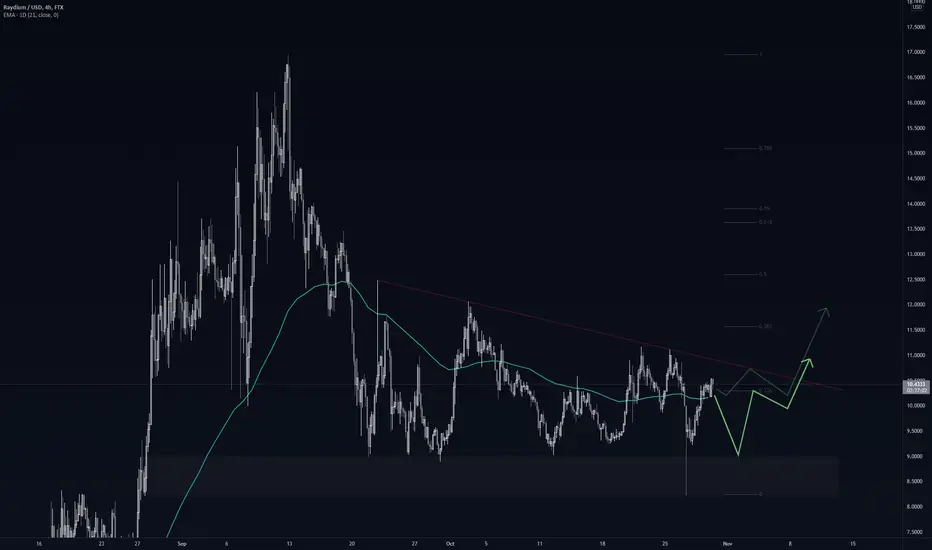
RAY 30/10Trapped/weakened, very similar to SRM/AUDIO:
- Descending trendline and strong support, would look for breakout in next couple days if 21ema holds;
- Otherwise buy again in support zone.
- DeFi Land IDO'ing on RAY soon too, we saw increased activity pre-Star Atlas IDO. Don't expect the same response, but it's still big.
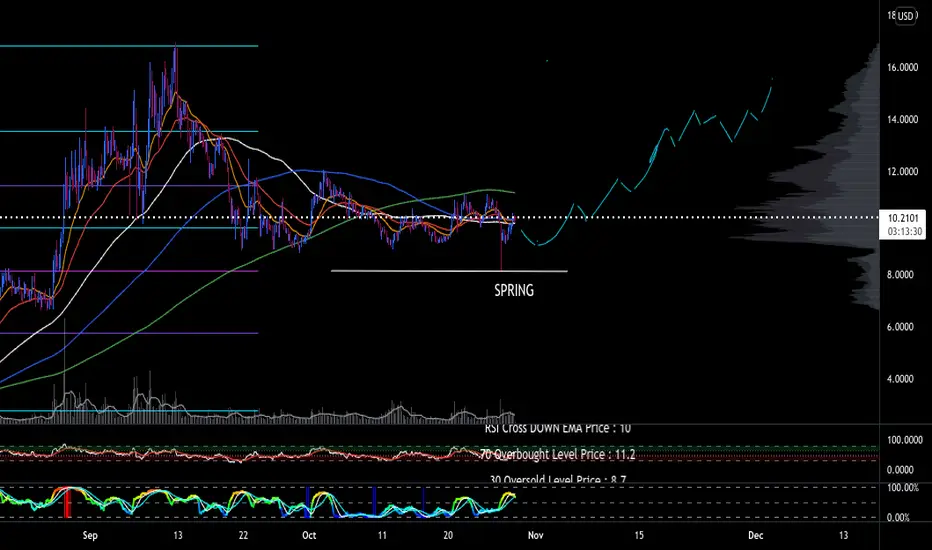
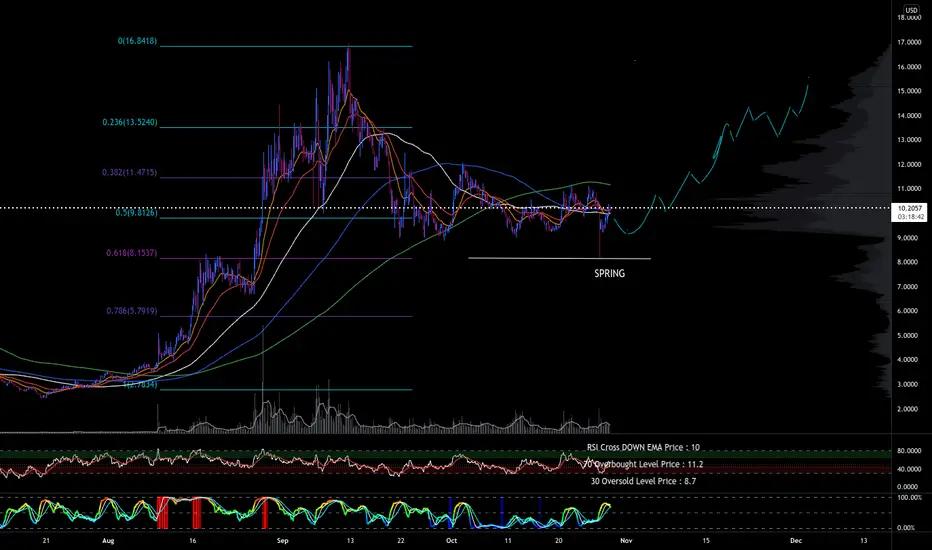
RAYDIUMOk so i hate doing the brush but my friend wanted to know as much as i think...It looks like wyckoff reacumulation to me, which wi think we just had the spring, so im expecting a retest and resumption upwards, of course making pullbacks along the way