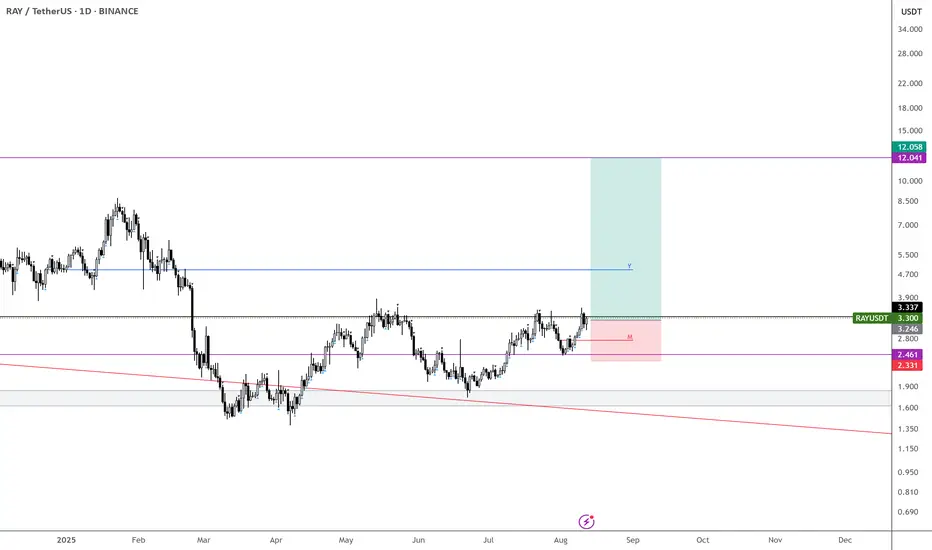
$RAY – Double Digits in Sight
This time, I’m aiming for double digits.
Missed it on the last run, but this setup looks far more likely to deliver.
Accumulating from here down to $2.70 — price has respected every key level perfectly.
Target: $12 … see you there. NASDAQ:RAY BINANCE:RAYUSDT
Related pairs
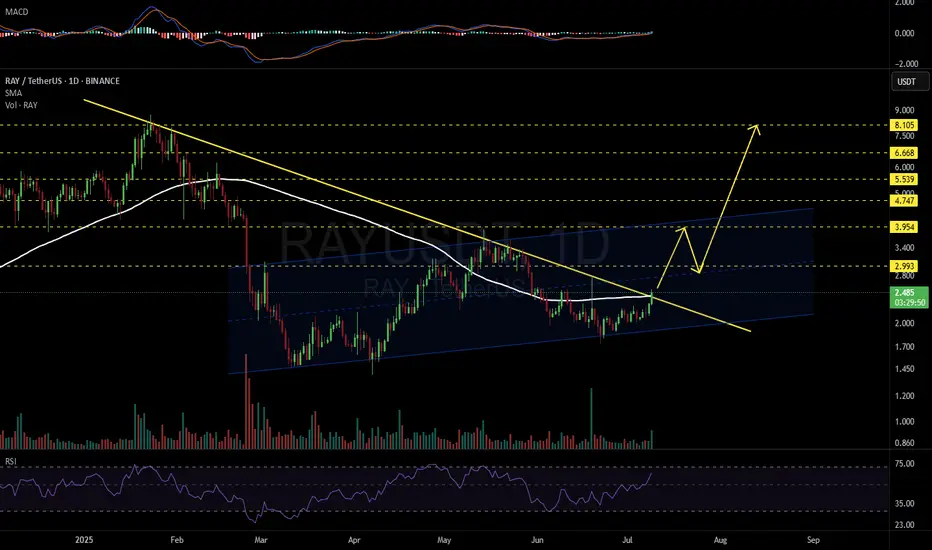
RAY | Rocket Ready to LaunchRAY appears primed for a potential rocket launch, having broken above a major descending trendline that has been suppressing price action since early 2025. The breakout is accompanied by strong bullish momentum and the RSI showing renewed strength after months of consolidation.
Key Technical Signa

Buy Trade Strategy for RAY: Fueling Solana DeFi and LiquidityDescription:
This trading idea is centered on RAY, the native token of Raydium, a leading automated market maker (AMM) and liquidity provider built on the Solana blockchain. RAY powers a platform that offers lightning-fast trades, deep liquidity pools, and seamless integration with the wider Solana

RAY Swing Trade – Key Support Retest in PlayRAY is pulling back toward a major support zone, offering a solid opportunity to position for a bounce as market structure remains constructive.
📌 Trade Setup:
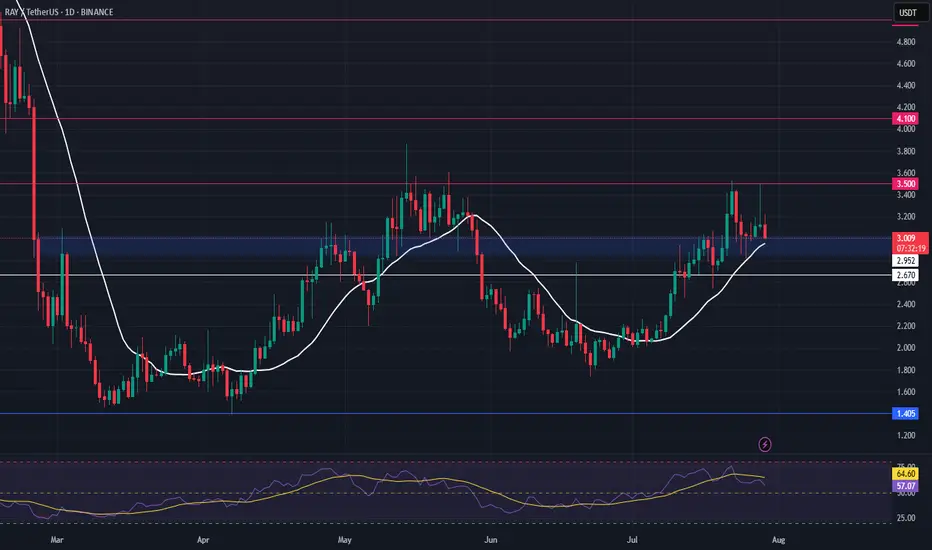
• Entry Zone: $2.85 – $3.02
• Take Profit Targets:
o 🥇 $3.50
o 🥈 $4.10
• Stop Loss: $2.67
$RAYUSDT Breakout: 146% PotentialNASDAQ:RAY just broke out of a major downtrend and flipped key resistance into support around $3.208 –$3.352.
If it holds, a move toward $8+ is on the cards, nearly
146% upside.
Momentum appears strong; watch for a clean retest and potential continuation.
DYOR, NFA

RAYUSDT – Spot Swing Buy RecommendationRAYUSDT – Spot Swing Buy Recommendation
Hello there,
If you're still wondering what to buy in 2025, keep in mind that previous recommendations like XRP, TRX, AAVE, LTC, HBAR, etc., have already passed their ideal buy zones. If you want to buy those, you’ll have to wait for a proper correction in

$RAYDIUMI pleaded for this trade to pick my entry but it refused.
It hurts to see your prediction play out without getting you some $$$
I am patient and I respect my discipline alot.
I am either making profit or I'm saving my capital.
No two ways!!!

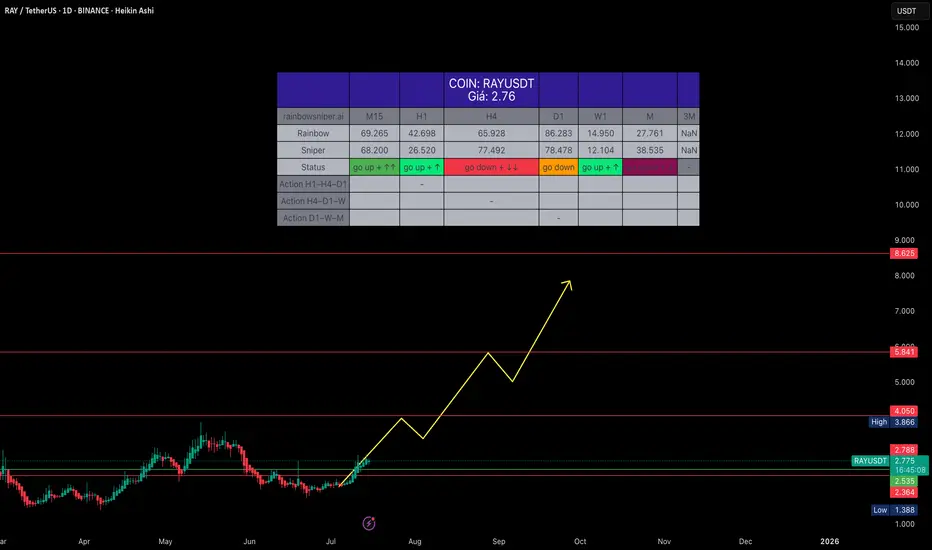
RAYUSDT 1D#RAY is breaking out above the descending resistance and the SMA100 on the daily chart.
If the daily candle closes above the descending resistance, the short-term targets are:
🎯 $2.993
🎯 $3.954
Mid-term targets:
🎯 $4.747
🎯 $5.539
🎯 $6.668
🎯 $8.105
⚠️ As always, use a tight stop-loss and apply pro
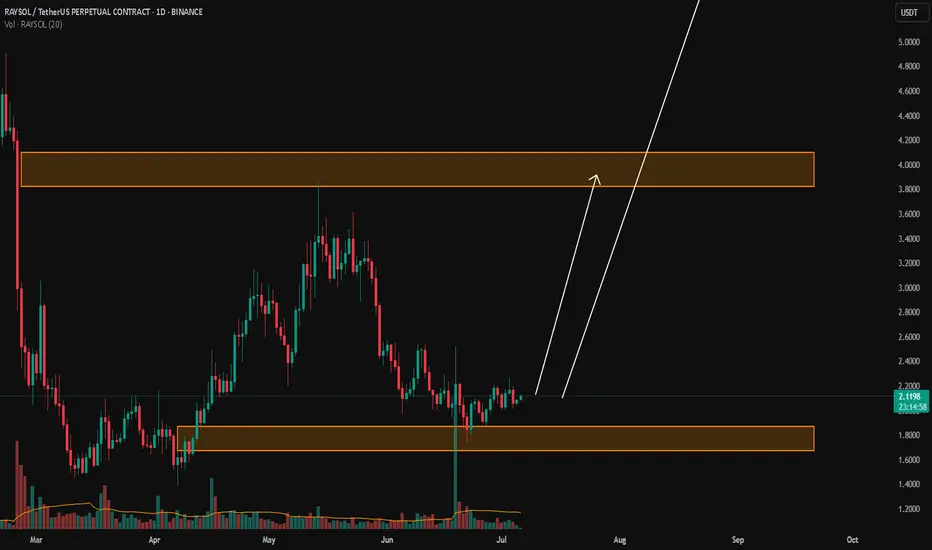
RAYSOL/USDTKey Level Zone: 1.6700 - 1.8700
LMT v2.0 detected.
The setup looks promising—price previously trended upward with rising volume and momentum, then retested this zone cleanly. This presents an excellent reward-to-risk opportunity if momentum continues to align.
Introducing LMT (Levels & Momentum Tr
See all ideas
Summarizing what the indicators are suggesting.
Oscillators
Neutral
SellBuy
Strong sellStrong buy
Strong sellSellNeutralBuyStrong buy
Oscillators
Neutral
SellBuy
Strong sellStrong buy
Strong sellSellNeutralBuyStrong buy
Summary
Neutral
SellBuy
Strong sellStrong buy
Strong sellSellNeutralBuyStrong buy
Summary
Neutral
SellBuy
Strong sellStrong buy
Strong sellSellNeutralBuyStrong buy
Summary
Neutral
SellBuy
Strong sellStrong buy
Strong sellSellNeutralBuyStrong buy
Moving Averages
Neutral
SellBuy
Strong sellStrong buy
Strong sellSellNeutralBuyStrong buy
Moving Averages
Neutral
SellBuy
Strong sellStrong buy
Strong sellSellNeutralBuyStrong buy
Displays a symbol's price movements over previous years to identify recurring trends.
Frequently Asked Questions
The current price of Raydium/Tether (RAY) is 3.5865 USDT — it has risen 6.20% in the past 24 hours. Try placing this info into the context by checking out what coins are also gaining and losing at the moment and seeing RAY price chart.
Raydium/Tether price has risen by 33.60% over the last week, its month performance shows a 26.01% increase, and as for the last year, Raydium/Tether has increased by 96.04%. See more dynamics on RAY price chart.
Keep track of coins' changes with our Crypto Coins Heatmap.
Keep track of coins' changes with our Crypto Coins Heatmap.
Raydium/Tether (RAY) reached its highest price on Sep 12, 2021 — it amounted to 16.9490 USDT. Find more insights on the RAY price chart.
See the list of crypto gainers and choose what best fits your strategy.
See the list of crypto gainers and choose what best fits your strategy.
Raydium/Tether (RAY) reached the lowest price of 0.1336 USDT on Dec 29, 2022. View more Raydium/Tether dynamics on the price chart.
See the list of crypto losers to find unexpected opportunities.
See the list of crypto losers to find unexpected opportunities.
The safest choice when buying RAY is to go to a well-known crypto exchange. Some of the popular names are Binance, Coinbase, Kraken. But you'll have to find a reliable broker and create an account first. You can trade RAY right from TradingView charts — just choose a broker and connect to your account.
Crypto markets are famous for their volatility, so one should study all the available stats before adding crypto assets to their portfolio. Very often it's technical analysis that comes in handy. We prepared technical ratings for Raydium/Tether (RAY): today its technical analysis shows the strong buy signal, and according to the 1 week rating RAY shows the strong buy signal. And you'd better dig deeper and study 1 month rating too — it's strong buy. Find inspiration in Raydium/Tether trading ideas and keep track of what's moving crypto markets with our crypto news feed.
Raydium/Tether (RAY) is just as reliable as any other crypto asset — this corner of the world market is highly volatile. Today, for instance, Raydium/Tether is estimated as 11.38% volatile. The only thing it means is that you must prepare and examine all available information before making a decision. And if you're not sure about Raydium/Tether, you can find more inspiration in our curated watchlists.
You can discuss Raydium/Tether (RAY) with other users in our public chats, Minds or in the comments to Ideas.