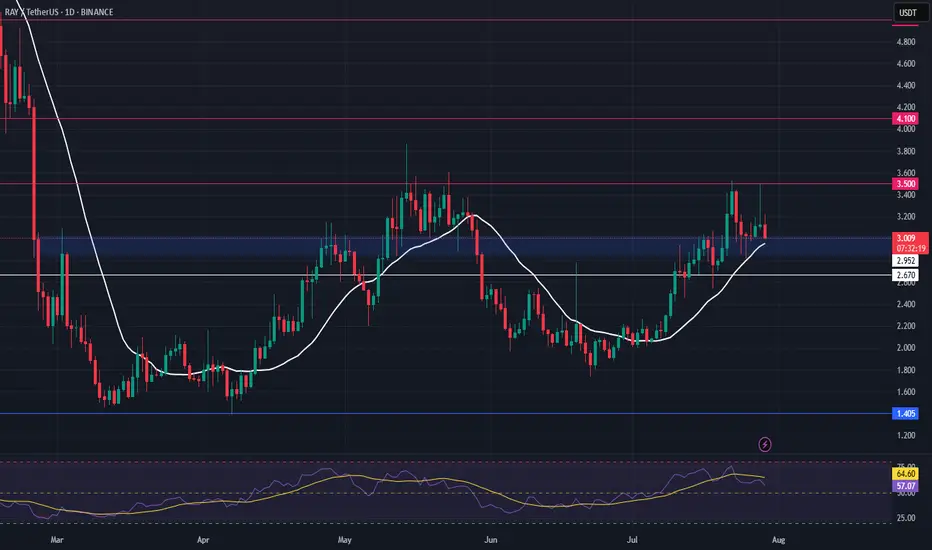
RAY Swing Trade – Key Support Retest in PlayRAY is pulling back toward a major support zone, offering a solid opportunity to position for a bounce as market structure remains constructive.
📌 Trade Setup:
• Entry Zone: $2.85 – $3.02
• Take Profit Targets:
o 🥇 $3.50
o 🥈 $4.10
• Stop Loss: $2.67
RAYUSDT trade ideas
$RAYUSDT Breakout: 146% PotentialNASDAQ:RAY just broke out of a major downtrend and flipped key resistance into support around $3.208 –$3.352.
If it holds, a move toward $8+ is on the cards, nearly
146% upside.
Momentum appears strong; watch for a clean retest and potential continuation.
DYOR, NFA

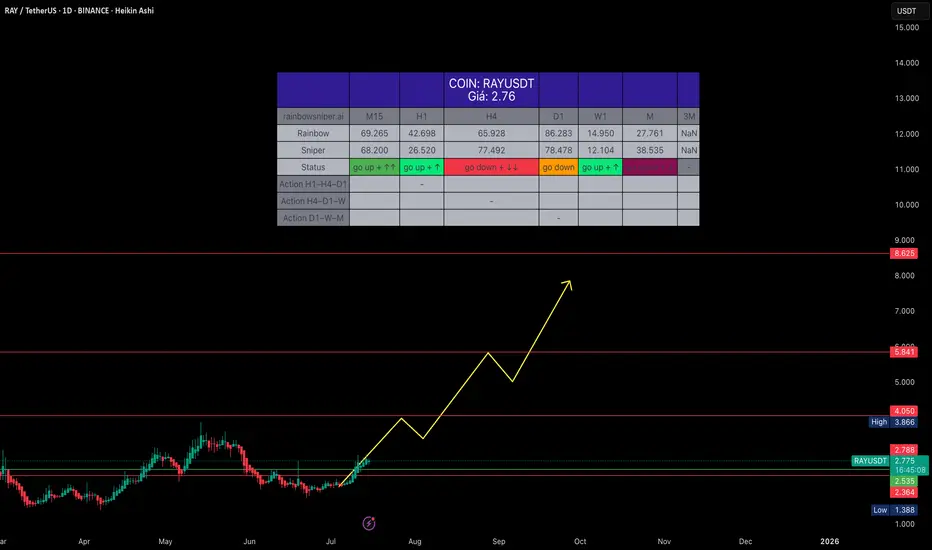
RAYUSDT – Spot Swing Buy RecommendationRAYUSDT – Spot Swing Buy Recommendation
Hello there,
If you're still wondering what to buy in 2025, keep in mind that previous recommendations like XRP, TRX, AAVE, LTC, HBAR, etc., have already passed their ideal buy zones. If you want to buy those, you’ll have to wait for a proper correction in the next 2-3 months.
For now, RAYUSDT is a great candidate. You can wait for a minor pullback to buy and hold for profit targets within 2025.
Trade Type: Spot Swing
Entry: $2.3 – $2.5, even $2.8 is acceptable. This is a long-term signal—a $0.5 difference is negligible.
Take Profit:
_Based on Weekly (W) peaks.
_Reference levels: $4, $5.8, and $9, with a strong preference to hold toward $9.
Timeframe: Be patient—this is a large timeframe play, expect 2-3 months to see real growth.
Market Insight:
_You did the right thing by not DCA during the downtrend.
_Buying in a falling market is like trying to stop an avalanche—not smart.
_Now that the snowball has hit the bottom and shattered, it’s time to climb.
RAYUSDT is in that stage—bottomed and ready for ascent.

$RAYDIUMI pleaded for this trade to pick my entry but it refused.
It hurts to see your prediction play out without getting you some $$$
I am patient and I respect my discipline alot.
I am either making profit or I'm saving my capital.
No two ways!!!

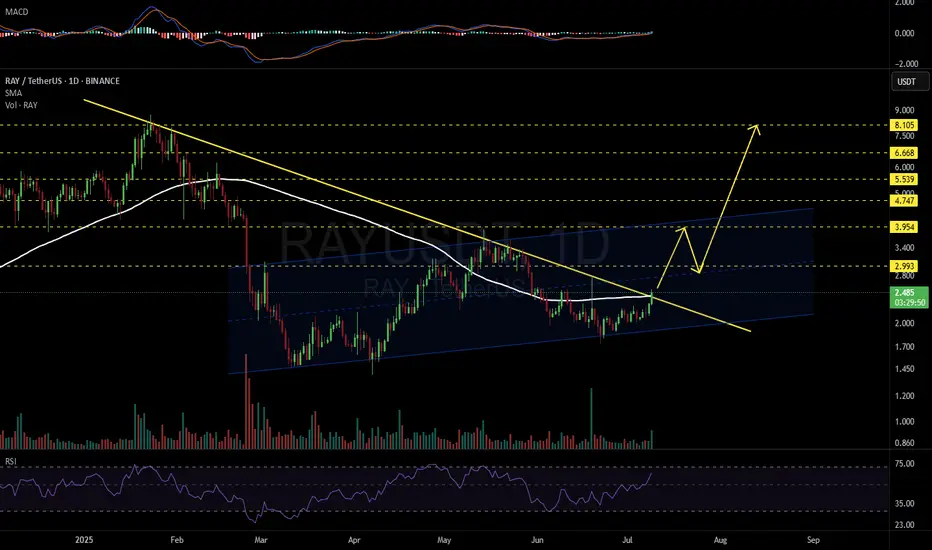
RAYUSDT 1D#RAY is breaking out above the descending resistance and the SMA100 on the daily chart.
If the daily candle closes above the descending resistance, the short-term targets are:
🎯 $2.993
🎯 $3.954
Mid-term targets:
🎯 $4.747
🎯 $5.539
🎯 $6.668
🎯 $8.105
⚠️ As always, use a tight stop-loss and apply proper risk management.
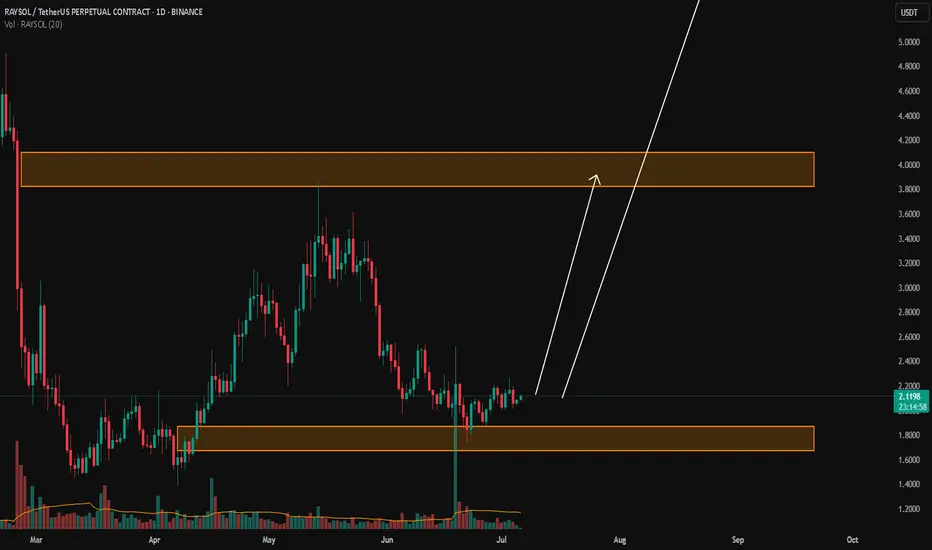
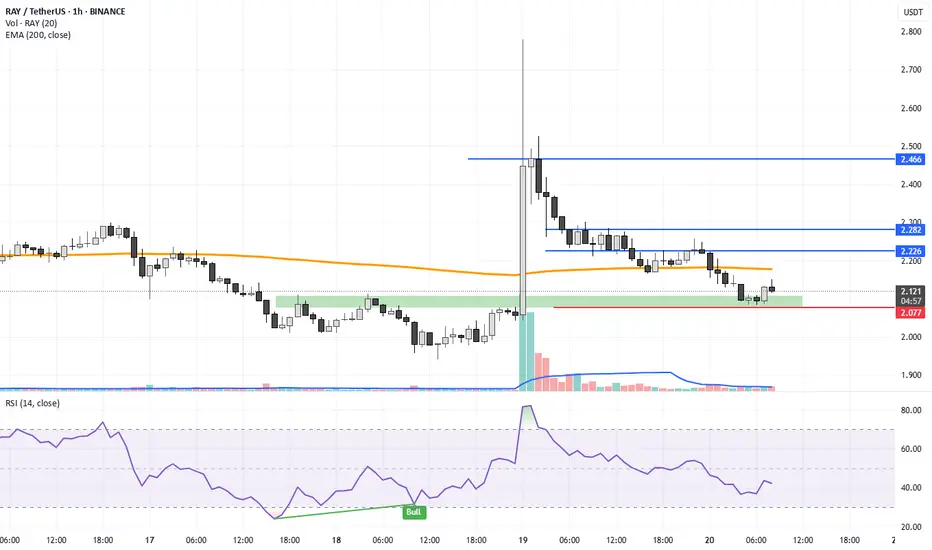
RAYSOL/USDTKey Level Zone: 1.6700 - 1.8700
LMT v2.0 detected.
The setup looks promising—price previously trended upward with rising volume and momentum, then retested this zone cleanly. This presents an excellent reward-to-risk opportunity if momentum continues to align.
Introducing LMT (Levels & Momentum Trading)
- Over the past 3 years, I’ve refined my approach to focus more sharply on the single most important element in any trade: the KEY LEVEL.
- While HMT (High Momentum Trading) served me well—combining trend, momentum, volume, and structure across multiple timeframes—I realized that consistently identifying and respecting these critical price zones is what truly separates good trades from great ones.
- That insight led to the evolution of HMT into LMT – Levels & Momentum Trading.
Why the Change? (From HMT to LMT)
Switching from High Momentum Trading (HMT) to Levels & Momentum Trading (LMT) improves precision, risk control, and confidence by:
- Clearer Entries & Stops: Defined key levels make it easier to plan entries, stop-losses, and position sizing—no more guesswork.
- Better Signal Quality: Momentum is now always checked against a support or resistance zone—if it aligns, it's a stronger setup.
- Improved Reward-to-Risk: All trades are anchored to key levels, making it easier to calculate and manage risk effectively.
- Stronger Confidence: With clear invalidation points beyond key levels, it's easier to trust the plan and stay disciplined—even in tough markets.
Whenever I share a signal, it’s because:
- A high‐probability key level has been identified on a higher timeframe.
- Lower‐timeframe momentum, market structure and volume suggest continuation or reversal is imminent.
- The reward‐to‐risk (based on that key level) meets my criteria for a disciplined entry.
***Please note that conducting a comprehensive analysis on a single timeframe chart can be quite challenging and sometimes confusing. I appreciate your understanding of the effort involved.
Important Note: The Role of Key Levels
- Holding a key level zone: If price respects the key level zone, momentum often carries the trend in the expected direction. That’s when we look to enter, with stop-loss placed just beyond the zone with some buffer.
- Breaking a key level zone: A definitive break signals a potential stop‐out for trend traders. For reversal traders, it’s a cue to consider switching direction—price often retests broken zones as new support or resistance.
My Trading Rules (Unchanged)
Risk Management
- Maximum risk per trade: 2.5%
- Leverage: 5x
Exit Strategy / Profit Taking
- Sell at least 70% on the 3rd wave up (LTF Wave 5).
- Typically sell 50% during a high‐volume spike.
- Move stop‐loss to breakeven once the trade achieves a 1.5:1 R:R.
- Exit at breakeven if momentum fades or divergence appears.
The market is highly dynamic and constantly changing. LMT signals and target profit (TP) levels are based on the current price and movement, but market conditions can shift instantly, so it is crucial to remain adaptable and follow the market's movement.
If you find this signal/analysis meaningful, kindly like and share it.
Thank you for your support~
Sharing this with love!
From HMT to LMT: A Brief Version History
HM Signal :
Date: 17/08/2023
- Early concept identifying high momentum pullbacks within strong uptrends
- Triggered after a prior wave up with rising volume and momentum
- Focused on healthy retracements into support for optimal reward-to-risk setups
HMT v1.0:
Date: 18/10/2024
- Initial release of the High Momentum Trading framework
- Combined multi-timeframe trend, volume, and momentum analysis.
- Focused on identifying strong trending moves high momentum
HMT v2.0:
Date: 17/12/2024
- Major update to the Momentum indicator
- Reduced false signals from inaccurate momentum detection
- New screener with improved accuracy and fewer signals
HMT v3.0:
Date: 23/12/2024
- Added liquidity factor to enhance trend continuation
- Improved potential for momentum-based plays
- Increased winning probability by reducing entries during peaks
HMT v3.1:
Date: 31/12/2024
- Enhanced entry confirmation for improved reward-to-risk ratios
HMT v4.0:
Date: 05/01/2025
- Incorporated buying and selling pressure in lower timeframes to enhance the probability of trending moves while optimizing entry timing and scaling
HMT v4.1:
Date: 06/01/2025
- Enhanced take-profit (TP) target by incorporating market structure analysis
HMT v5 :
Date: 23/01/2025
- Refined wave analysis for trending conditions
- Incorporated lower timeframe (LTF) momentum to strengthen trend reliability
- Re-aligned and re-balanced entry conditions for improved accuracy
HMT v6 :
Date : 15/02/2025
- Integrated strong accumulation activity into in-depth wave analysis
HMT v7 :
Date : 20/03/2025
- Refined wave analysis along with accumulation and market sentiment
HMT v8 :
Date : 16/04/2025
- Fully restructured strategy logic
HMT v8.1 :
Date : 18/04/2025
- Refined Take Profit (TP) logic to be more conservative for improved win consistency
LMT v1.0 :
Date : 06/06/2025
- Rebranded to emphasize key levels + momentum as the core framework
LMT v2.0
Date: 11/06/2025
RAYUSDT 1W AnalysisRAY ~ 1W Analysis
#RAY Buy back gradually from this support block with a short term target of at least 15%+ from here.
RAYDIUM is looking for support. Watchlist material. RAY is looking to find its bottom. RR is in favour of a long. Horizontal support is a clear invalidation of the bullish thesis. A break below confirms a lower low.
Full TA: Link in the BIO
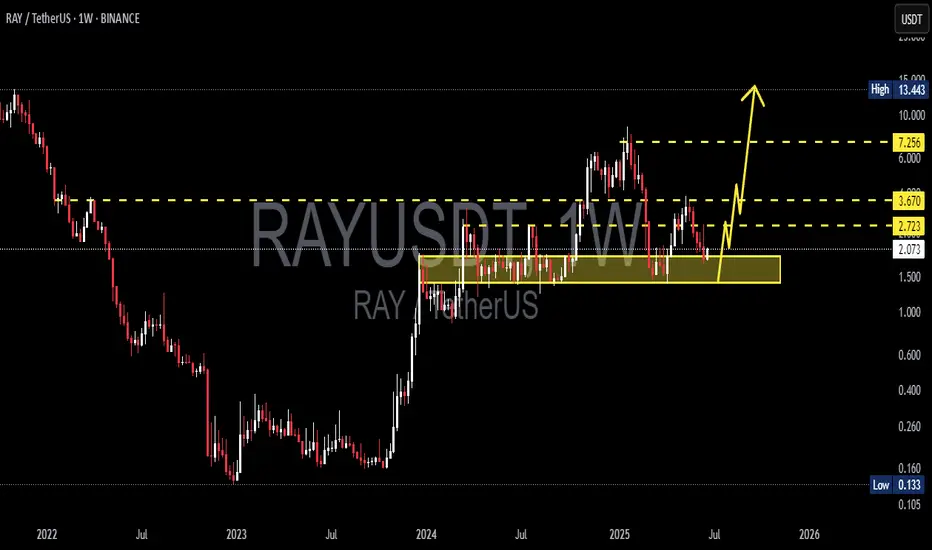
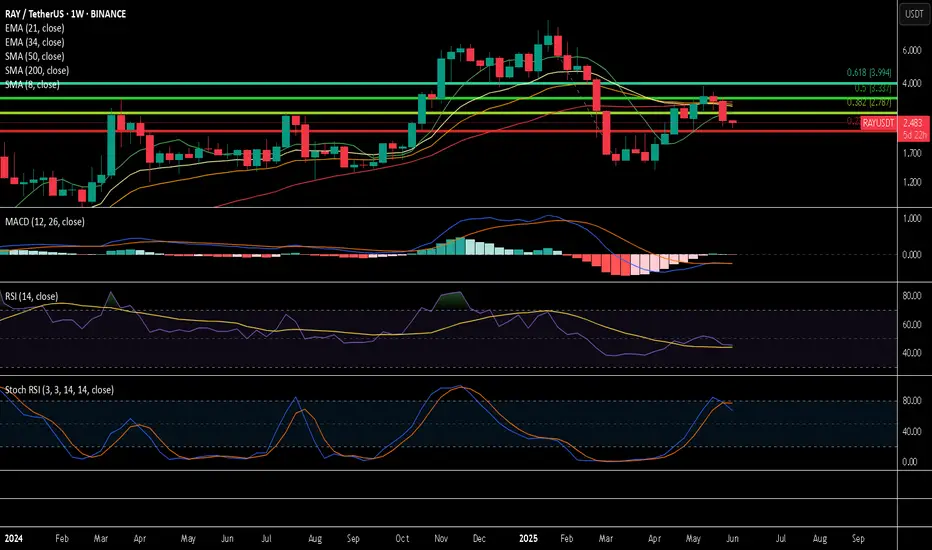
RAY Outlook: Is a -60% Drop the Reset We Need?RAY marked its bottom in December 2022 at just $0.133, entering a prolonged accumulation phase that lasted nearly a year. Then, in late 2023, it broke out into an explosive bull run, skyrocketing +6421% over 756 days and peaking at an impressive $8.70.
This run completed a full five-wave Elliott Wave structure. After topping out, RAY dropped -84% down to $1.388 — likely marking the Wave A correction. A strong relief rally followed into the $4 region before facing rejection at the yearly VWAP, possibly completing Wave B. Now, all signs point toward us being in the final Wave C of the larger corrective structure.
So, where could Wave C bottom out?
🔍 Fibonacci Confluence Zones (Log Scale)
Let’s assess the key levels with log-scaled Fibonacci tools:
🔹 Fib Retracement (from $0.133 low to $8.7 high):
The 0.618 fib retracement lies at $0.658
🔹 Trend-Based Fib Extension (Wave A → B projection for Wave C):
1.0 TBFE sits at $0.617
✅ These two levels align nearly perfectly, giving us a strong confluence zone between $0.62 and $0.66
Additional Confluences
Anchored VWAP Bands:
The 0.618 VWAP band multiplier also aligns with this $0.6 zone
Liquidity Perspective:
This level would wipe out long positions built over the past 550 days — clearing and potentially resetting the market
🚨 Fair Value Trend Model (FV Trend Model):
According to my Fair Value Trend Model indicator, the fair value for RAY currently sits around $0.78 — right in line with the broader confluence zone. This model uses log-log regression to estimate Bitcoin’s and other assets’ fair-value over time.
👉 Feel free to use the indicator
Just head over to my profile, click on the “Scripts” tab, and you can add the Fair Value Trend Model to your charts to experiment with it yourself.
Together, these technical elements form a compelling high-probability zone for long setups around $0.6–$0.8.
💡 Educational Insight — Why 0.618 is a Critical Fib Level
In Elliott Wave theory and harmonic trading, the 0.618 retracement is known as the "Golden Ratio" — often serving as a magnet for price during corrections. When paired with a 1.0 trend-based fib extension, it can mark exhaustion zones where Wave C concludes.
🔭 Summary: What’s Next for RAY?
Potential bottom zone: $0.61–$0.78
Watch for reversal signals like bullish candlestick patterns, volume spikes, or divergences
A drop to this zone would represent a -60% drawdown from current levels
Remember: High-probability setups don’t come every day — patience is your edge
Set alerts. Stay prepared.
_________________________________
💬 If you found this helpful, drop a like and comment!
Want breakdowns of other charts? Leave your requests below.
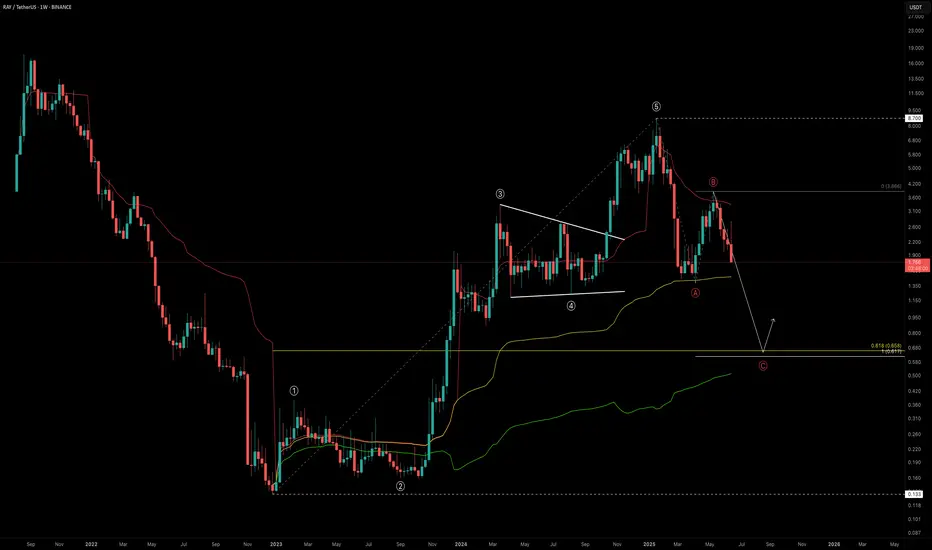
RAY the end or just the start?To first look at Ray we can start with RAYUSDT and move to RAYSOL and RAY BTC.
RAY is not sitting below all of the moving averages. Not an ideal position.
So far MACD cross down does not mean much as the week has not ended yet. Ideally to stay bullish it need to end the week not crossed down.
Stoch RSI cross down
Below 0.015 there is elevated risk that RAYSOL puts in a lower local low.
RAYBTC also not looking great.
With these charts it's pretty hard to make the case why I am long RAY. Let's try some long term fundamentals and see if that is a better picture.
Ray is all about the saying own the shovels. As an exchange the better Solana does the better Ray likely does. It's a widely known DEX it's weaknesses are Solana not getting trade volumes again. Competitors where other DEX are better. Also DEX aggregators have risks the volume does not get sent to Ray.
Disclaimer: The information provided in this post is for educational and informational purposes only. It does not constitute financial advice, investment recommendations, or a solicitation to buy or sell any financial instruments. All investments involve risk, and the past performance of a security, market, or trading strategy does not guarantee future results. I am not a financial advisor. Please conduct your own thorough research and consult with a qualified financial professional before making any investment decisions. You are solely responsible for any investment decisions you make.
RAYDIUM LONG SETUP ALL trading ideas have entry point + stop loss + take profit + Risk level.
hello Traders, here is the full analysis for this pair, let me know in the comment section below if you have any questions, the entry will be taken only if all rules of the strategies will be satisfied. I suggest you keep this pair on your watchlist and see if the rules of your strategy are satisfied. Please also refer to the Important Risk Notice linked below.
Disclaimer
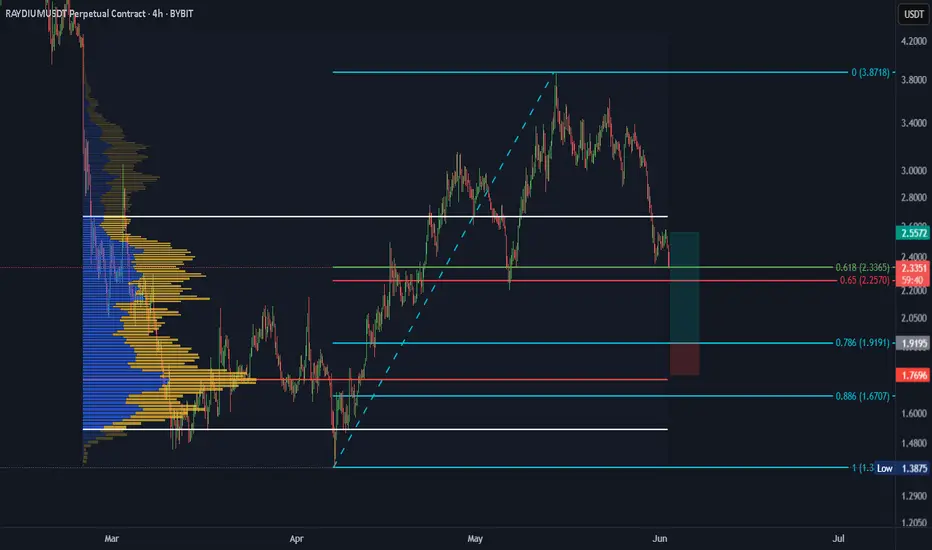
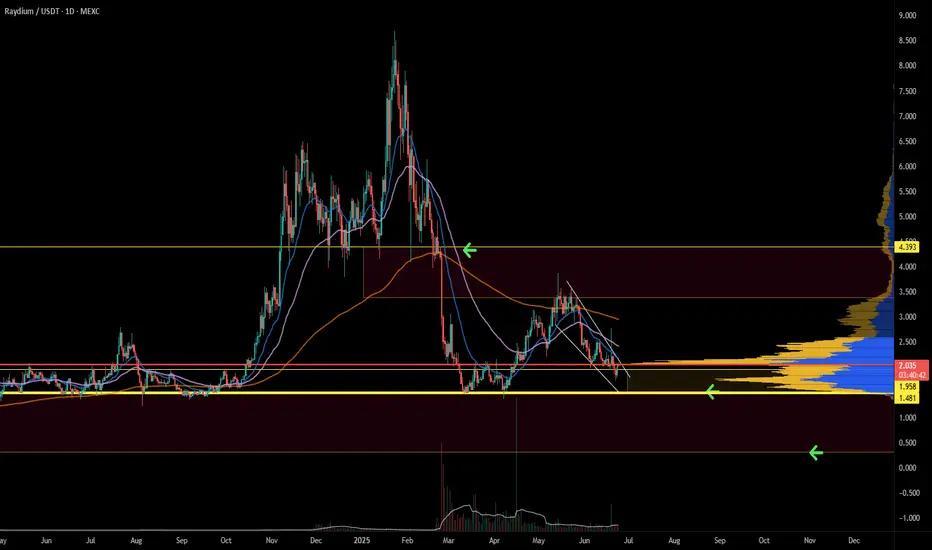
RAY (Raydium) – Long Swing Trade Setup from Major SupportRAY is trading at a major support zone between $2.85 – $3.25, which historically has acted as a base for significant upward moves. With strong support beneath and favorable upside targets, this presents a solid long swing opportunity with clear invalidation.
🔹 Entry Zone:
$2.85 – $3.25 (key support and previous accumulation range)
🎯 Take Profit Targets:
🥇 $4.23 (previous resistance and psychological level)
🥈 $5.00 (key breakout level and round number target)
🛑 Stop Loss:
$2.84 (tight invalidation just below support zone)

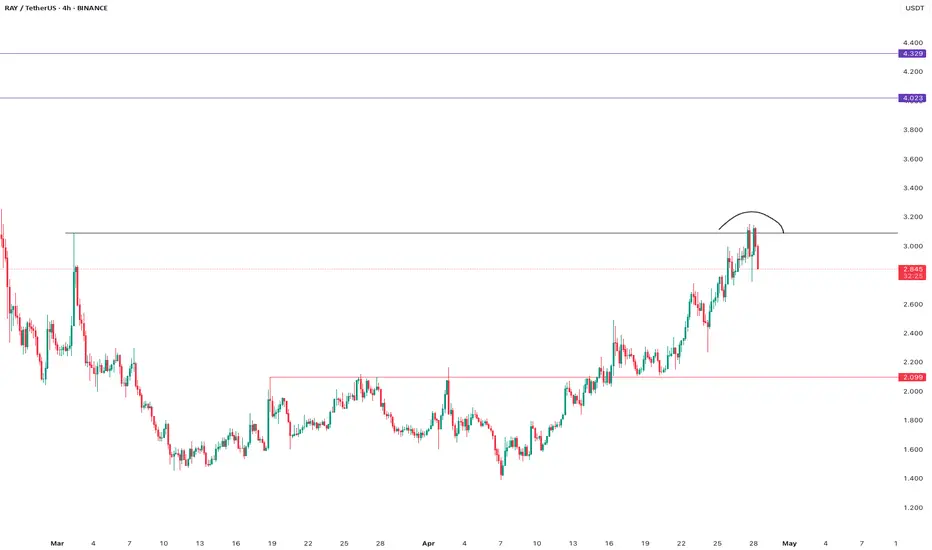
Breaks Out of Red Resistance Zone 🚨 NASDAQ:RAY
Breaks Out of Red Resistance Zone 🚨
NASDAQ:RAY
has successfully broken out of the red resistance zone, which was part of a symmetrical pattern. This breakout could signal a strong bullish move.
📈 Technical Overview:
Pattern: Symmetrical
Breakout Level: Red resistance zone.
🎯 Potential Targets: To be determined upon further price action.
RAYUSDTLONG SET UP RAYDIUM 📈
market optimistic to going up to reach resistance (orange line)
please manage risk your self max5% no over Leverage cause this mid/long trade (swing trade).
support :
1.strong trend price above MA50
2.Initial break (engulfing 4H)
3.Dominan break 4H
4.stop loss support bellow 👇
shortBearish diverguence H4 is in an important reciaticism and is being generated a distribution zone therefore minimum risk short
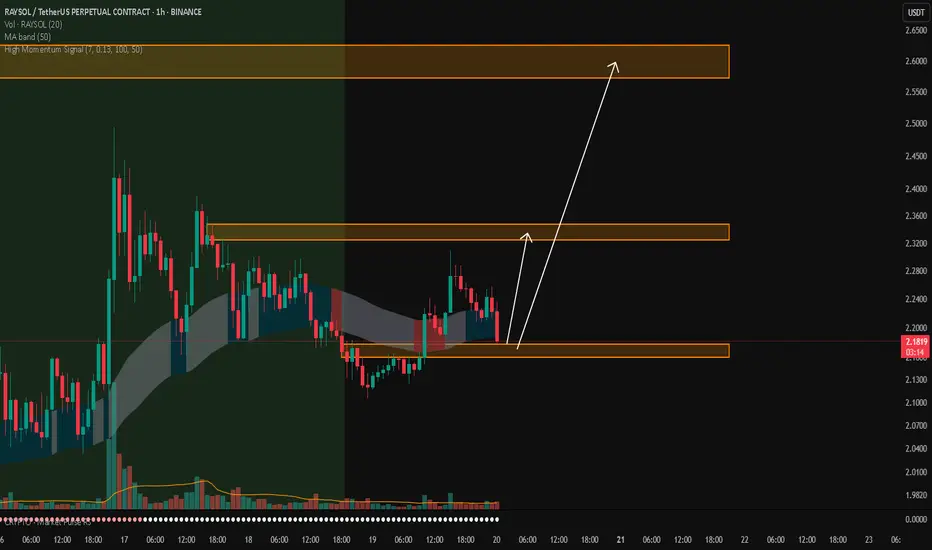
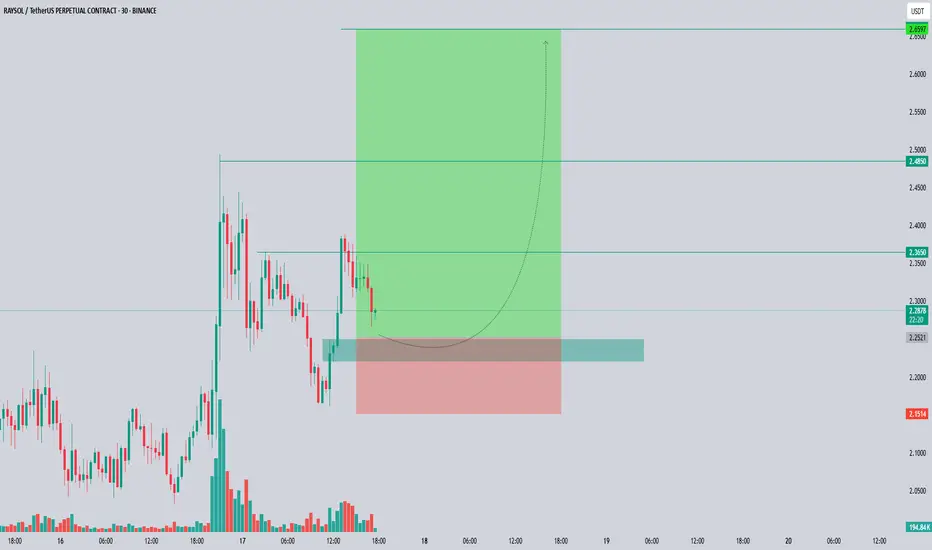
RAYSOL/USDTKey Level Zone: 2.1600 - 2.1780
HMT v8.1 detected. The setup looks promising, supported by a previous upward/downward trend with increasing volume and momentum, presenting an excellent reward-to-risk opportunity.
HMT (High Momentum Trending):
HMT is based on trend, momentum, volume, and market structure across multiple timeframes. It highlights setups with strong potential for upward movement and higher rewards.
Whenever I spot a signal for my own trading, I’ll share it. Please note that conducting a comprehensive analysis on a single timeframe chart can be quite challenging and sometimes confusing. I appreciate your understanding of the effort involved.
Important Note :
Role of Key Levels:
- These zones are critical for analyzing price trends. If the key level zone holds, the price may continue trending in the expected direction. However, momentum may increase or decrease based on subsequent patterns.
- Breakouts: If the key level zone breaks, it signals a stop-out. For reversal traders, this presents an opportunity to consider switching direction, as the price often retests these zones, which may act as strong support-turned-resistance (or vice versa).
My Trading Rules
Risk Management
- Maximum risk per trade: 2.5%.
- Leverage: 5x.
Exit Strategy
Profit-Taking:
- Sell at least 70% on the 3rd wave up (LTF Wave 5).
- Typically, sell 50% during a high-volume spike.
- Adjust stop-loss to breakeven once the trade achieves a 1.5:1 reward-to-risk ratio.
- If the market shows signs of losing momentum or divergence, ill will exit at breakeven.
The market is highly dynamic and constantly changing. HMT signals and target profit (TP) levels are based on the current price and movement, but market conditions can shift instantly, so it is crucial to remain adaptable and follow the market's movement.
If you find this signal/analysis meaningful, kindly like and share it.
Thank you for your support~
Sharing this with love!
HMT v2.0:
- Major update to the Momentum indicator
- Reduced false signals from inaccurate momentum detection
- New screener with improved accuracy and fewer signals
HMT v3.0:
- Added liquidity factor to enhance trend continuation
- Improved potential for momentum-based plays
- Increased winning probability by reducing entries during peaks
HMT v3.1:
- Enhanced entry confirmation for improved reward-to-risk ratios
HMT v4.0:
- Incorporated buying and selling pressure in lower timeframes to enhance the probability of trending moves while optimizing entry timing and scaling
HMT v4.1:
- Enhanced take-profit (TP) target by incorporating market structure analysis
HMT v5 :
Date: 23/01/2025
- Refined wave analysis for trending conditions
- Incorporated lower timeframe (LTF) momentum to strengthen trend reliability
- Re-aligned and re-balanced entry conditions for improved accuracy
HMT v6 :
Date : 15/02/2025
- Integrated strong accumulation activity into in-depth wave analysis
HMT v7 :
Date : 20/03/2025
- Refined wave analysis along with accumulation and market sentiment
HMT v8 :
Date : 16/04/2025
- Fully restructured strategy logic
HMT v8.1 :
Date : 18/04/2025
- Refined Take Profit (TP) logic to be more conservative for improved win consistency
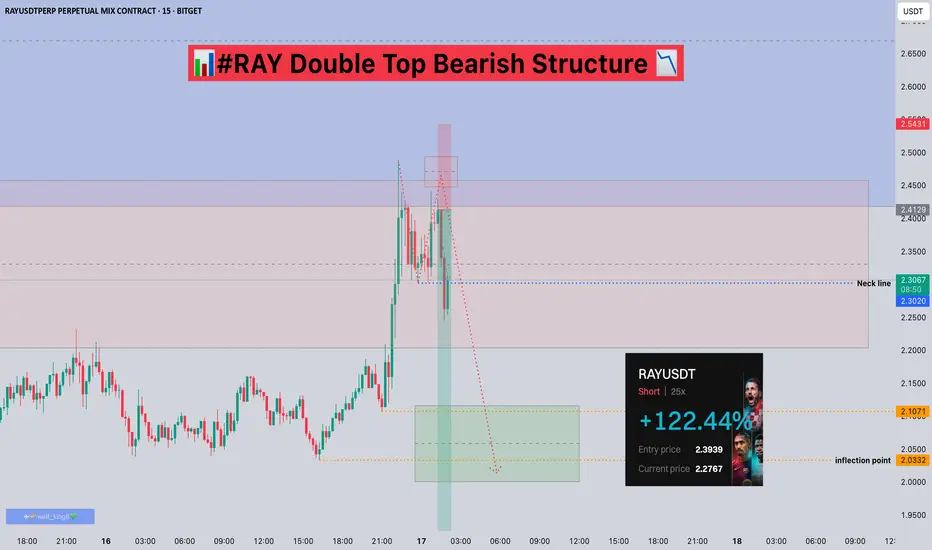
#RAY Double Top Bearish Structure📊#RAY Double Top Bearish Structure 📉
🧠From a structural perspective, the goals of the bullish structure have all been achieved, and the target area overlaps with the blue resistance area, and we have built a bearish double top structure in the overlapping resistance area, so we are likely to enter the adjustment phase, be cautious about bullishness!
Let's see 👀
🤜If you like my analysis, please like 💖 and share 💬
BITGET:RAYUSDT.P
RAYSOL/USDT – READY TO BLAST OFF? PRIME LONG SETUPThis is where smart money is likely to reaccumulate before pushing price higher.
We're targeting internal liquidity levels and prior highs with a clean risk-reward structure.
Confirmation can come from a bullish reaction or engulfing candle within the zone.
Entry Zone: 2.25 – 2.28
Targets:
TP1: 2.365
TP2: 2.485
TP3: 2.660
Stop Loss: 2.151
DYOR:
This idea is for educational purposes and reflects a personal trading plan.
Always do your own research, use strict risk management, and wait for confirmation before executing.
#RAYDIUM #RAY #RAYSOL #RAYUSDT
Raydium support zonesRay is currently moving up longer-term. A trade could be caught on the zones shown
