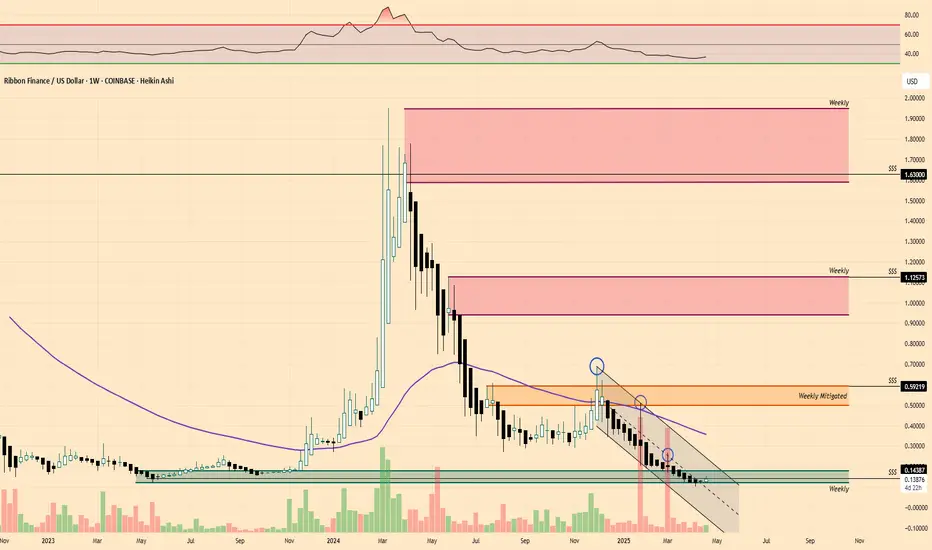
$RBN | Showing glimpses of lifeAdded to my Altcoin Portfolio:
• COINBASE:RBNUSD @ $0.13876 bringing my average cost from $0.17 -> $0.1511
Notes/Thoughts: Typically I would wait until the Weekly Close for my buys as it’s only Tuesday but I like the market pump currently & perceived momentum plus price is still held in a Weekly Demand area without collapse.
RBNUSD trade ideas
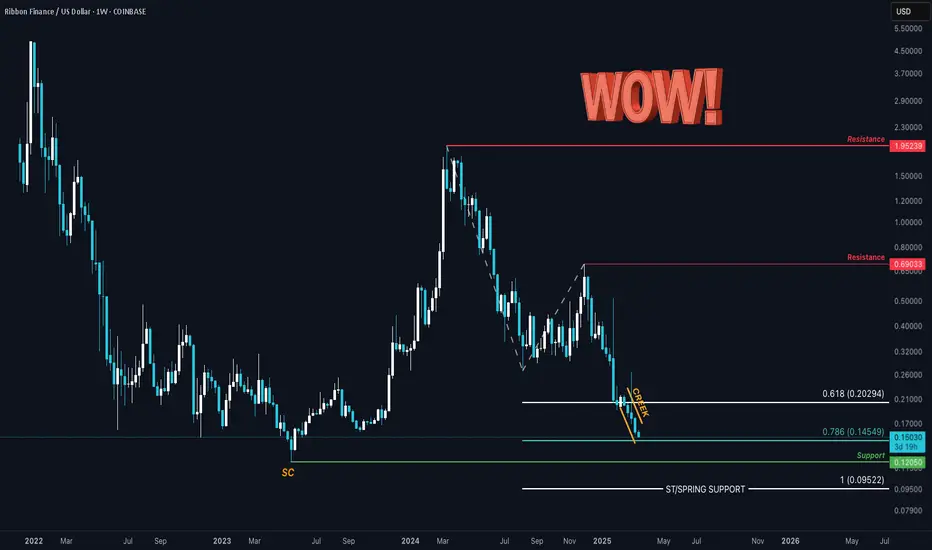
DEEP value buy for RBN incoming ... COINBASE:RBNUSD
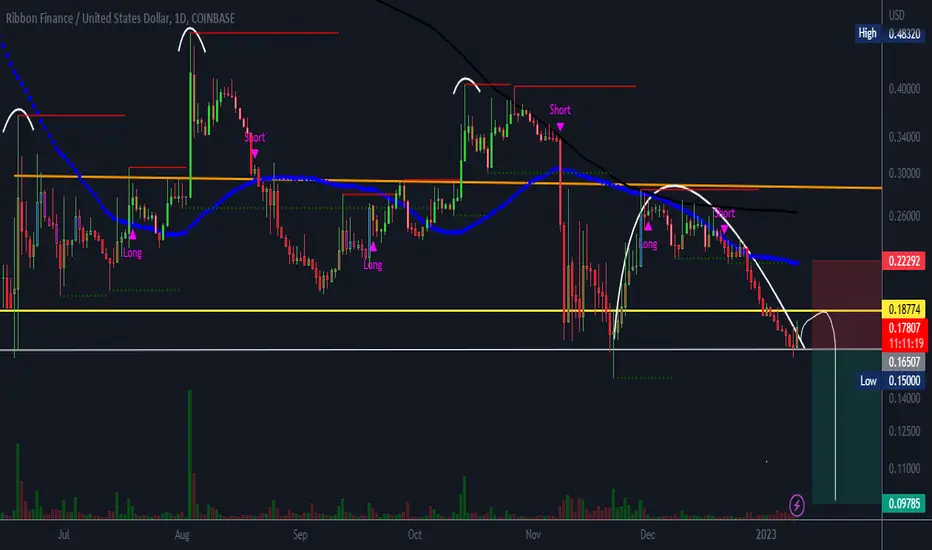
Ribbon Finance - Printing what resembles a Wyckoff Creek, possibly making a ST attempt.
Price is inside the 1:0.618 GW extension. If it were to discover a lower low, it could stab down slightly lower than SC support. Or perhaps a bit further: I have a 1:1 extension as potential support if a deeper ST were to occur.
With a Market Cap of 14.4M, this DeFi token could bolt on some serious capital.
Ribbon Finance is a DeFi protocol built on Ethereum that offers structured products, such as automated options strategies to generate yield for users. The RBN token is used for governance, allowing holders to vote on protocol upgrades and decisions.
-Not Financial Advice-
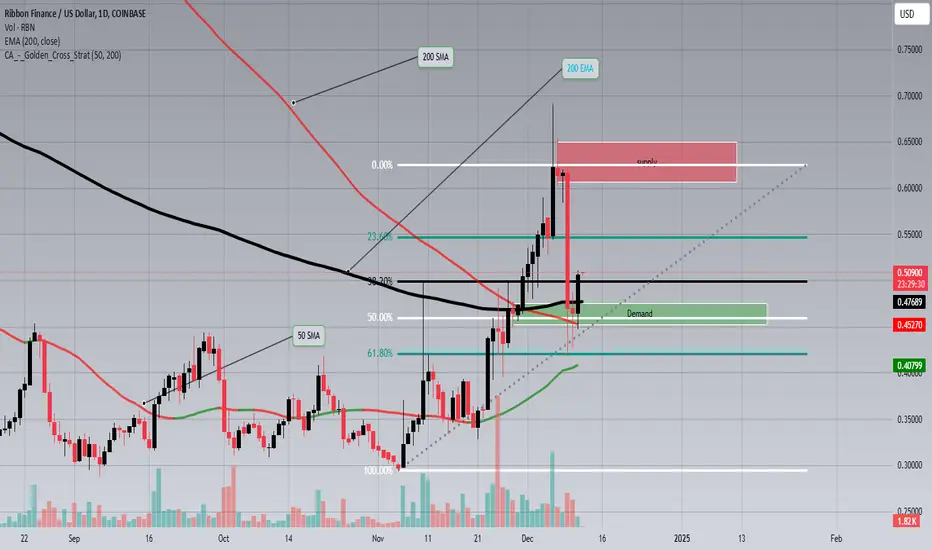
RBDUSD 1DRBN just tested its Demand area and 200 EMA with a long wick candle and then a bullish candle, also there is price action forming in the golden zone of the Fibonacci level. In addition, there is also possibility of a golden cross with the 50 SMA and 200 SMA in a few days possibly. There is a small chance of recovery after Monday's pull back to the 200 EMA. Have a safe day
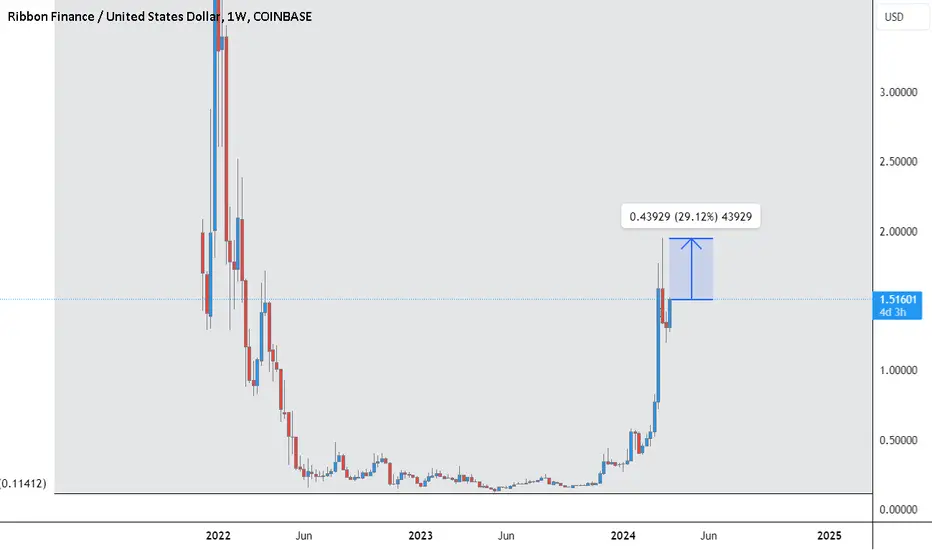
Laggard RBNUSD 150% move likely in rotation to ETH ecosystemAs ETHBTC is close to confirming a bottom by closing above 0.041 on the Weekly, and with ETH pushing north of EUROTLX:4K , we're seeing some laggards beginning to gain momentum with outsized upside potential. The ETH ecosystem has opportunity. #ribbonfinance #RBNUSD could push 2x gains over the next few weeks as the RSI is 60 and rising, with the 10WMA sloping up and recently crossing the 20WMA. Use the Fibonacci extension levels as take profit guides, trimming on the way up to a higher consolidation level. Don't sell too early. Wait for RSI to move into overbought territory and flatten out before trimming the majority of your position.
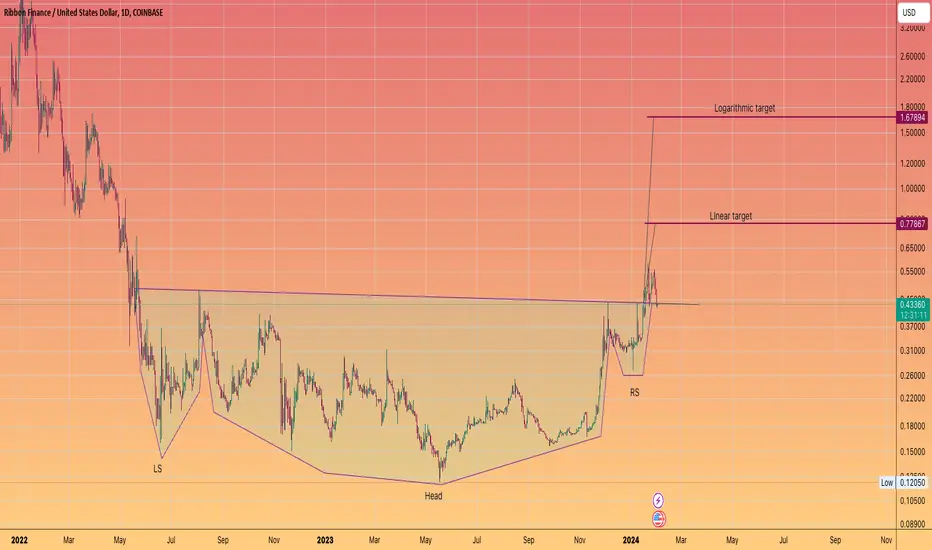
Ribbon Finance #RBN Inverse Head & ShouldersIt's #DEFI
Defi season hasn't really kicked off yet --- but it will
I mean that is literally one of th big Goals of #crypto right?
To decentralise Finance?!
I've mentioned Ribbon previously as a token to watch
So we have a potential breakout & neckline retest going on right now
Could be an opportunity.
As always
your risk
your reward
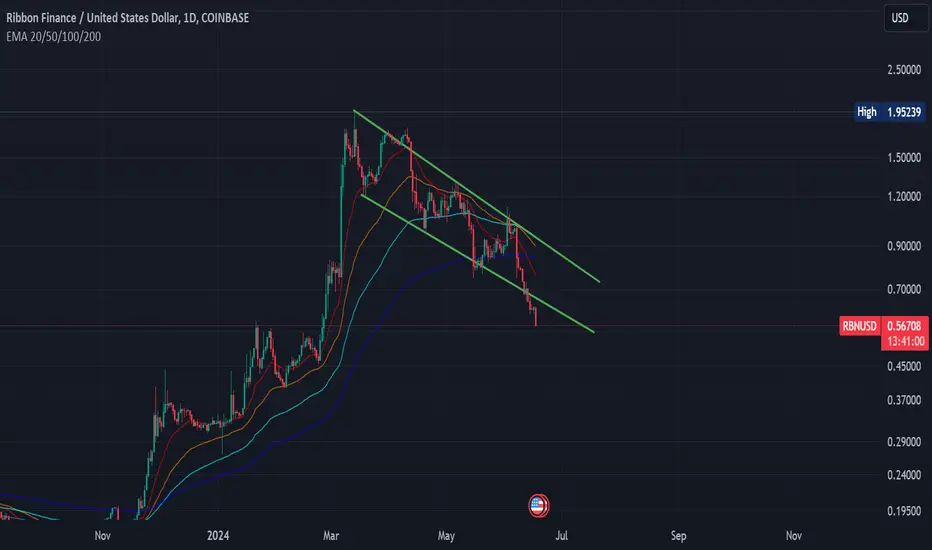
RBN Has Broken DownChart is pretty obvious - RBN had formed a falling channel with a bullish bias, however it has broken down from that in the past few days and looks very bearish for the short term.
RBN showing a strong Momentum and ready to fly BTC.D seems to be losing its grip, breaking down from the rising wedge on the weekly TF. But fear not! 📉 As the dominant coin falters, a surge of strength emerges in the realm of high-volume projects. 🌊 Check the relative strength: two weeks of steady positivity! Amidst this dynamic landscape, RBN (Ribbon Finance) shines bright on my radar. 🚀 Keep an eye on the money flow from DEFI and DEX wallets – it's a key indicator signaling potential gains. 💰 #Crypto #RBN #DeFi #Trading"
Ribbon Finance BuyRibbon Finance should have a clear pathway to another 100% increase here. It's earnings are very high compared to its market cap. Furthermore, a clear breakout is occurring. Keep your eyes peeled!

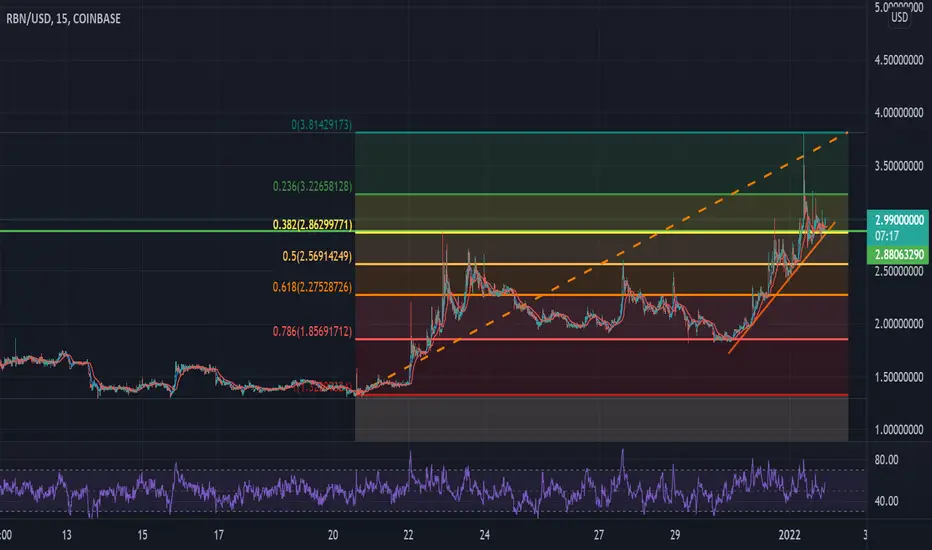
RBN All-Time-HighRBN to All-Time-High?
All-Time-High $5
Currently trading at $0.30
Stoch RSI Bullish
Rsi Neutral
Macd Neutral
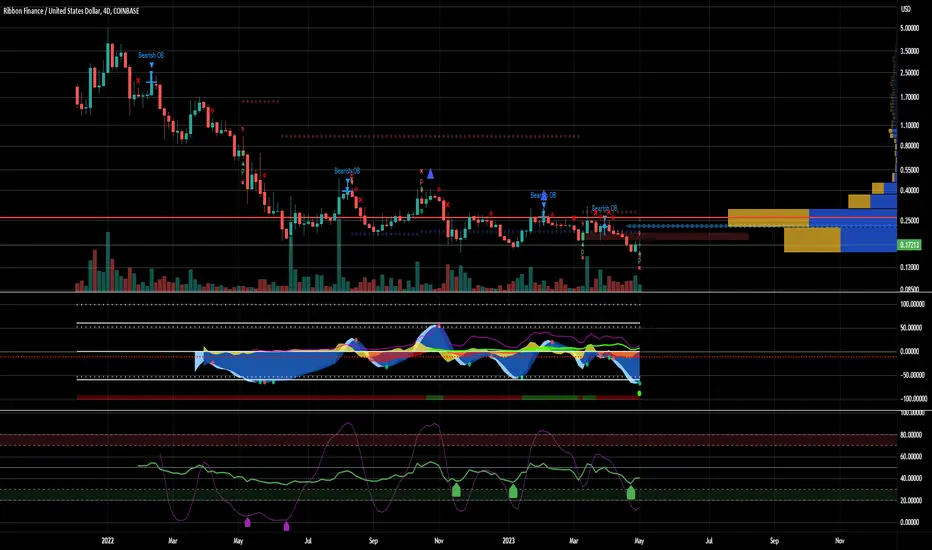
RBN/USD LongUpon analyzing the four-day timeframe, it is apparent that Ribbon Finance's token price has undergone a significant decline. Despite this, the protocol appears to have promising potential, leading to the possibility of a favorable long position while DeFi investments are currently out of favor with investors.
However, it is essential to note that there are some obstacles to overcome in the short term, specifically a sell order block and a bearish order block, which must be surpassed before the token price can reach its short-term peak with greater ease. While the current trend has been unfavorable for Ribbon Finance's token price, the underlying protocol's potential merits and current signals in Market Cypher B show a possible opportunity for the trend to change.
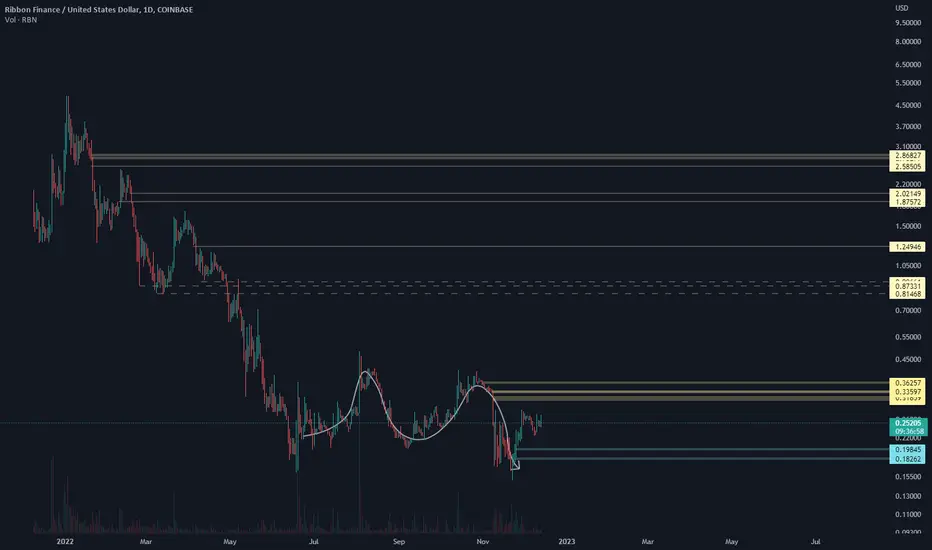
RBNUSD accumulationRBNUSD is showing signs of local M bottoming. Of course it depends on how the macro market behaves, but volume looks strong and price action is much stronger than other coins, which have mostly been making lower lows. This is on my radar, let's see what happens.
RBNUSDT$RBN is bearish on the HTF, it has formed a head and shoulder pattern and trying to form a cup and handle formation which are all bearish, I expect it to breakdown the current resistance and continue its downward movements soon. Targets are shown in the chart.
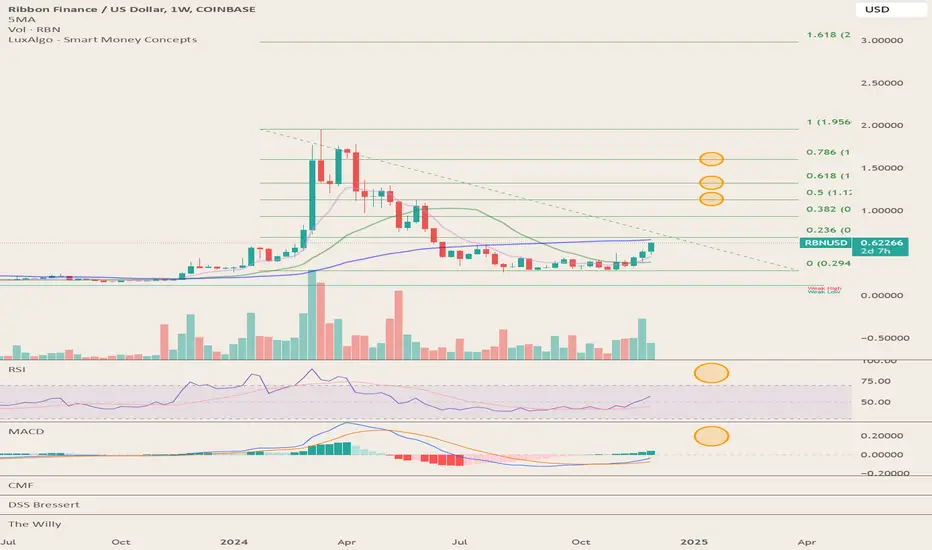
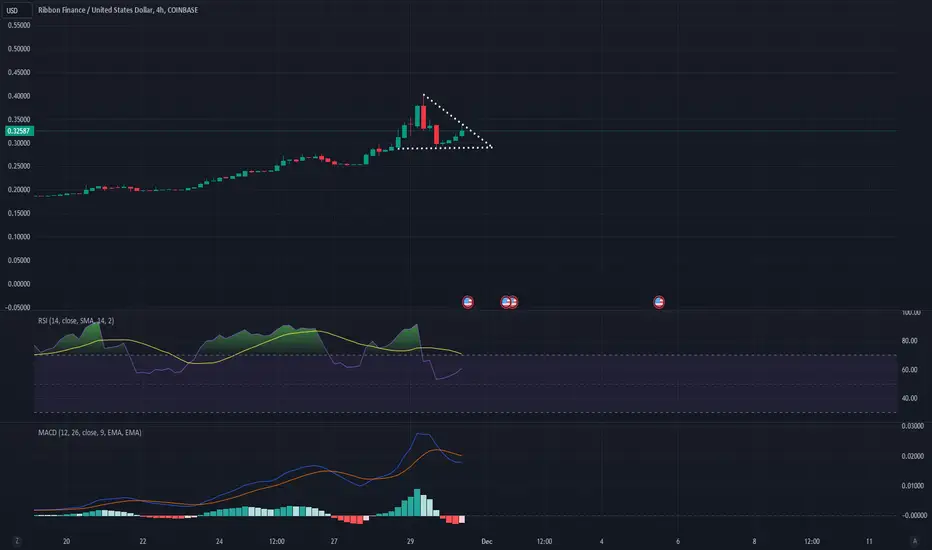
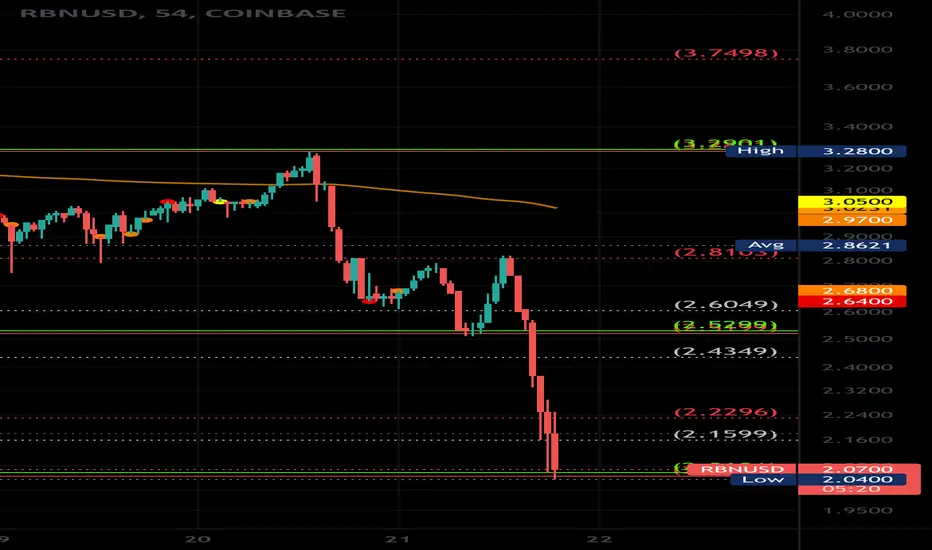
Ribbon Finance: Price Action AnalysisHere's a breakdown of Ribbon Finance (RBN) volume-spread analysis. All signs are pointing north. Let's see if it can keep the momentum and take us up to the golden Fibonacci profit target. I set limit sells at the .272 and .618 junctures and don't risk holding past the bear orderblocks hovering above those points, especially above the 1.618% which closes out liquidity void #2 as indicated on the chart. Better to be safe than sorry!
**Be sure to subscribe for more clean, accurate, easy-to-follow swing charts with high win ratios (80-85% average). I trade crypto fulltime and handpick all the runners myself after conducting a series of volume-to-spread reads and Wyckoff schematic comparisons.
Not financial advice. Always DYOR and trade at your own risk.

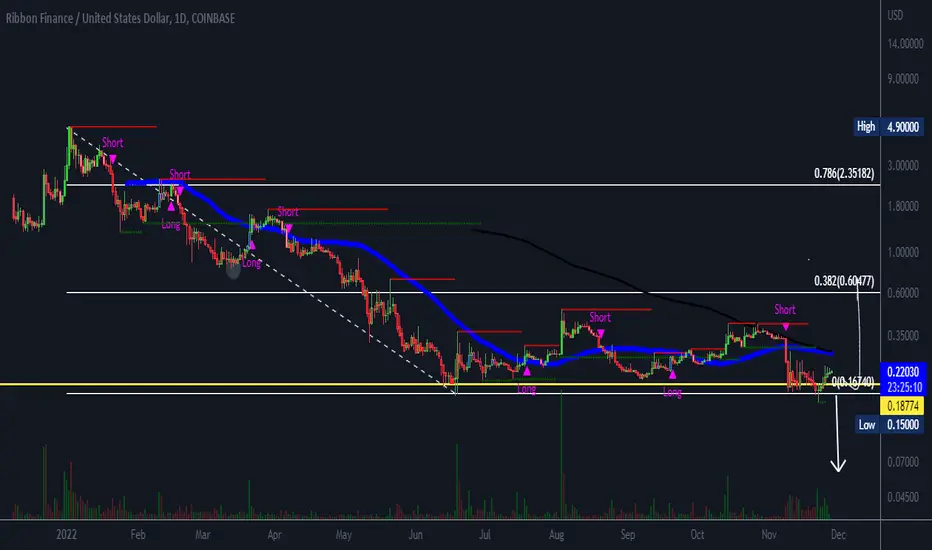
RBNUSDT$RBN is trading within a range, with range high and low at $0.60477 and $0.16740. It can go both ways, depending on #BTC's movements. If the support holds, I expect a reversal to the range high price and if it doesn't, a breakdown of the support.
RBNUSDLast Week's chart is still valid. For this week, price has to retest and break the support now resistance at $1.295 range, or retest the support at $0.81, I expect a bearish move as shown in the indicator, confirmation would be gotten from $BTC weekly close.
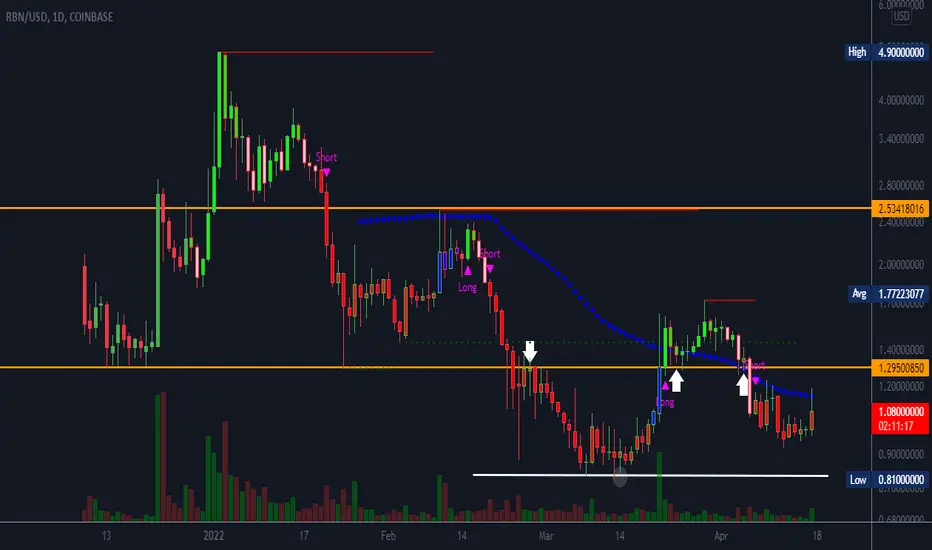
RBNNot many changes to the $Rbn chart during the week. Still bullish on the HTF, so the price has to break the resistance at $2.53, and if successful, retest the ATH or retest and break down the support at $1.29 for a bearish move.
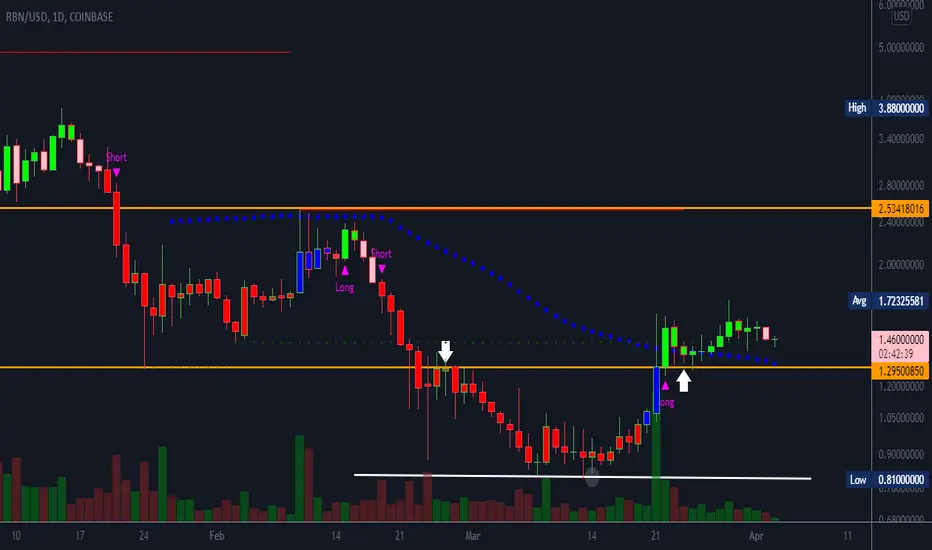
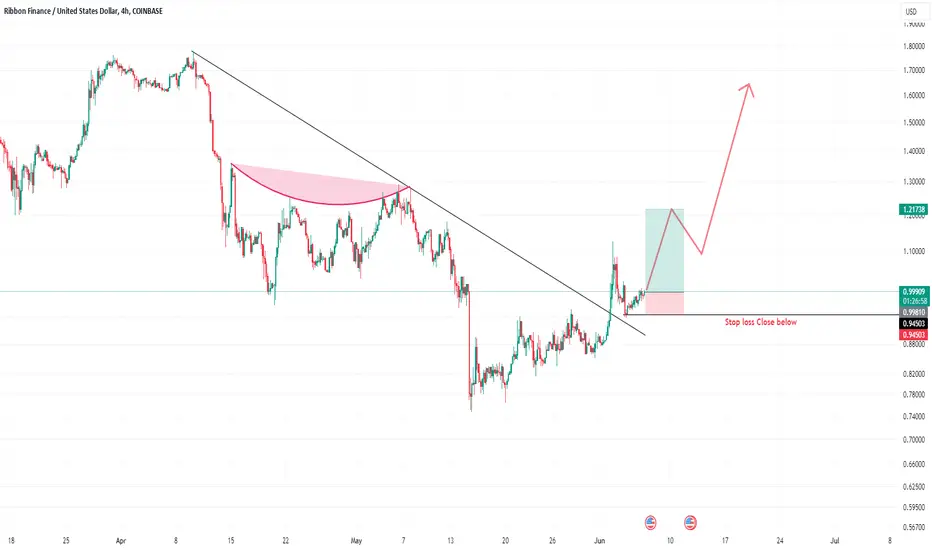
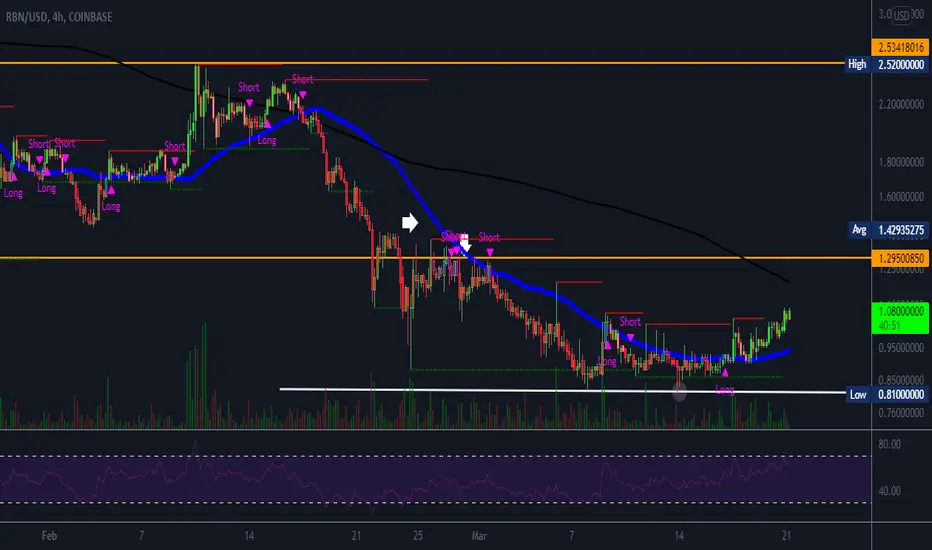
RBNPrice is on recovery mode. Showing long on the 4HR timeframe, the support at the $0.82 mark is holding nicely, so I expect a retest of the resistance at $1.29, if it breaks it, then hopefully we have the needed push to retest the next resistance.
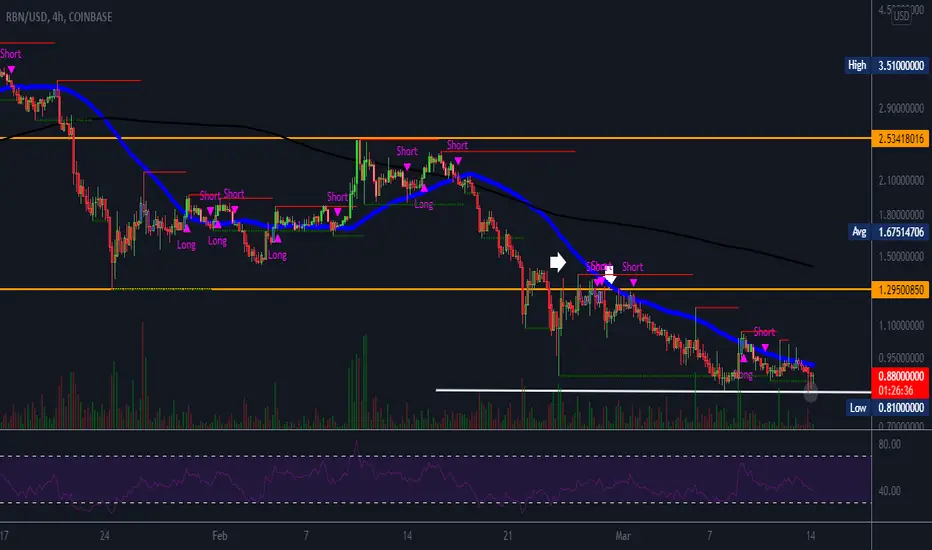
RBNThe trend is still bearish on the higher timeframe. Currently retesting the support at $0.81 for the second time, breaks the support and downtrend continues or breaks the resistance at $1.29 for a bullish course.
NB: I am new to charting and open to corrections. Thanks
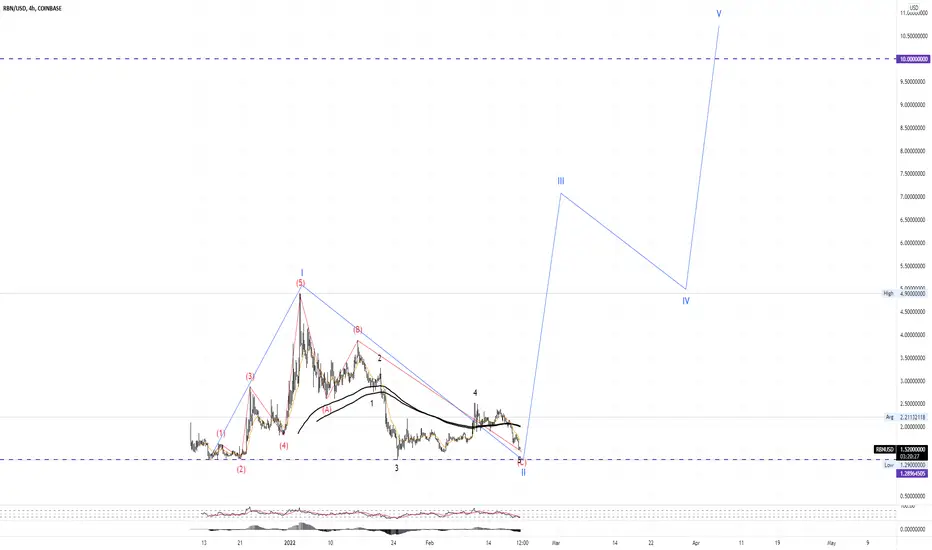
If RBN doesn't go below $1.29, we'll see a 600% bullish move!If RBN doesn't go below $1.29 and bounces above this price level, then it will go up for a 600% increase!
Rbn Long Swing | RBNUSDT | LONG @ 1.72 - 1.77 | TP @ 1.79, 1.81, 1.83, 1.85, 1.87 | SL @ 1.42 | PATTERN = BULLISH MACD CROSSOVER | COINBASE |
Swing trade idea. Kindly follow targets and stop loss. Will update with new targets once all 5 are achieved.

RBN Reversal About To Begin (And Right On Target)Ribbon Finance (RBN) is at a critical support price level, and lagging behind all other Alts in mean-reversion after todays bloodbath.
STRONG BUY.
Thanks me later.
RBN, the diamond in the roughThe website is beautiful, it speaks for itself :
w w w . r i b b o n . f i n a n c e