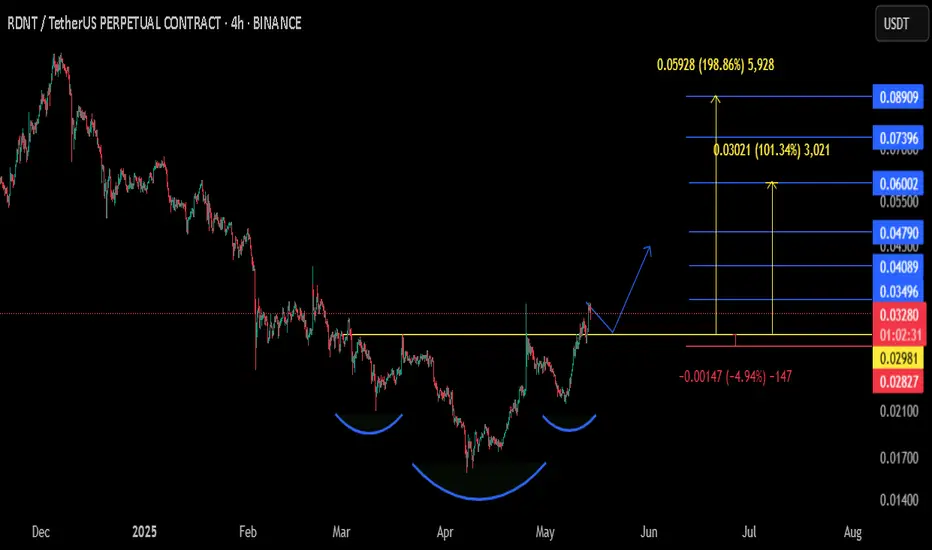
$RDNT - Ready to fly?HIGH RISK
BINANCE:RDNTUSDT.P
NASDAQ:RDNT
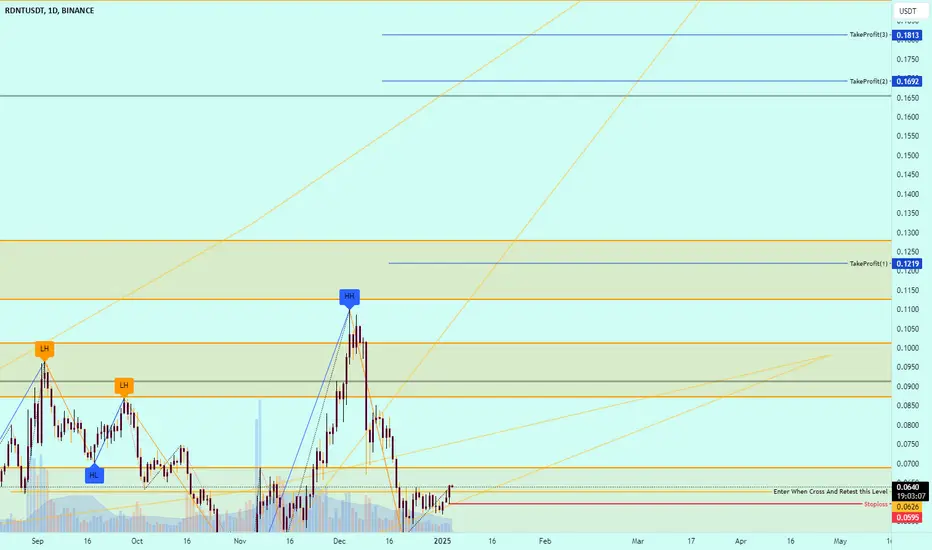
The price recently broke out from the Inverted head and shoulder pattern, expecting the price to retest the yellow line.
Wait for the price action around the yellow line before entering it.
TP: Blue lines
SL: Redline / 4H CC below
Note: It'll be a
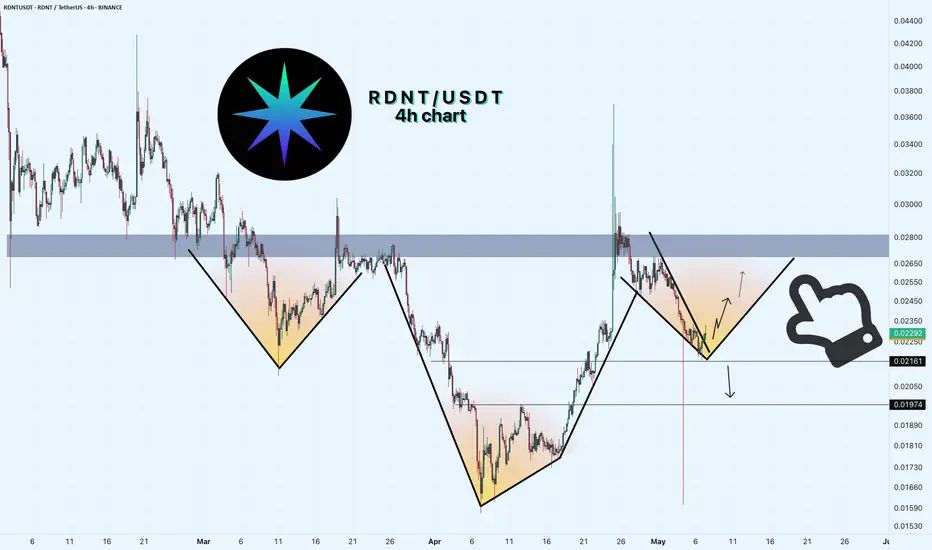
RDNT/USDT 4H Chart: Inverted Head and Shoulders? Hey traders! Let’s dive into this 4-hour RDNTUSDT chart.
Radient Capital is setting up a classic pattern that could signal a big move!
We’re seeing an inverted head and shoulders forming, with the price breaking above the resistance of Wedge around $0.2290. The "head" bottomed out near $0.1590
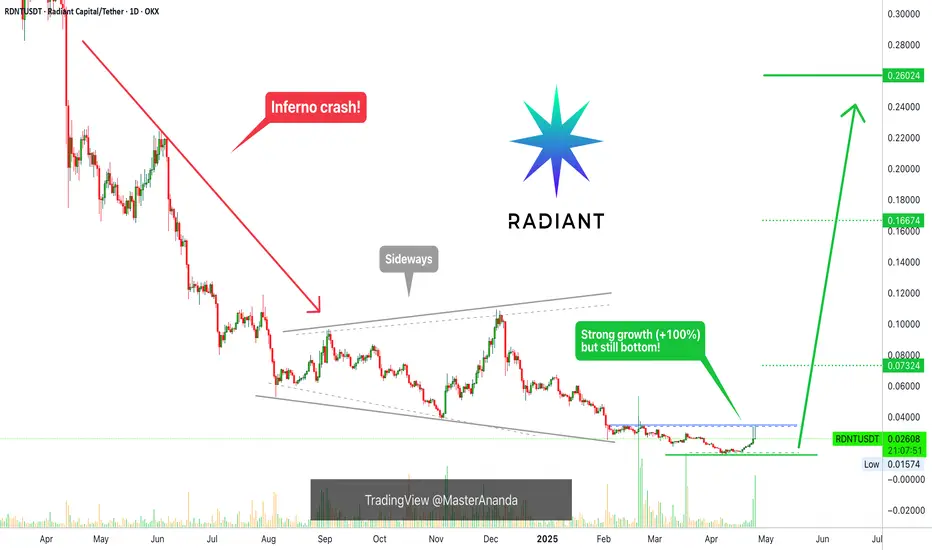
Radiant Capital: The Most Amazing Market Analyst In The WorldRadiant Capital is now up more than 100% since its 7-April bottom. It is still trading at bottom prices. Huge growth, high volume still bottom.
You can appreciate what I mean right?
The chart is easy.
By mentioning that a pair is still trading at bottom prices I mean to say that there is still ple
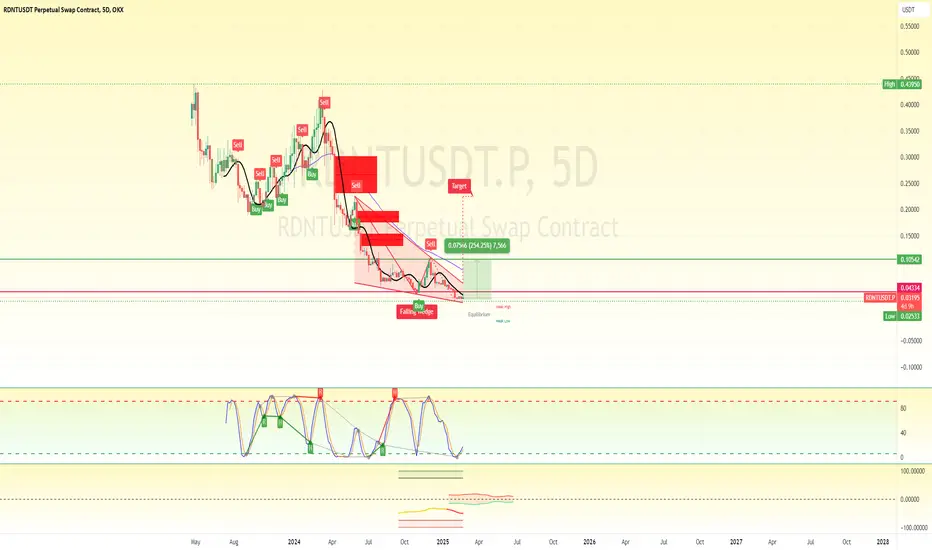
RDNT detailed analysis **Detailed Analysis of RDNT/USDT 5-Day Chart**
**1. Trend Analysis**
- The chart depicts a **falling wedge pattern**, a bullish reversal signal.
- There has been a consistent downtrend with multiple sell signals in the past.
- However, recent price action suggests accumulation, with a "Buy" signal
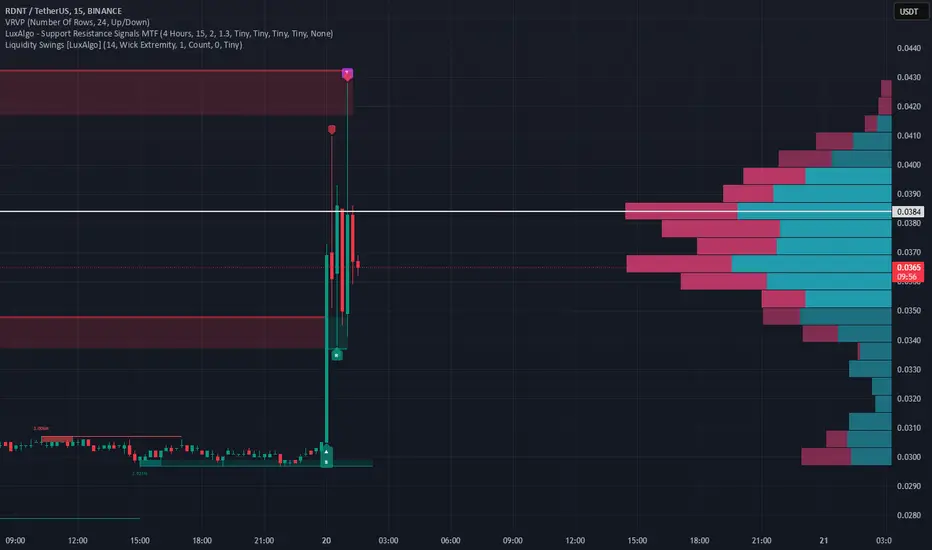
RDNT Trading Idea ( 1H)RDNT is testing the red resistance zone 🔴. If it breaks out successfully, the next target is the green line level 🎯

Sharks looking for buyers! Don't be one of the buyers!While Sharks (whales) looking for buyers in order to full fill their sell orders, All the indicators screaming buy!
Watch how accurate are our insights and how we are able to identify every single move of the market..
Don't buy this coin!!
Follow us for more
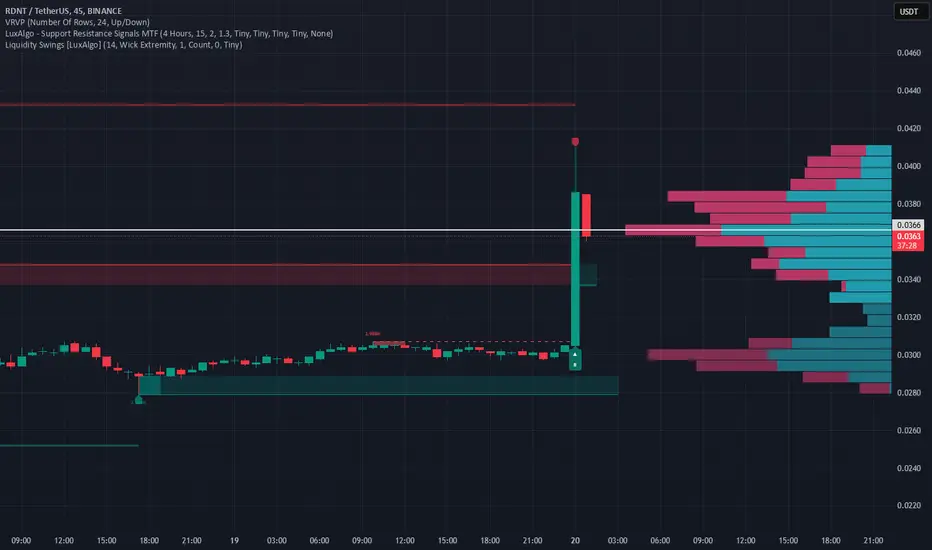
Attention!! Fake bullish patern!!Attention everyone.!
Fake bullish pattern from RDNT !
Opening long positions at this point will cost you a lot!
#RDNT: Empowering Cross-Chain DeFi LendingDescription:
This trading idea highlights RDNT (Radiant), a revolutionary DeFi protocol designed to enable seamless cross-chain lending and borrowing. RDNT aims to address the fragmentation of liquidity across different blockchain ecosystems by creating a unified platform where users can deposit as
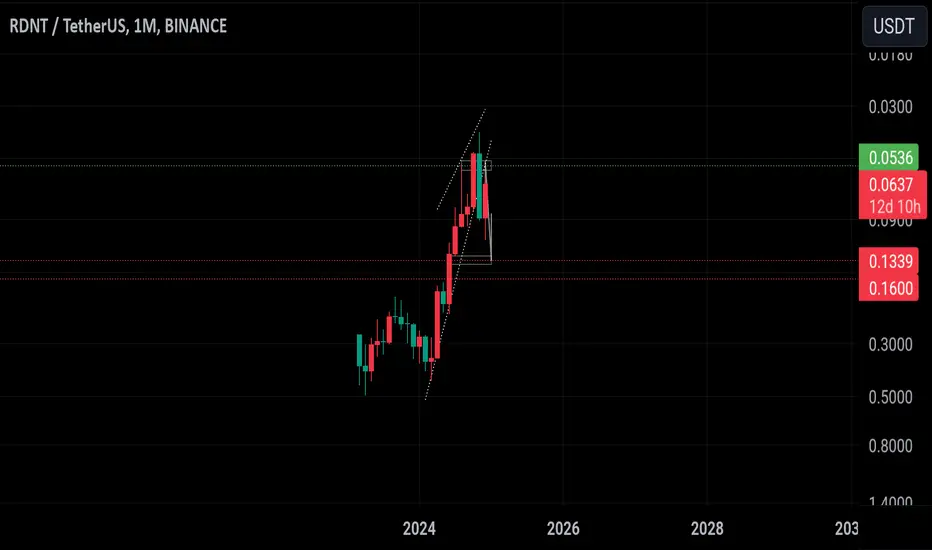
Don't miss this chanceYou can clearly see the breakout on the monthly chart. We're not in a bear market yet it's still bullish. and this actually can be the last chance to buy at these low prices. And NASDAQ:RDNT is one of the best options rn. I reccomend waiting longer because imo the prices will go down a lil bit mor
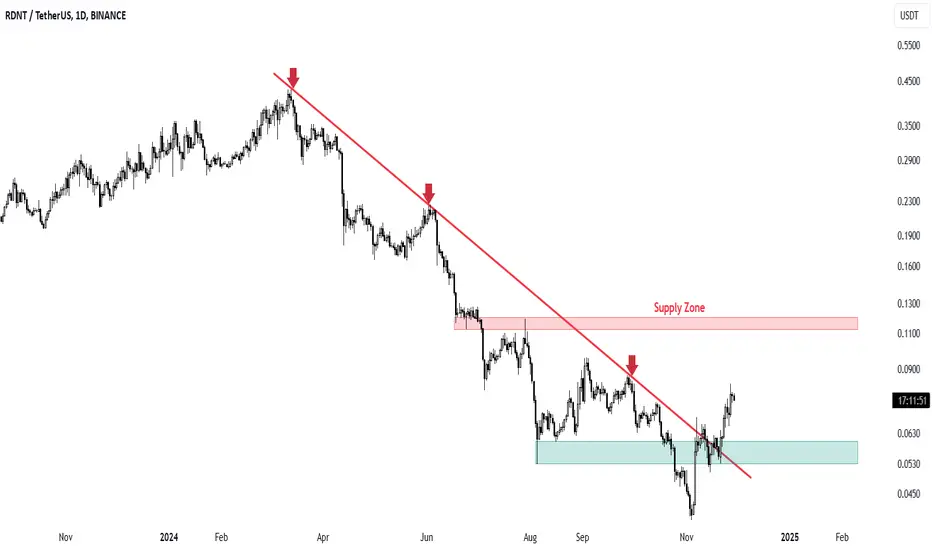
Radiant Capital Breakout Down TrendAfter Breakout The price grew by about 50%
A possible supply area is shown
In case of penetration from the supply area, the price may return to the bottom and return to the supply area and failure.
The volume of transactions and the cap token market is very important.
The loss limit must be observ
See all ideas
Summarizing what the indicators are suggesting.
Oscillators
Neutral
SellBuy
Strong sellStrong buy
Strong sellSellNeutralBuyStrong buy
Oscillators
Neutral
SellBuy
Strong sellStrong buy
Strong sellSellNeutralBuyStrong buy
Summary
Neutral
SellBuy
Strong sellStrong buy
Strong sellSellNeutralBuyStrong buy
Summary
Neutral
SellBuy
Strong sellStrong buy
Strong sellSellNeutralBuyStrong buy
Summary
Neutral
SellBuy
Strong sellStrong buy
Strong sellSellNeutralBuyStrong buy
Moving Averages
Neutral
SellBuy
Strong sellStrong buy
Strong sellSellNeutralBuyStrong buy
Moving Averages
Neutral
SellBuy
Strong sellStrong buy
Strong sellSellNeutralBuyStrong buy
Displays a symbol's price movements over previous years to identify recurring trends.