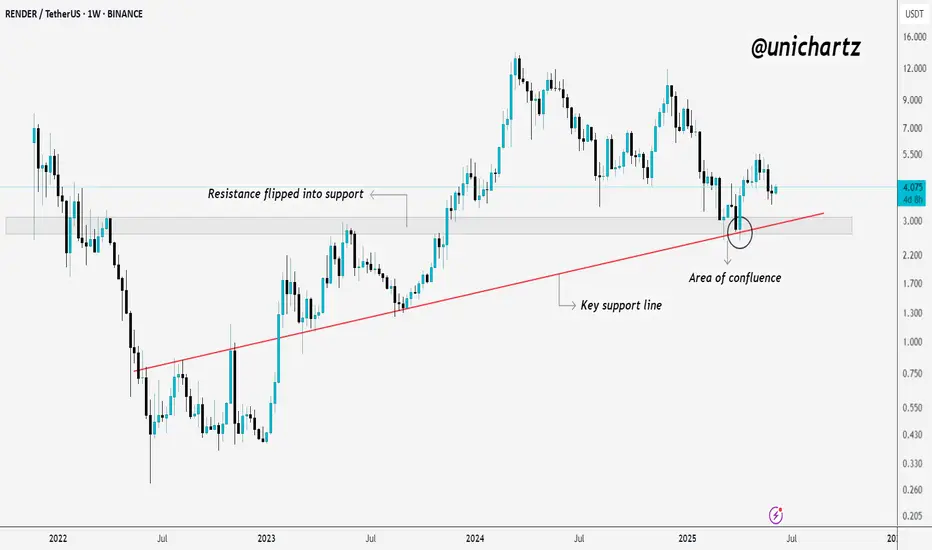
RENDER Bounces from Strong Confluence Zone$RENDER/USDT Update
RENDER is holding well above the key support zone after a clean retest of the area of confluence.
What’s interesting here is that the old resistance has now flipped into support, this is often a strong bullish signal on higher timeframes.
Price bounced exactly where you’d expec
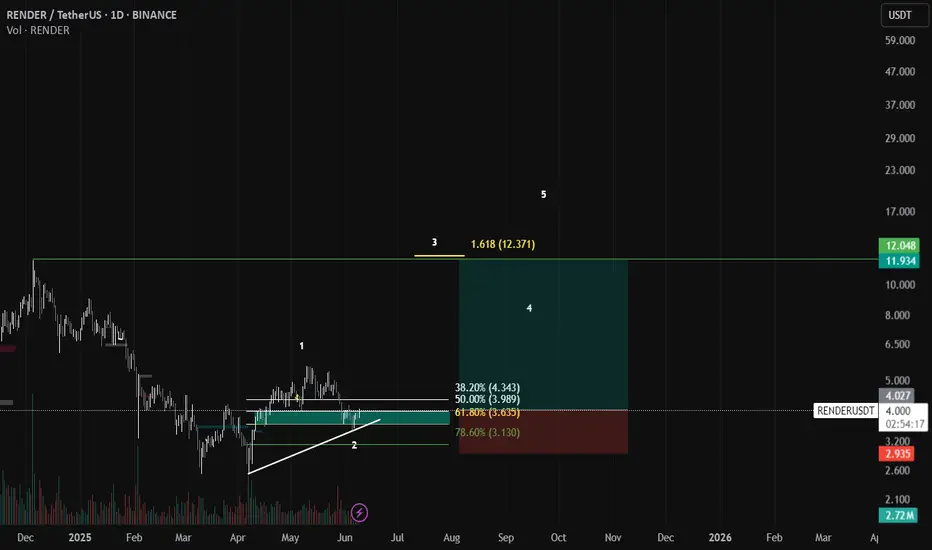
Render Trade plan RNDR/USDT – Wave 3 Setup in Progress 🚀
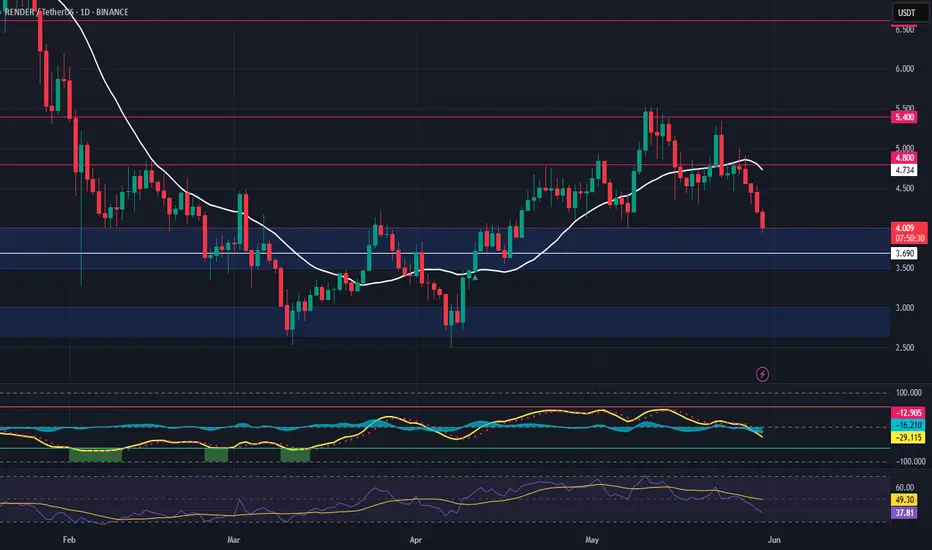
This is an Elliott Wave-based setup on the 1D chart for RENDER. Wave 1 and Wave 2 appear to be completed, with Wave 3 yet to unfold. Price is currently sitting near the 50%–61.8% Fibonacci retracement zone ($3.98–$3.63), which is a typical launchpad area for a
RENDER: Swing Spot Long 16/06/25Trade Direction:
RENDER Swing Spot Long
Risk Management:
- Total risk on spot account approx 0.5%
- Stop loss below most recent swing point will not executed unless daily close below.
Reason for Entry:
- Confirmed daily bullish divergence
- Higher time frame drawn liquidity swept and tapped
- Dail

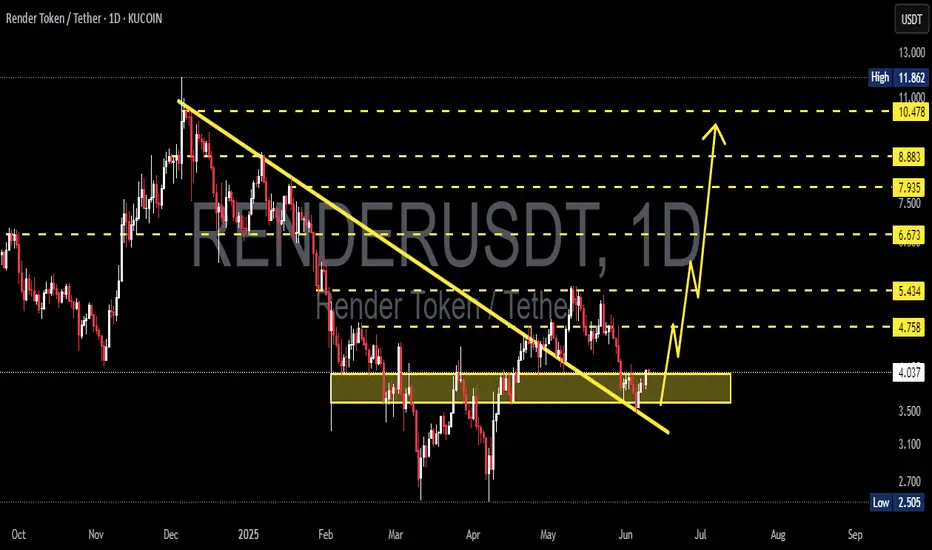
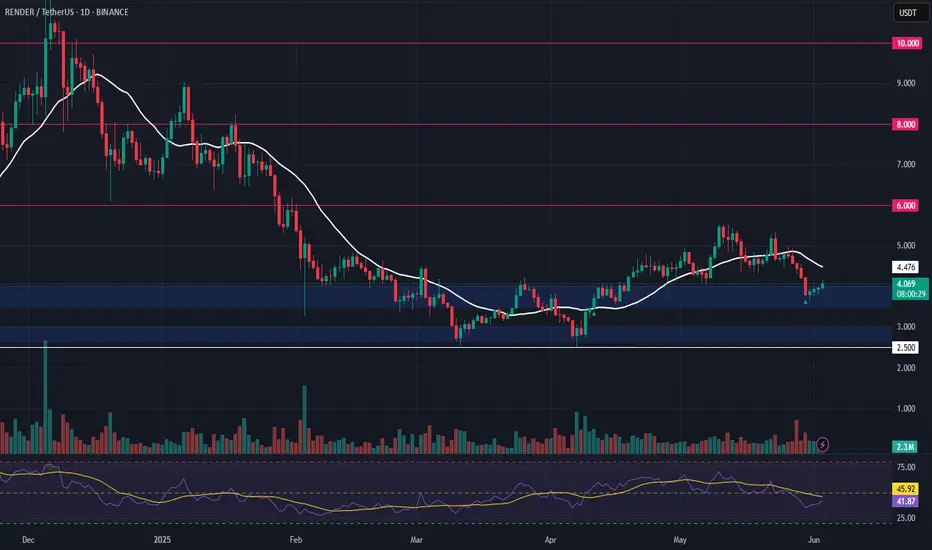
RENDERUSDT 1D AnalysisRENDER ~ 1D Analysis
#RENDER Buy back gradually from this support block with short term target of at least 15%+ , Long term target $11
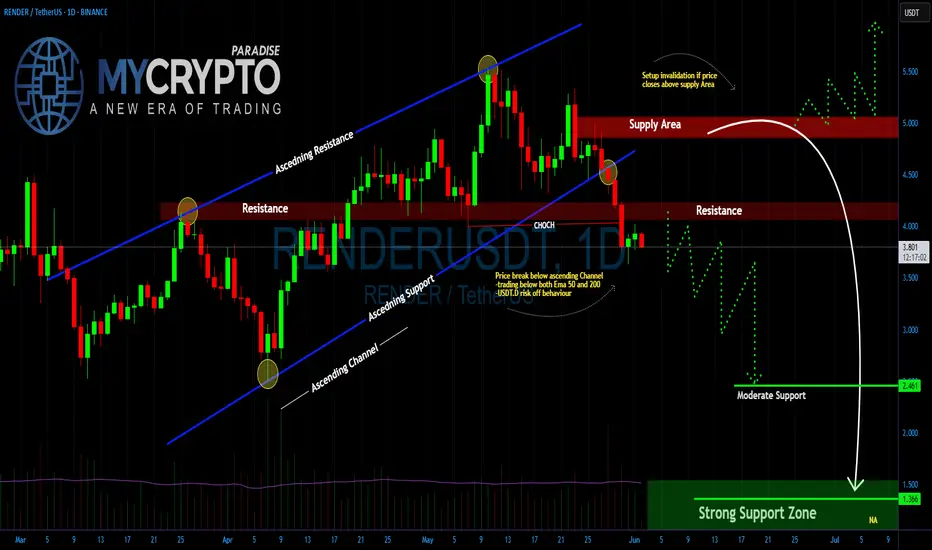
RENDER Is $1.366 the Next Stop Before a Major Market Reversal?Yello Paradisers! Are you prepared for the drop that could clean out both bulls and bears before the real move begins? Or will you be caught in another trap?
💎#RENDERUSDT has broken down from its ascending channel. This confirms that bullish momentum has faded, and the structure no longer supports
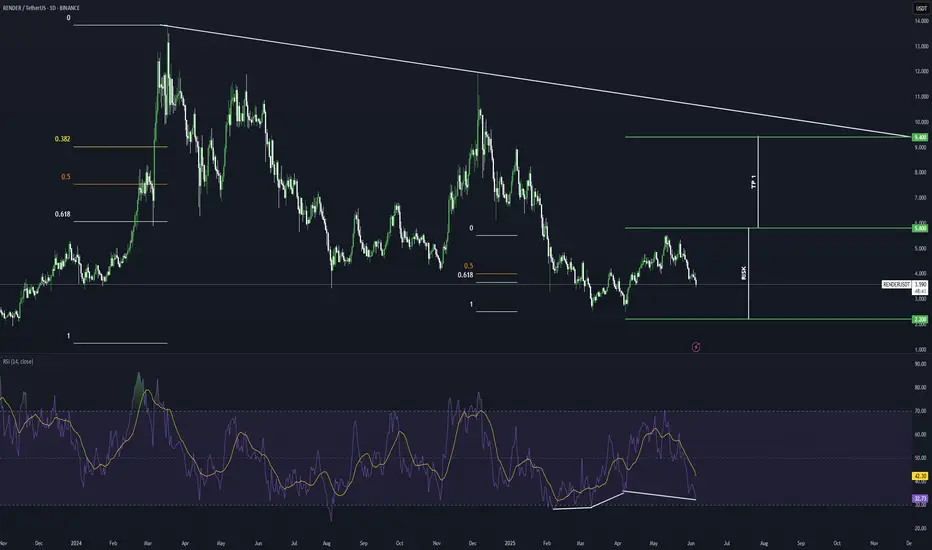
RENDER Potential Bullish Breakout OpportunityRENDER seems to exhibit signs of overall potential Bullish momentum if the price action forms a prominent Higher High with multiple confluences through key Fibonacci and Support levels which presents us with a potential long opportunity.
Trade Plan:
Entry : 5.8
Stop Loss : 2.2
TP 1 : 9.4
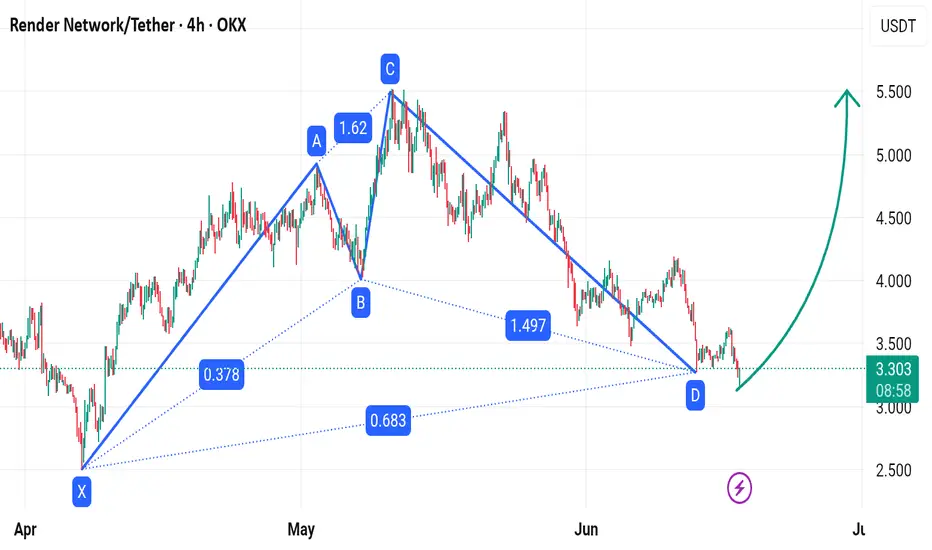
Render (RNDR/USDT) – Cypher Pattern Formed on 4H TimeframeA bullish Cypher harmonic pattern has completed on the 4H chart of RNDR/USDT. This technical structure suggests a potential reversal from the recent bearish move.
🧩 Pattern Details:
XA leg: Strong bullish impulse
AB retracement: 38.2% of XA
BC extension: 1.62 of AB
CD completion: Near 78.6% of
RNDR (Render) – Higher Low Setup for Potential Upside ExpansionRENDER is holding strong above the $3.50–$4.00 support zone, forming what appears to be a higher low — a classic sign of potential trend continuation. This setup provides a favorable risk-to-reward ratio with clearly defined invalidation and upside targets.
📥 Entry Zone:
$3.50 – $4.00
🔸 Holding ab
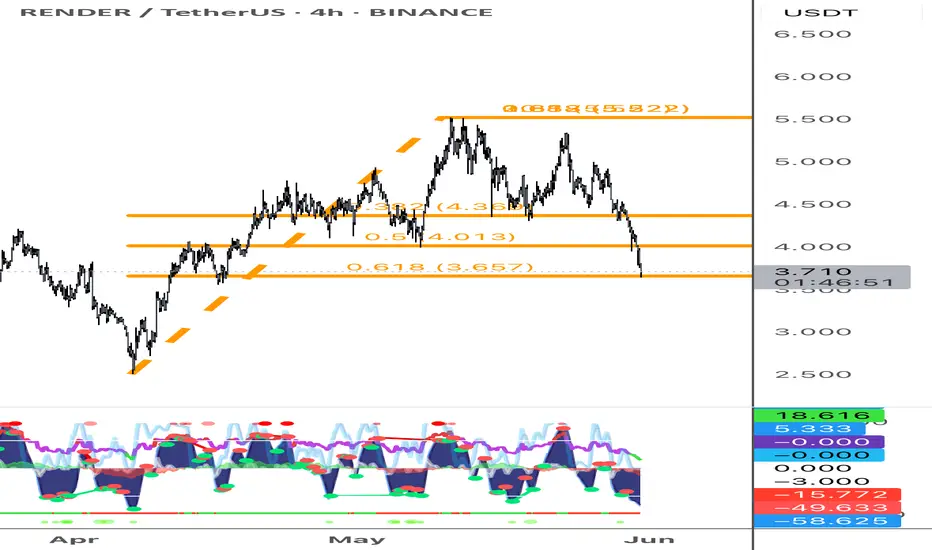
Render – Re-Entry Opportunity After Hitting First TargetRENDER hit the first take profit target (TP1) with a ~52% gain — great execution. Now, after the expected pullback, price is approaching a key support zone, offering a second swing trade opportunity.
🔹 Entry Zone:
Around $4.00 support
🔁 Previous resistance turned support
🧭 Psychological level and
See all ideas
Summarizing what the indicators are suggesting.
Oscillators
Neutral
SellBuy
Strong sellStrong buy
Strong sellSellNeutralBuyStrong buy
Oscillators
Neutral
SellBuy
Strong sellStrong buy
Strong sellSellNeutralBuyStrong buy
Summary
Neutral
SellBuy
Strong sellStrong buy
Strong sellSellNeutralBuyStrong buy
Summary
Neutral
SellBuy
Strong sellStrong buy
Strong sellSellNeutralBuyStrong buy
Summary
Neutral
SellBuy
Strong sellStrong buy
Strong sellSellNeutralBuyStrong buy
Moving Averages
Neutral
SellBuy
Strong sellStrong buy
Strong sellSellNeutralBuyStrong buy
Moving Averages
Neutral
SellBuy
Strong sellStrong buy
Strong sellSellNeutralBuyStrong buy
Displays a symbol's price movements over previous years to identify recurring trends.