RENDER: Swing Spot Long 16/06/25Trade Direction:
RENDER Swing Spot Long
Risk Management:
- Total risk on spot account approx 0.5%
- Stop loss below most recent swing point will not executed unless daily close below.
Reason for Entry:
- Confirmed daily bullish divergence
- Higher time frame drawn liquidity swept and tapped
- Dail
Related pairs

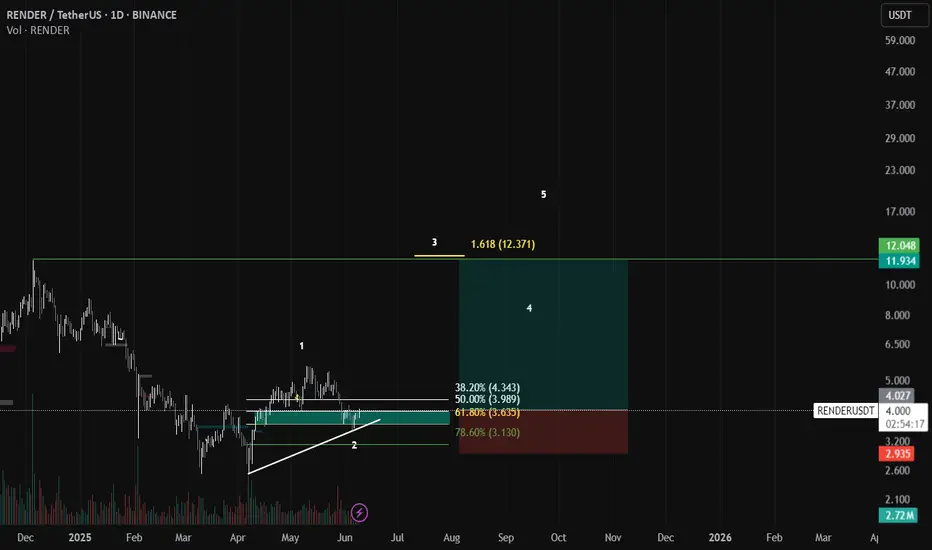
Render Trade plan RNDR/USDT – Wave 3 Setup in Progress 🚀
This is an Elliott Wave-based setup on the 1D chart for RENDER. Wave 1 and Wave 2 appear to be completed, with Wave 3 yet to unfold. Price is currently sitting near the 50%–61.8% Fibonacci retracement zone ($3.98–$3.63), which is a typical launchpad area for a
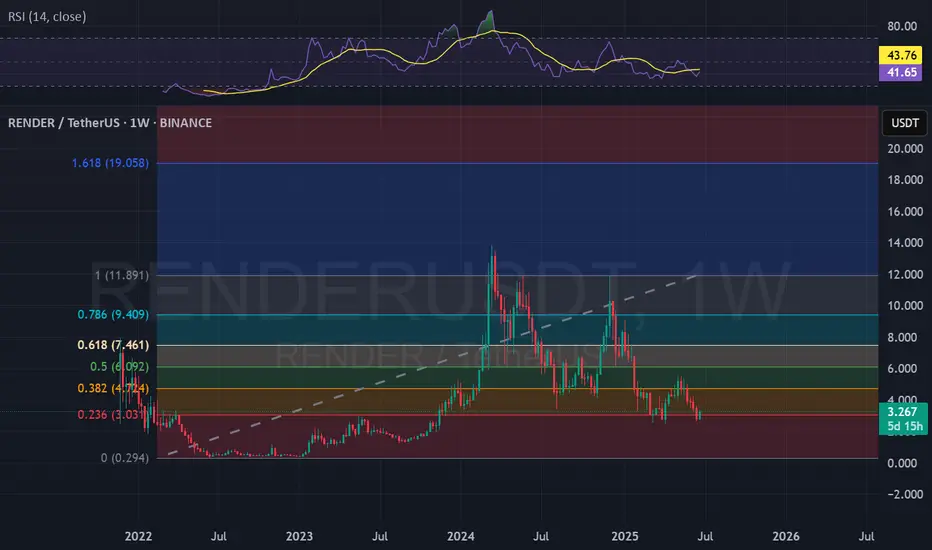
RENDER more downside to come?In this chart I present you RENDER.
1 Week timeframe. I expect that price will go lower, in the 0.29$ area by September (impossible to do timing in the market, but I try to give a month though). After that, we should have the spices for another alt run. In my opinion this will apply for many alts.
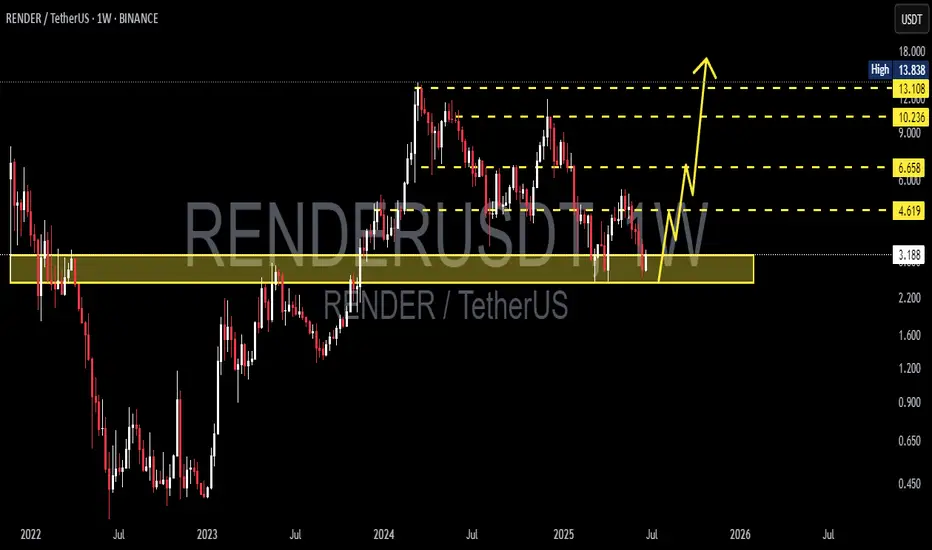
RENDERUSDT 1W AnalysisRENDER ~ 1W Analysis
#RENDER Buy gradually from here with a short term target of at least 20%++ from this support block.
Render is at an inflection. Bounce or LL?RENDER technically is still in a downtrend. Given the current events, it is likely that a lower low will confirm the trend continuation. Keep in mind that the price is now oversold. Time to watch for support signals.
Full TA: Link in the BIO

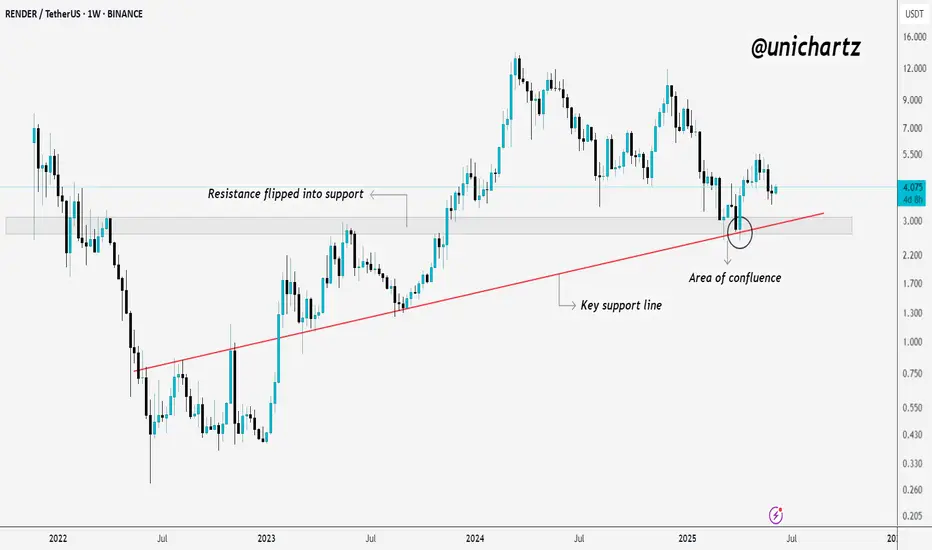
RENDER Bounces from Strong Confluence Zone$RENDER/USDT Update
RENDER is holding well above the key support zone after a clean retest of the area of confluence.
What’s interesting here is that the old resistance has now flipped into support, this is often a strong bullish signal on higher timeframes.
Price bounced exactly where you’d expec
RENDERUSDT 1D AnalysisRENDER ~ 1D Analysis
#RENDER Buy back gradually from this support block with short term target of at least 15%+ , Long term target $11
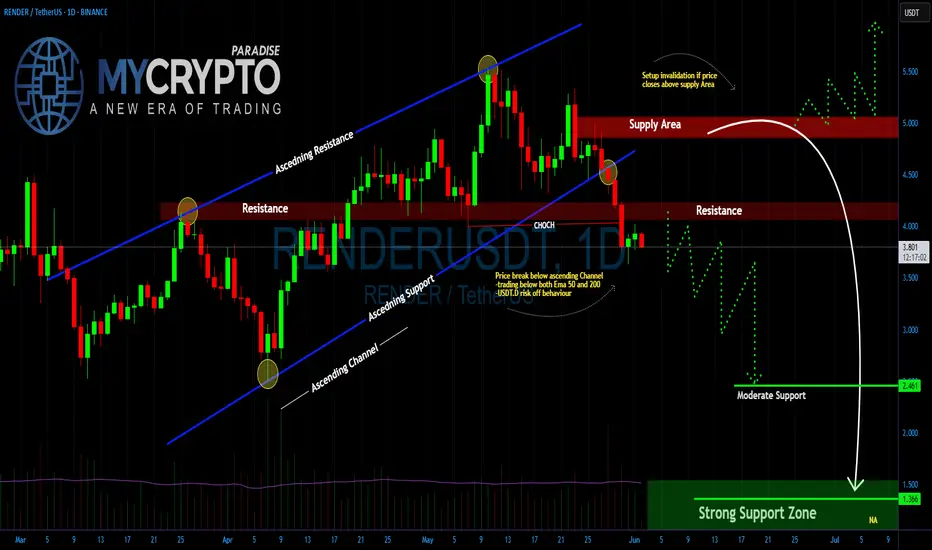
RENDER Is $1.366 the Next Stop Before a Major Market Reversal?Yello Paradisers! Are you prepared for the drop that could clean out both bulls and bears before the real move begins? Or will you be caught in another trap?
💎#RENDERUSDT has broken down from its ascending channel. This confirms that bullish momentum has faded, and the structure no longer supports
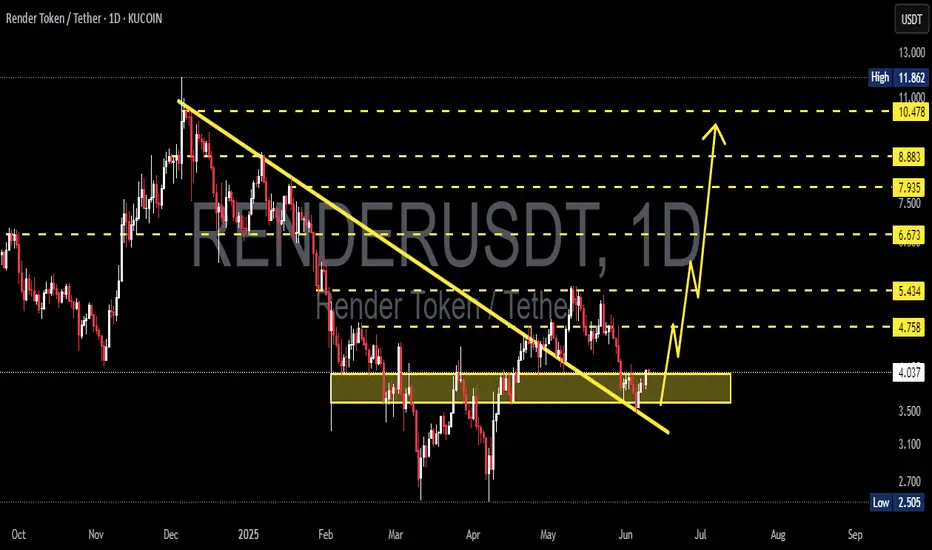
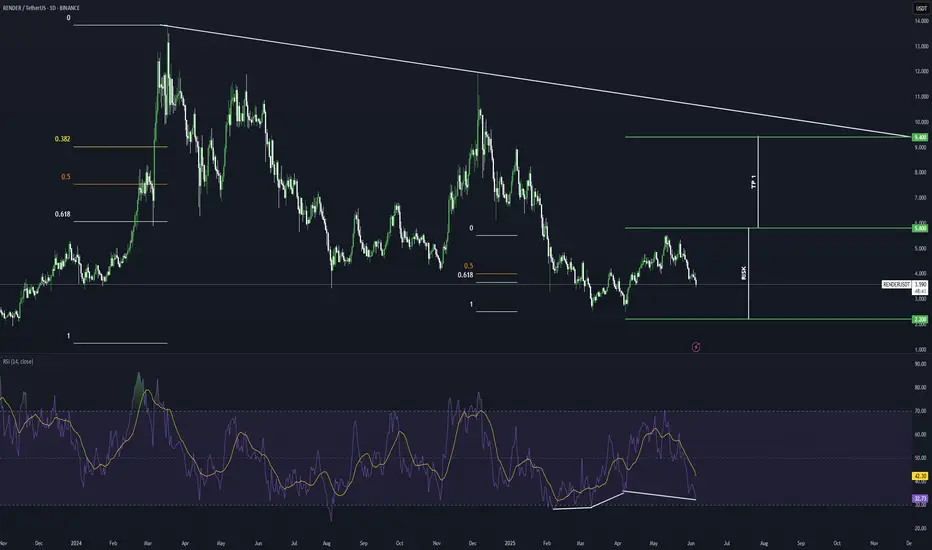
RENDER Potential Bullish Breakout OpportunityRENDER seems to exhibit signs of overall potential Bullish momentum if the price action forms a prominent Higher High with multiple confluences through key Fibonacci and Support levels which presents us with a potential long opportunity.
Trade Plan:
Entry : 5.8
Stop Loss : 2.2
TP 1 : 9.4
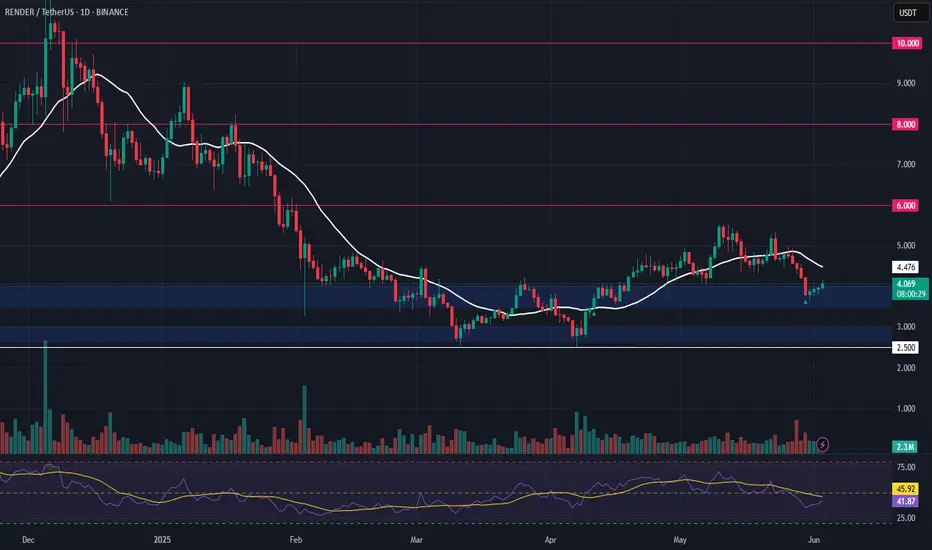
RNDR (Render) – Higher Low Setup for Potential Upside ExpansionRENDER is holding strong above the $3.50–$4.00 support zone, forming what appears to be a higher low — a classic sign of potential trend continuation. This setup provides a favorable risk-to-reward ratio with clearly defined invalidation and upside targets.
📥 Entry Zone:
$3.50 – $4.00
🔸 Holding ab
See all ideas
Summarizing what the indicators are suggesting.
Oscillators
Neutral
SellBuy
Strong sellStrong buy
Strong sellSellNeutralBuyStrong buy
Oscillators
Neutral
SellBuy
Strong sellStrong buy
Strong sellSellNeutralBuyStrong buy
Summary
Neutral
SellBuy
Strong sellStrong buy
Strong sellSellNeutralBuyStrong buy
Summary
Neutral
SellBuy
Strong sellStrong buy
Strong sellSellNeutralBuyStrong buy
Summary
Neutral
SellBuy
Strong sellStrong buy
Strong sellSellNeutralBuyStrong buy
Moving Averages
Neutral
SellBuy
Strong sellStrong buy
Strong sellSellNeutralBuyStrong buy
Moving Averages
Neutral
SellBuy
Strong sellStrong buy
Strong sellSellNeutralBuyStrong buy
Displays a symbol's price movements over previous years to identify recurring trends.
Frequently Asked Questions
The current price of RENDERUSDT SPOT (RENDER) is 3.257 USDT — it has fallen −0.47% in the past 24 hours. Try placing this info into the context by checking out what coins are also gaining and losing at the moment and seeing RENDER price chart.
RENDERUSDT SPOT price has fallen by −6.56% over the last week, its month performance shows a −31.96% decrease, and as for the last year, RENDERUSDT SPOT has decreased by −18.57%. See more dynamics on RENDER price chart.
Keep track of coins' changes with our Crypto Coins Heatmap.
Keep track of coins' changes with our Crypto Coins Heatmap.
RENDERUSDT SPOT (RENDER) reached its highest price on Dec 5, 2024 — it amounted to 12.500 USDT. Find more insights on the RENDER price chart.
See the list of crypto gainers and choose what best fits your strategy.
See the list of crypto gainers and choose what best fits your strategy.
RENDERUSDT SPOT (RENDER) reached the lowest price of 2.505 USDT on Apr 7, 2025. View more RENDERUSDT SPOT dynamics on the price chart.
See the list of crypto losers to find unexpected opportunities.
See the list of crypto losers to find unexpected opportunities.
The safest choice when buying RENDER is to go to a well-known crypto exchange. Some of the popular names are Binance, Coinbase, Kraken. But you'll have to find a reliable broker and create an account first. You can trade RENDER right from TradingView charts — just choose a broker and connect to your account.
Crypto markets are famous for their volatility, so one should study all the available stats before adding crypto assets to their portfolio. Very often it's technical analysis that comes in handy. We prepared technical ratings for RENDERUSDT SPOT (RENDER): today its technical analysis shows the sell signal, and according to the 1 week rating RENDER shows the sell signal. And you'd better dig deeper and study 1 month rating too — it's buy. Find inspiration in RENDERUSDT SPOT trading ideas and keep track of what's moving crypto markets with our crypto news feed.
RENDERUSDT SPOT (RENDER) is just as reliable as any other crypto asset — this corner of the world market is highly volatile. Today, for instance, RENDERUSDT SPOT is estimated as 2.63% volatile. The only thing it means is that you must prepare and examine all available information before making a decision. And if you're not sure about RENDERUSDT SPOT, you can find more inspiration in our curated watchlists.
You can discuss RENDERUSDT SPOT (RENDER) with other users in our public chats, Minds or in the comments to Ideas.