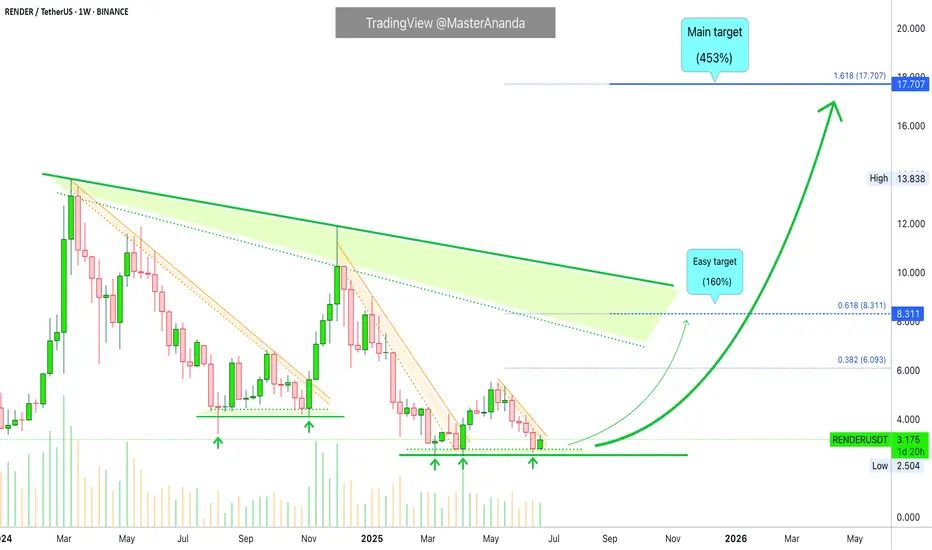
Render Token Buy Zone: New ATH $17.7, $27 & $46, 2025-26Render Token (RENDERUSDT) is moving within a strong buy zone. Any price below the 5-August 2024 low is a great entry when you aim for the 2025/26 bull market wave. That is, any entry below $3.41 is a very strong, low risk and high potential for reward buy. This is a solid pair.
Remember in 2024 when I told you it was going down, down, down, down? It has been going down for more than a year and three months. There is good news though, Render Token will go down no more.
The chart shows lower highs and lower lows. The last four months have the same base, no new lows. The lows in late 2024 are also not that far away.
Late 2025 & early 2026 targets (New all-time high)
The lower highs are part of a classic correction pattern, with the current chart structure opening up an easy 160% target. This is very easy.
The main target can reach $17.7 (PP: 453%) with higher prices being almost certain. The last target can be around $27 or $46, for these, we will have to wait and see.
When to sell
If the initial move has much force, buyers support and bullish momentum, we can aim for the higher targets. If the initial action is weak and there isn't enough market-buyers support, then we aim lower; it all depends on how the bull market develops but overall the potential is very strong. For Render, for Bitcoin and the rest of the altcoins.
Thanks for the support.
Namaste.
RENDERUSDT trade ideas
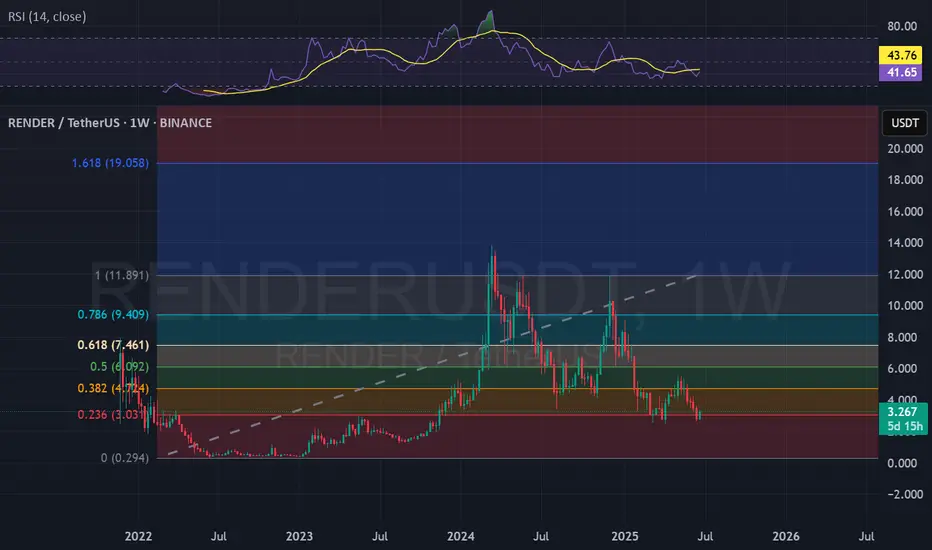
RENDER more downside to come?In this chart I present you RENDER.
1 Week timeframe. I expect that price will go lower, in the 0.29$ area by September (impossible to do timing in the market, but I try to give a month though). After that, we should have the spices for another alt run. In my opinion this will apply for many alts. I don't active trade Render now (dont have a short position), but I am prepared with $ to cash in an oppotunity.
Many of you will tell me that I am delusional, but guess that time will tell.
RENDERUSDT 1W AnalysisRENDER ~ 1W Analysis
#RENDER Buy gradually from here with a short term target of at least 20%++ from this support block.
Render is at an inflection. Bounce or LL?RENDER technically is still in a downtrend. Given the current events, it is likely that a lower low will confirm the trend continuation. Keep in mind that the price is now oversold. Time to watch for support signals.
Full TA: Link in the BIO

RENDER: Swing Spot Long 16/06/25Trade Direction:
RENDER Swing Spot Long
Risk Management:
- Total risk on spot account approx 0.5%
- Stop loss below most recent swing point will not executed unless daily close below.
Reason for Entry:
- Confirmed daily bullish divergence
- Higher time frame drawn liquidity swept and tapped
- Daily hammer candle
- Daily 0.718 retracement off leg
- Positioned in strong weekly and monthly demand zones
Additional Notes:
- Clean chart, gives me upside for a potential bottom formation here
- Not aiming for a huge swing upside just next DOL

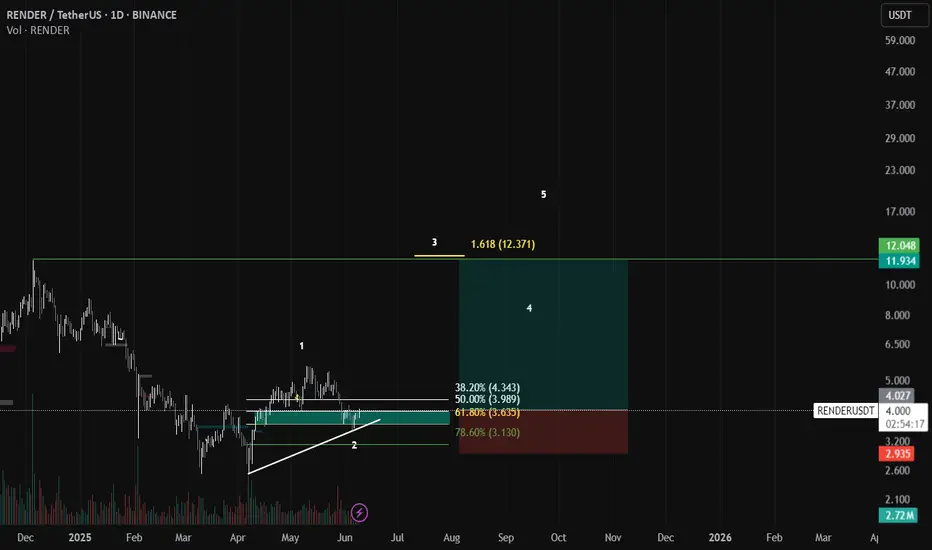
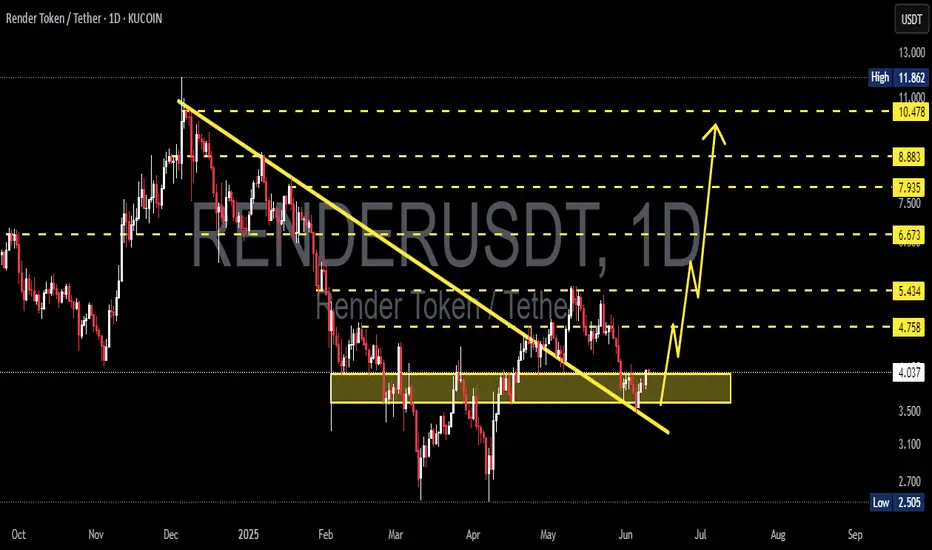
Render Trade plan RNDR/USDT – Wave 3 Setup in Progress 🚀
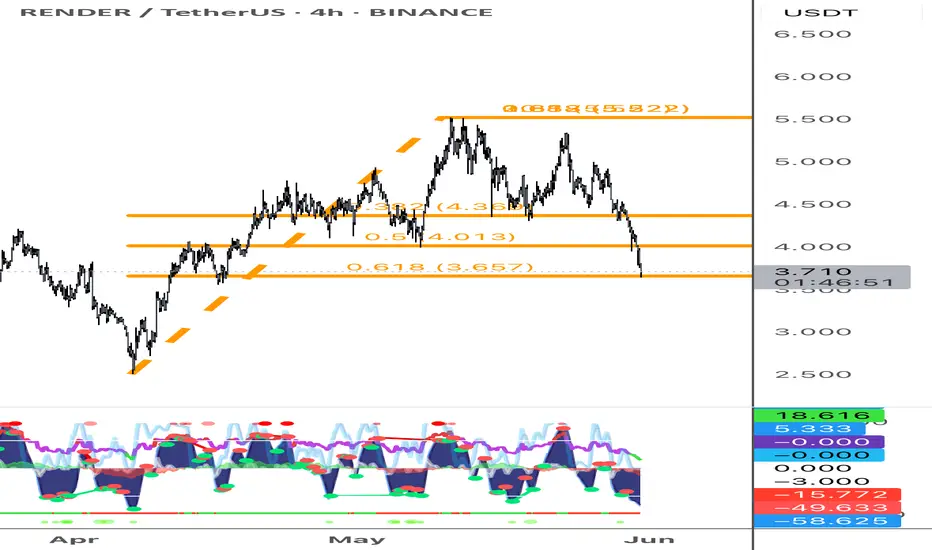
This is an Elliott Wave-based setup on the 1D chart for RENDER. Wave 1 and Wave 2 appear to be completed, with Wave 3 yet to unfold. Price is currently sitting near the 50%–61.8% Fibonacci retracement zone ($3.98–$3.63), which is a typical launchpad area for a strong impulsive Wave 3 move.
📉 Wave Structure:
✅ Wave 1: Complete
✅ Wave 2: Retested key Fib zone
🔜 Wave 3: Expected to extend towards the 1.618 Fib extension at $12.37
🎯 Entry Zone: $3.98–$4.00
🛑 Invalidation: Below $3.13 (78.6% retracement)
🚀 Wave 3 Target: ~$12+
This setup offers a favorable risk-to-reward ratio with clear invalidation. Watching closely for bullish confirmation.
#RNDR #ElliottWave #CryptoAnalysis #RenderToken #AltcoinSeason
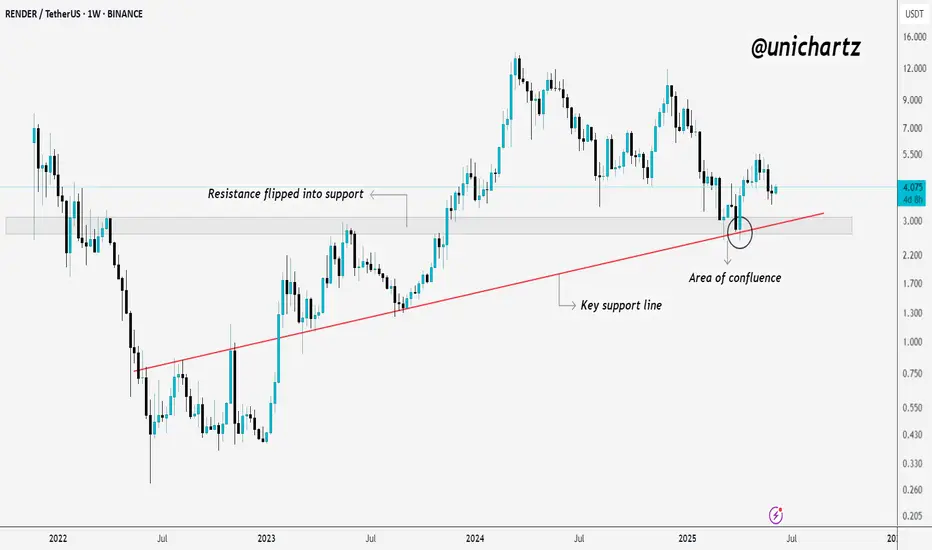
RENDER Bounces from Strong Confluence Zone$RENDER/USDT Update
RENDER is holding well above the key support zone after a clean retest of the area of confluence.
What’s interesting here is that the old resistance has now flipped into support, this is often a strong bullish signal on higher timeframes.
Price bounced exactly where you’d expect, at the intersection of horizontal support and the rising trendline.
As long as RENDER continues to respect this zone, the structure remains bullish.
DYOR, NFA
Thanks for following along — stay tuned for more updates!
RENDERUSDT 1D AnalysisRENDER ~ 1D Analysis
#RENDER Buy back gradually from this support block with short term target of at least 15%+ , Long term target $11
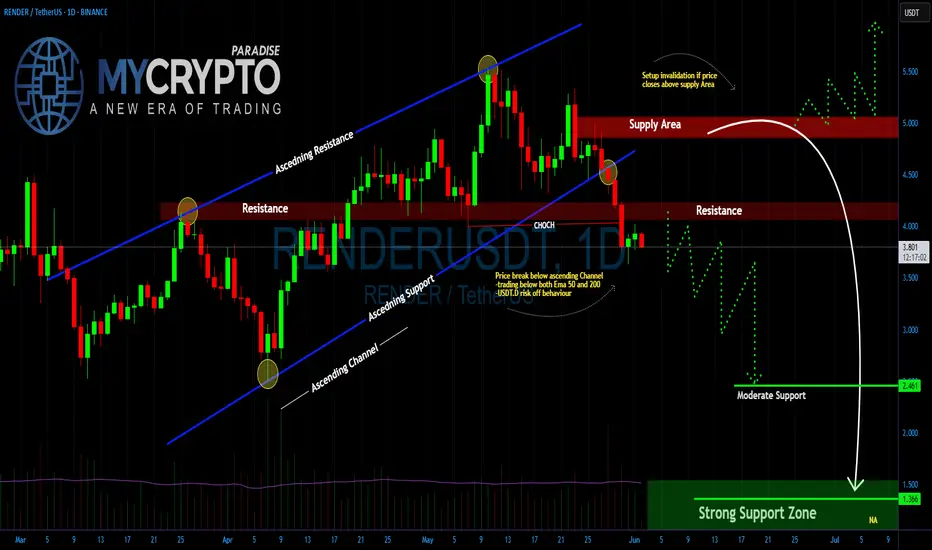
RENDER Is $1.366 the Next Stop Before a Major Market Reversal?Yello Paradisers! Are you prepared for the drop that could clean out both bulls and bears before the real move begins? Or will you be caught in another trap?
💎#RENDERUSDT has broken down from its ascending channel. This confirms that bullish momentum has faded, and the structure no longer supports higher prices.
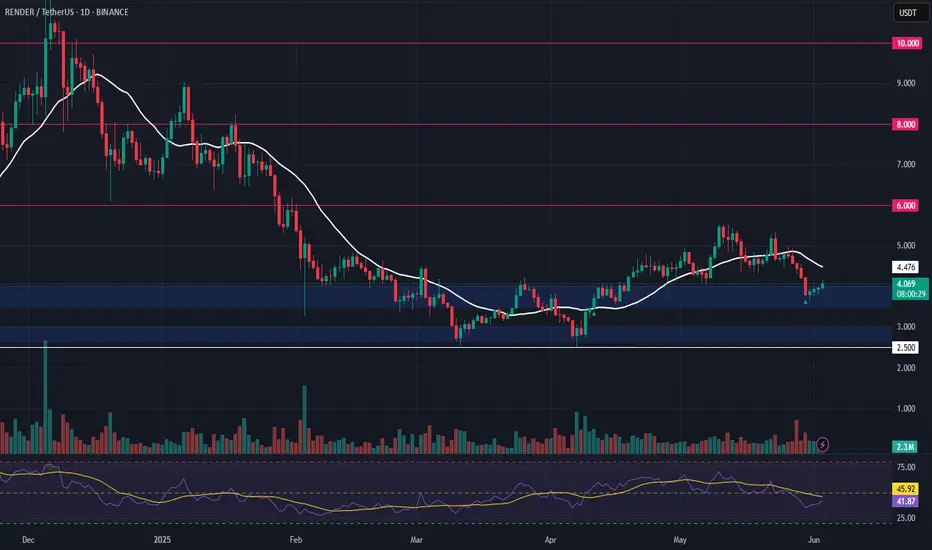
💎The price is now trading below both the 50 EMA and 200 EMA on the daily timeframe. These are key trend indicators. Losing them shifts the bias to the downside. After rejection from the $5.00–$5.40 supply zone, the market failed to make a new high. That area remains strong resistance. Bulls must reclaim it to regain control.
💎Previous support around $4.00 has now turned into resistance. As long as price stays below this zone, lower targets remain in play.The next support is around $2.46, but that may only offer temporary relief. The real demand zone sits near $1.366, where stronger buying interest is expected.
💎Tether dominance (USDT.D) is showing early signs of risk-off behavior. It has reclaimed the 21, 50, and is now testing the 200 EMA at 4.88%. This suggests capital is rotating out of altcoins and into stablecoins.This shift is backed by rising volume. It's not retail noise it’s institutional positioning. The market is preparing for a deeper correction.
Stay disciplined. The next big opportunity will come to those who wait not those who chase.
MyCryptoParadise
iFeel the success🌴
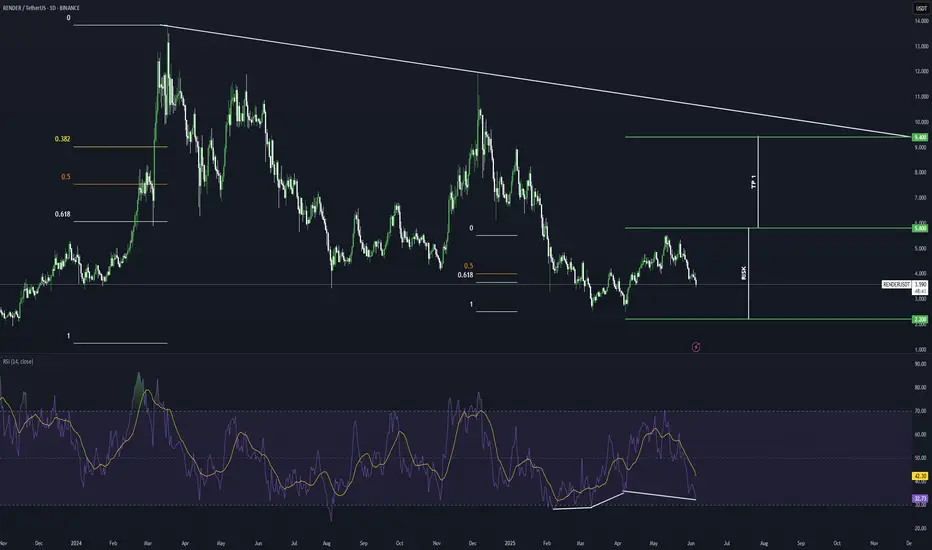
RENDER Potential Bullish Breakout OpportunityRENDER seems to exhibit signs of overall potential Bullish momentum if the price action forms a prominent Higher High with multiple confluences through key Fibonacci and Support levels which presents us with a potential long opportunity.
Trade Plan:
Entry : 5.8
Stop Loss : 2.2
TP 1 : 9.4
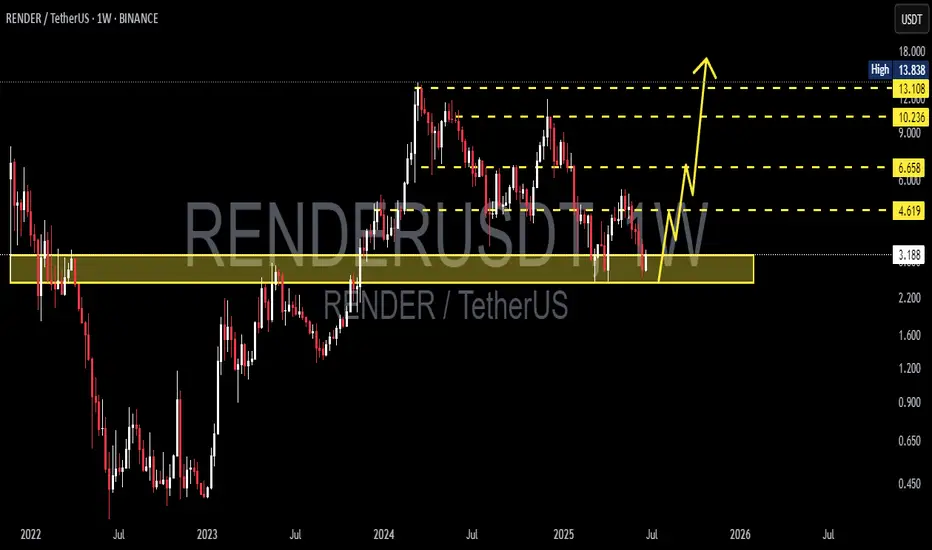
RNDR (Render) – Higher Low Setup for Potential Upside ExpansionRENDER is holding strong above the $3.50–$4.00 support zone, forming what appears to be a higher low — a classic sign of potential trend continuation. This setup provides a favorable risk-to-reward ratio with clearly defined invalidation and upside targets.
📥 Entry Zone:
$3.50 – $4.00
🔸 Holding above demand
🔸 Prior resistance now acting as support
🔸 Potential higher low setup
🎯 Take Profit Targets:
🥇 $6.00 – Previous local top / liquidity pocket
🥈 $8.00 – Major resistance zone from prior cycle
🥉 $10.00 – Psychological round number + HTF extension target
🛑 Stop Loss:
Daily close below $2.50
Clears invalidation of the structure
Below HTF support base
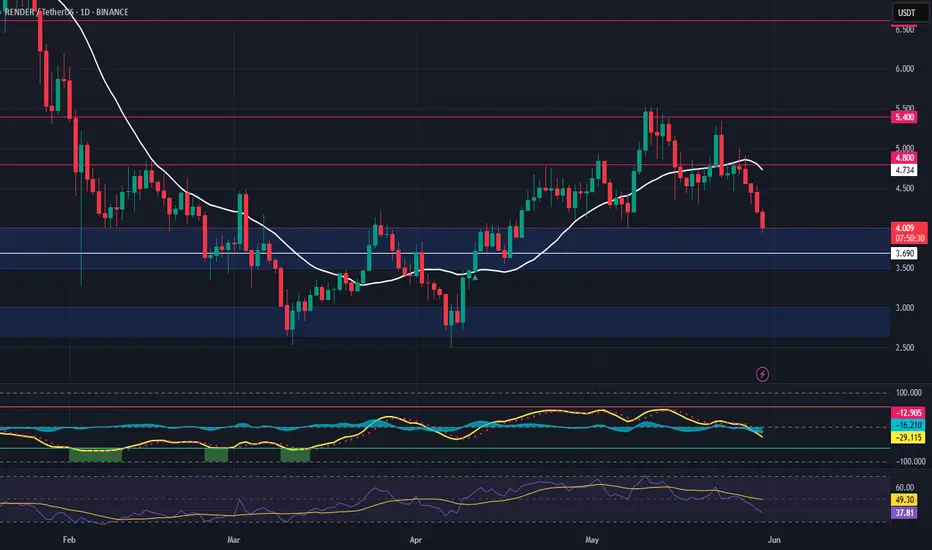
Render – Re-Entry Opportunity After Hitting First TargetRENDER hit the first take profit target (TP1) with a ~52% gain — great execution. Now, after the expected pullback, price is approaching a key support zone, offering a second swing trade opportunity.
🔹 Entry Zone:
Around $4.00 support
🔁 Previous resistance turned support
🧭 Psychological level and structural base
🎯 Take Profit Targets:
🥇 $4.80 (recent local high / resistance)
🥈 $5.40 (next significant supply zone)
🛑 Stop Loss:
$3.69 (below key support & invalidation level)
#RENDER/USDT#RENDER
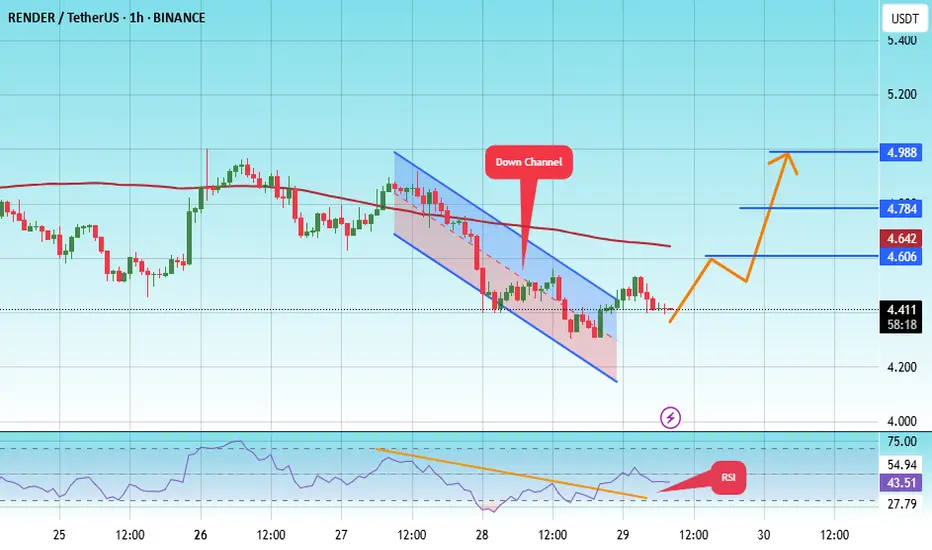
The price is moving within a descending channel on the 1-hour frame, adhering well to it, and is heading for a strong breakout and retest.
We are experiencing a rebound from the lower boundary of the descending channel, which is support at 4.20.
We are experiencing a downtrend on the RSI indicator that is about to break and retest, supporting the upward trend.
We are looking for stability above the 100 Moving Average.
Entry price: 4.41
First target: 4.60
Second target: 4.78
Third target: 4.98
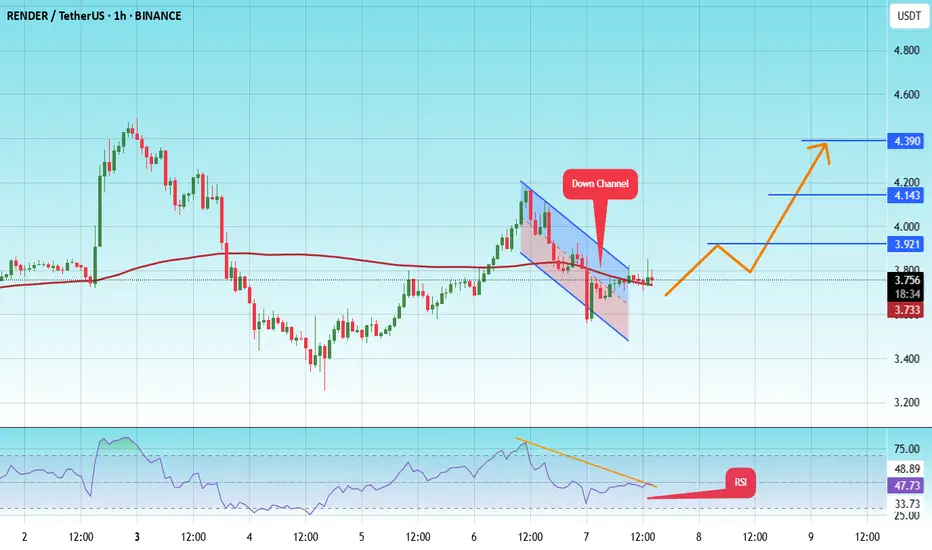
#RENDER/USDT#RENDER
The price is moving in a descending channel on the 1-hour frame and is expected to continue upwards
We have a trend to stabilize above the moving average 100 again
We have a descending trend on the RSI indicator that supports the rise by breaking it upwards
We have a support area at the lower limit of the channel at a price of 3.55
Entry price 3.75
First target 3.92
Second target 4.14
Third target 4.40
RENDER is undervalued and in a downtrendRENDER is still in a downtrend, with lower highs and lower lows. More importantly, the current misunderstanding of Coinbase delisting is causing the price to fall more than expected. Is the oversold state an opportunity?
Full TA: Link in the BIO

RENDERUSDT likely to head towards 7 and beyondThis one looks very promising.
The price is trading between weekly resistance WR1 and weekly support WS1.
The price may hit WS1 again before making a bounce and aiming for WR1.
With resistance facing some pullback at WR1, it is likely to attempt that resistance again only to break it this time and continue its journey to further upward.
Very nice long opportunity from WS1 zone.
I am loading this one heavy on WS1 hit.

Render (RENDER): Looking For Further Bullish MovementRender coin is still trading in bullish trend where we are aiming to see the price reach as high as $7.00
Despite current weakness in markets, we are still in a bullish channel and as long as we are in it, we are going to look for a bullish move here.
Swallow Academy

RENDERUSDT 1D Analysis RENDER ~ 1D Analysis
#RENDER Buy gradually from here if you still have confidence in this coin with a short term target of at least 10%++ from here.

RENDER your thoughts, NOW!Hello - Below is the Market Profile for - RENDER
FET/USDT continues to display strong bullish structure on the 4H chart, as confirmed by successive POC shifts and value areas migrating upward. After consolidating between $0.72 and $0.78 with overlapping value, the price broke out and formed a clear demand zone around $0.78–$0.80, which was respected on the next session’s pullback. Volume has built up heavily around $0.84–$0.86, forming a balanced node which is now acting as a fresh value area. The current candle is printing above the POC, indicating buyers are still in control. As long as FET holds above $0.86, the bias remains long, with potential upside targets of $0.90 and $0.93. A breakdown below $0.84 would indicate rotation back into the previous volume pocket, making $0.80 the next demand zone to watch. Overall, structure is strong and favors buying dips rather than chasing highs.
My doodle is also very straightforward lol, wait for dips!

RENDER Breakout AlertSuccessfully breakout this resistant line with a short -term target of at least 10%+.

RENDERUSDT 1D AnalysisRENDER ~ 1D Analysis
#RENDER Buy after successfully penetrating this resistant line with a short -term target of at least 10%+ from here.

RENDER Testing Red Resistance Zone🚨 RENDER Testing Red Resistance Zone 🚨
RENDER is currently testing a significant red resistance zone. A breakout above this level could signal a bullish move, with the target set at the green line level.
📈 Technical Overview:
Resistance Zone: Red area currently being tested.
🎯 Breakout Target: Green line level upon confirmation.
