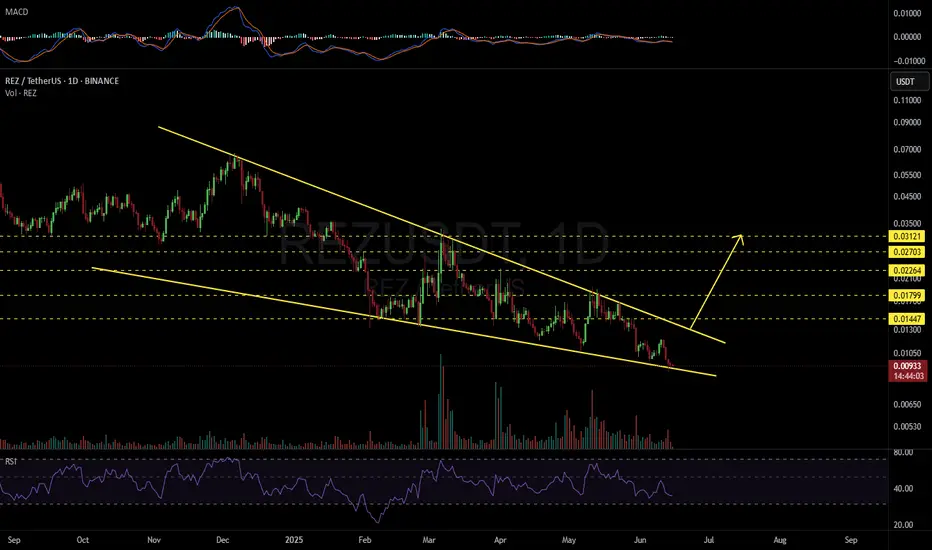
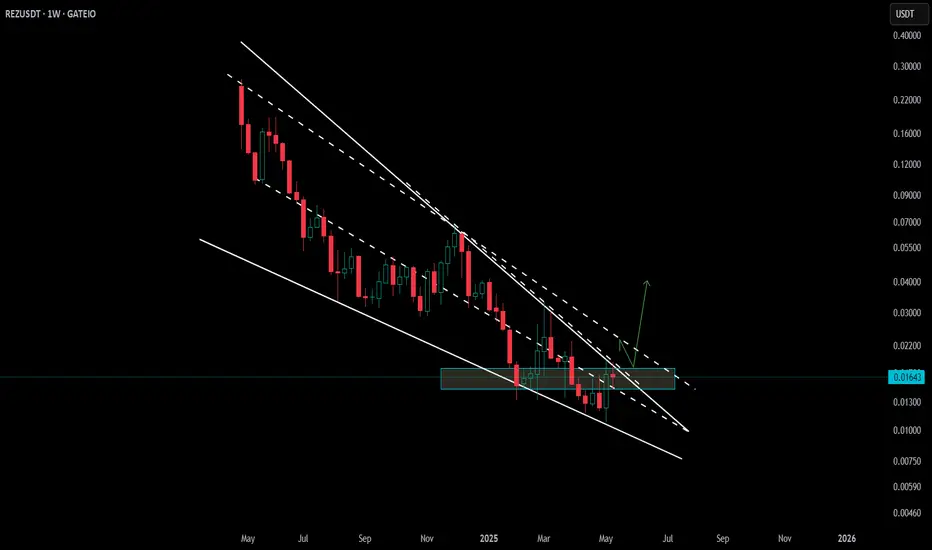
REZUSDT 1D#REZ — Bounce Incoming? 🔄
#REZ is currently sitting on the falling wedge support on the daily chart — a potential reversal zone.
If the price breaks out above the wedge resistance, the next upside targets are:
🎯 $0.01447
🎯 $0.01799
🎯 $0.02264
🎯 $0.02703
🎯 $0.03121
⚠️ Always use a tight stop-loss
REZThis coin, which has been falling for a long time, may now react from these levels. Because it may be towards the end of both long-term and short-term downward waves. Ethereum staking news to watch out for.
* The purpose of my graphic drawings is purely educational.
* What i write here is not an in
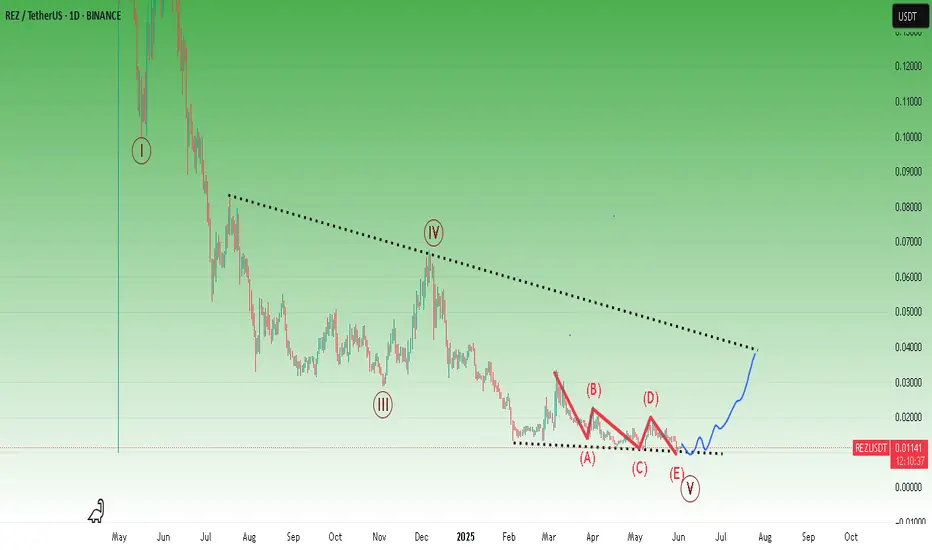
REZUSDT 1D AnalysisREZ ~ 1D Analysis
#REZ Buy again from here if you still have confidence in this coin with a short term target of at least 15%+

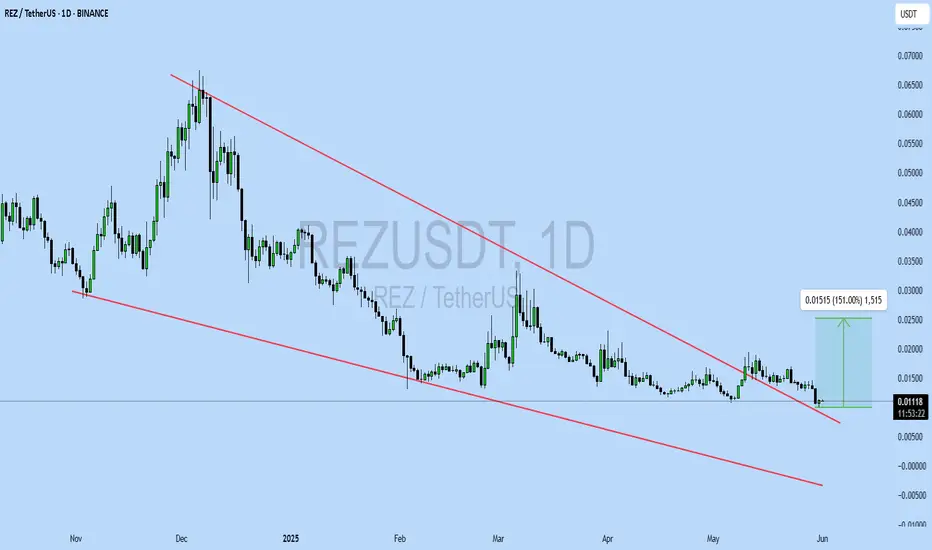
REZUSDT UPDATE
Pattern: Falling Wedge Breakout
Current Price: \$0.01125
Target Price: \$0.02675
Target % Gain: 151%
Technical Analysis: REZ has broken out of a falling wedge on the 1D chart with a bullish retest, suggesting reversal momentum. The breakout is clean, indicating potential for a 151% move if volu
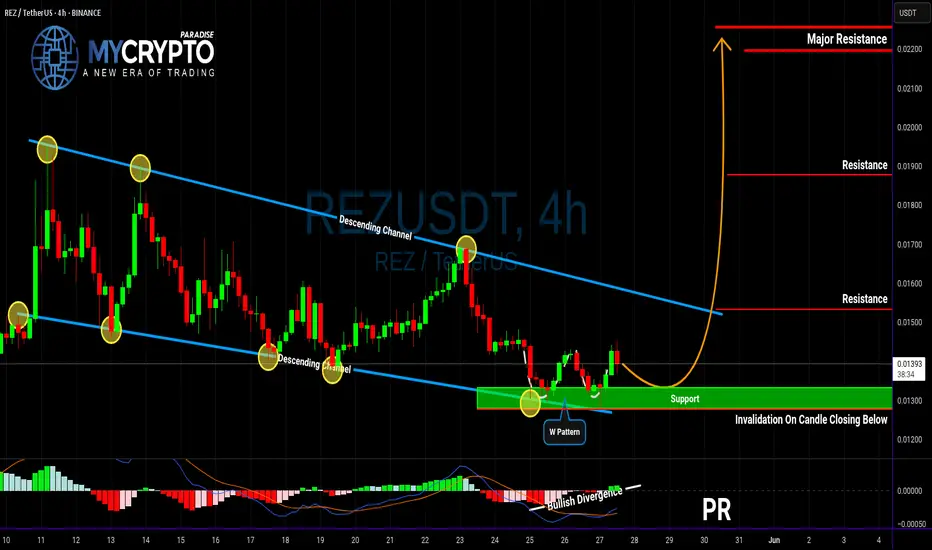
This Hidden Altcoin Could Explode—But Only If THIS Level Holds!Yello Paradisers, have you seen what’s quietly brewing on REZUSDT? A high-probability bullish reversal setup is forming, and if this level holds, it could lead to one of the cleanest altcoin plays we’ve seen recently. This isn’t just about one signal—REZUSDT is showing a rare confluence of bullish i
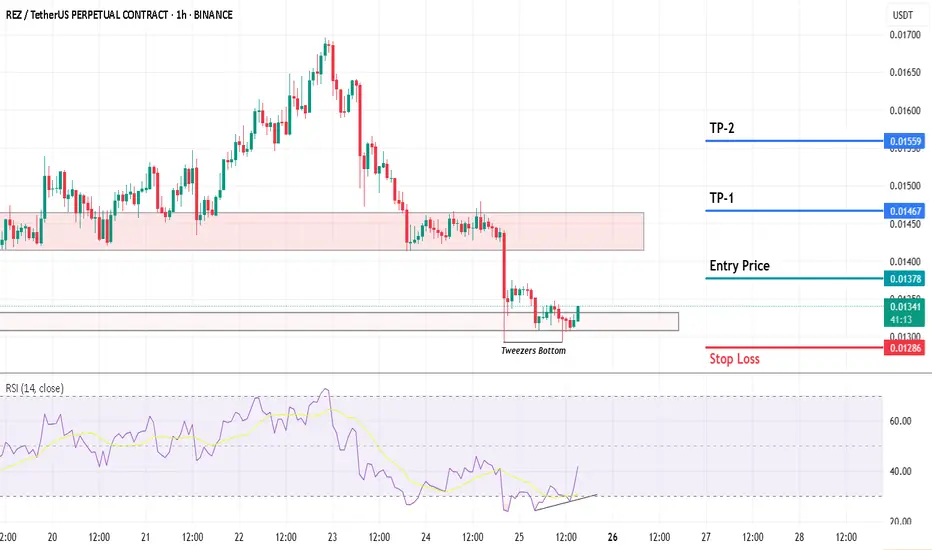
REZ/USDT – Potential Reversal from Tweezer Bottom | 1H Chart AnaREZ is showing early signs of a trend reversal on the 1-hour chart after forming a Tweezer Bottom pattern near a support zone. This pattern, combined with a bullish RSI divergence and a break of the downtrend line, suggests a possible shift in momentum.
🔹 Entry Price: $0.01378
🔹 Stop Loss: $0.01310
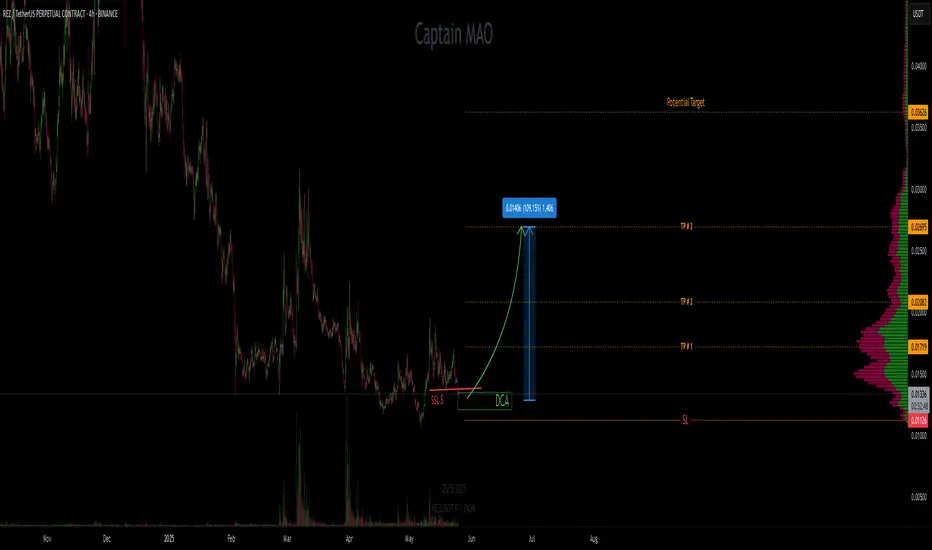
REZ/USDT next 100-200% ??After a prolonged downtrend over the past year, REZ is showing early signs of a potential trend reversal. The recent price action is forming a solid Support , suggesting accumulation and preparation for a breakout.
Target 1: $0.17
Target 2: $0.20
Target 3: $0.26
Potential target : $ 0.36
SL: $
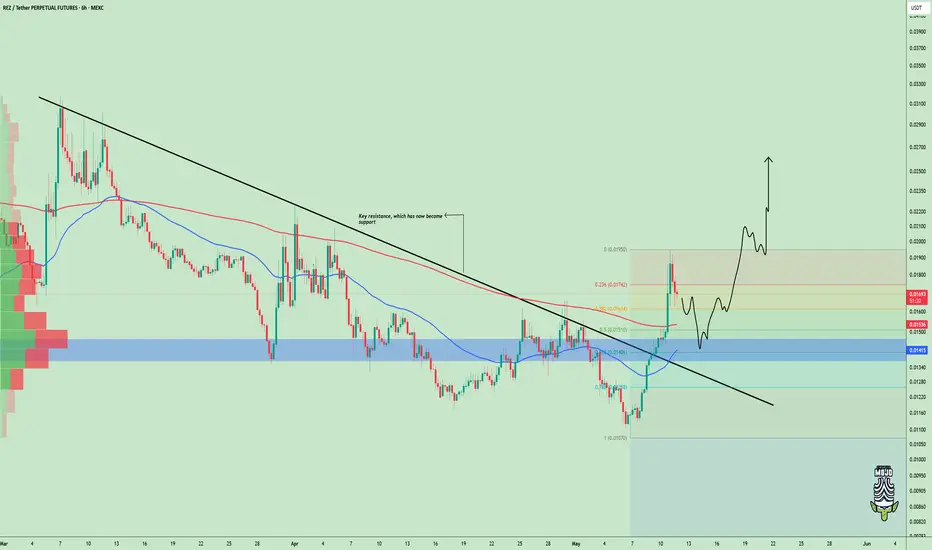
$REZ Reversal in Motion – Eyes on the Next Wave UpAMEX:REZ reversed major resistance into support upon coming out of a downtrend.
We are currently looking for a pullback towards the 0.618 Fib level at 0.015 before the next wave up.
The market structure is still bullish, and the chart is priming for an explosive breakout into $0.023+.
Keep alert
Waiting to explode $REZUSDTContinuation triangle for breakout BINANCE:REZUSDT ,
SL & Tp look at the chart

REZ 3D Setup – Classic Reversal Pattern in Play🔥 REZ – 3D Setup on Watch
📉 REZ is shaping up a falling wedge on the 3-day chart—a well-known bullish reversal pattern 🔍
A breakout from this structure could trigger strong upside momentum 🚀
👀 Keep this on your radar—the higher timeframe setup is starting to heat up!
See all ideas
Summarizing what the indicators are suggesting.
Oscillators
Neutral
SellBuy
Strong sellStrong buy
Strong sellSellNeutralBuyStrong buy
Oscillators
Neutral
SellBuy
Strong sellStrong buy
Strong sellSellNeutralBuyStrong buy
Summary
Neutral
SellBuy
Strong sellStrong buy
Strong sellSellNeutralBuyStrong buy
Summary
Neutral
SellBuy
Strong sellStrong buy
Strong sellSellNeutralBuyStrong buy
Summary
Neutral
SellBuy
Strong sellStrong buy
Strong sellSellNeutralBuyStrong buy
Moving Averages
Neutral
SellBuy
Strong sellStrong buy
Strong sellSellNeutralBuyStrong buy
Moving Averages
Neutral
SellBuy
Strong sellStrong buy
Strong sellSellNeutralBuyStrong buy
Displays a symbol's price movements over previous years to identify recurring trends.