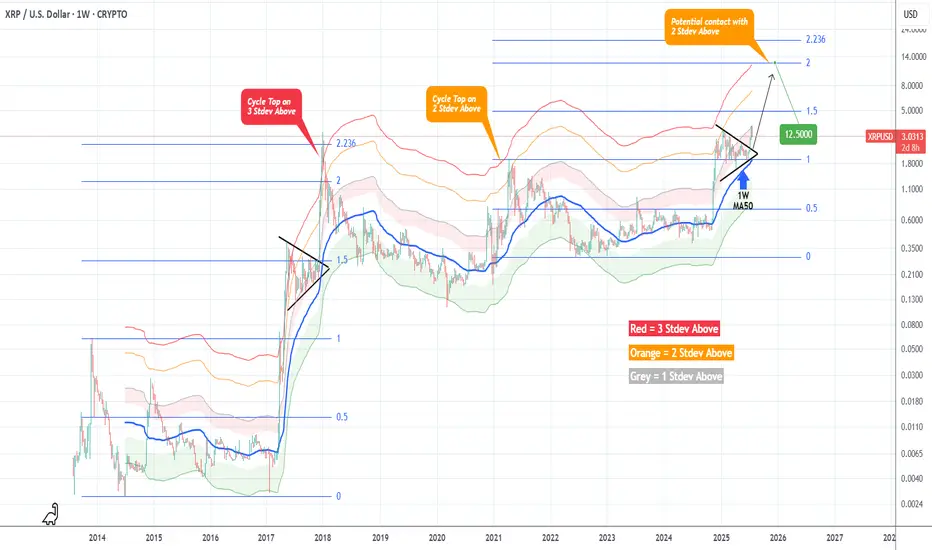
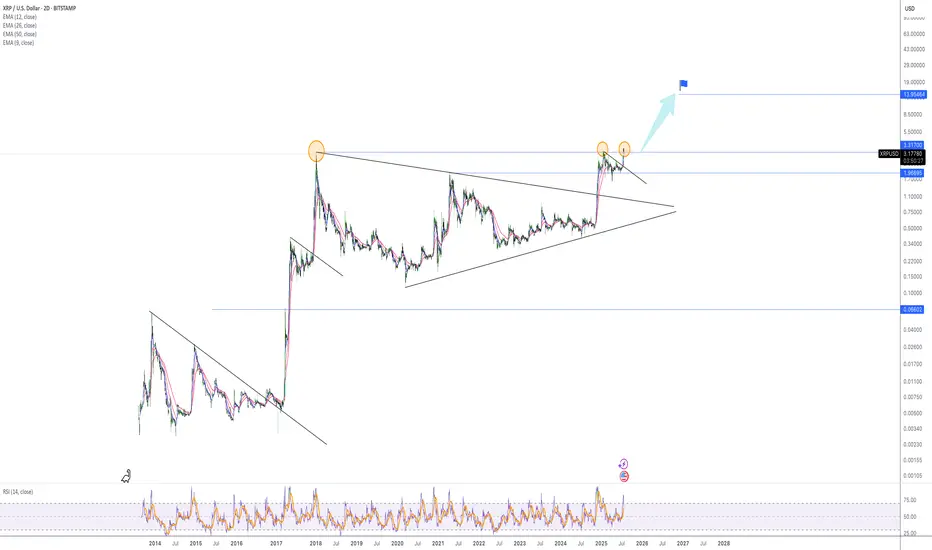
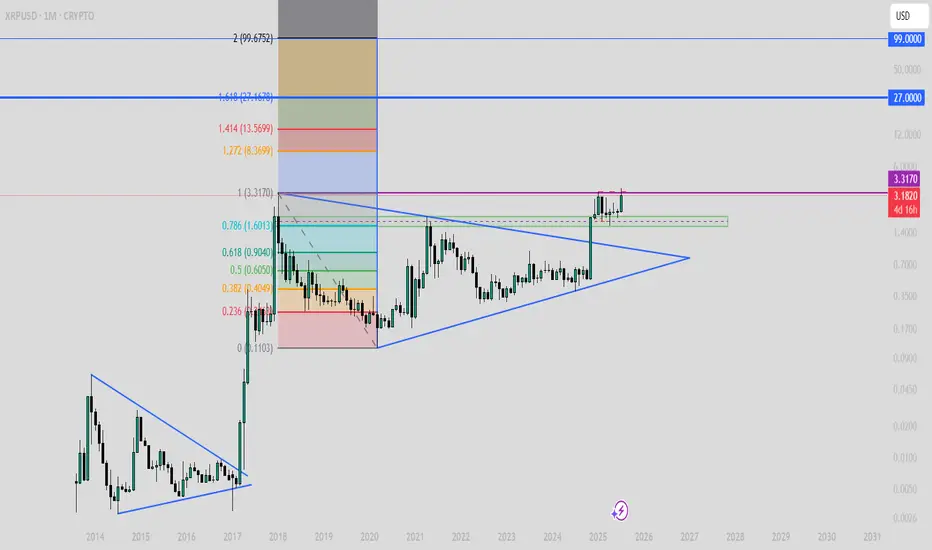
XRPUSD Massive break-out that can Top at $12.500XRP (XRPUSD) got out of its Accumulation Triangle (December 2024 - June 2025) making an aggressive break-out similar to the December 2017 one, which was after an identical Triangle pattern.
The fractals are so comparable that both mostly traded within the 1W MA50 (blue trend-line) and the Mayer Multiple (MM) 2 Stdev Above (orang trend-line).
As you can see, that MM trend-line was where the Top of the previous Cycle (April 2021) was priced and the one before was above the 3 Stdev Above (red trend-line).
Assuming that this Cycle will also go for the 'minimum' 2 Stdev Above test, it can make that contact by the end of the year on the 2.0 Fibonacci extension (Cycle Top-to-bottom) at $12.500.
-------------------------------------------------------------------------------
** Please LIKE 👍, FOLLOW ✅, SHARE 🙌 and COMMENT ✍ if you enjoy this idea! Also share your ideas and charts in the comments section below! This is best way to keep it relevant, support us, keep the content here free and allow the idea to reach as many people as possible. **
-------------------------------------------------------------------------------
💸💸💸💸💸💸
👇 👇 👇 👇 👇 👇
RIPPLE trade ideas
Xrp - The final bullish breakout!💰Xrp ( CRYPTO:XRPUSD ) will create new all time highs:
🔎Analysis summary:
After a consolidation of an incredible seven years, Xrp is finally about to create new all time highs. With this monthly candle of +40%, bulls are totally taking over control, which means that an altcoin season is likely to happen. And the major winner will simply be our lovely coin of Xrp.
📝Levels to watch:
$3.0
🙏🏻#LONGTERMVISION
SwingTraderPhil

XRP VS AI ?Hi,
This is fun, come on XRP $4.95
Average Speed (Points/Day) 0.053
Retracement Amount (Points) 0.80
Retracement % 51.28%
Probability of Retracement % 5-10%
Projected Next Move Size (Points) 2.09
Next Projected High Price 4.95
Estimated Duration to Next Target 39.4 days
Projected End Date 2025-09-10
All the best
Not a guru

XRP retracement levelsWhere is XRP next likely to head next?
$2.65 is the next price level down with 4 points of contact. This level was also a weekly high as well as the 0.5 fibbonachi.
Next level down is $2.34 with 6 points of contact.
There is a downtrend forming so a breakout of this trend could be bullish for XRP 📈
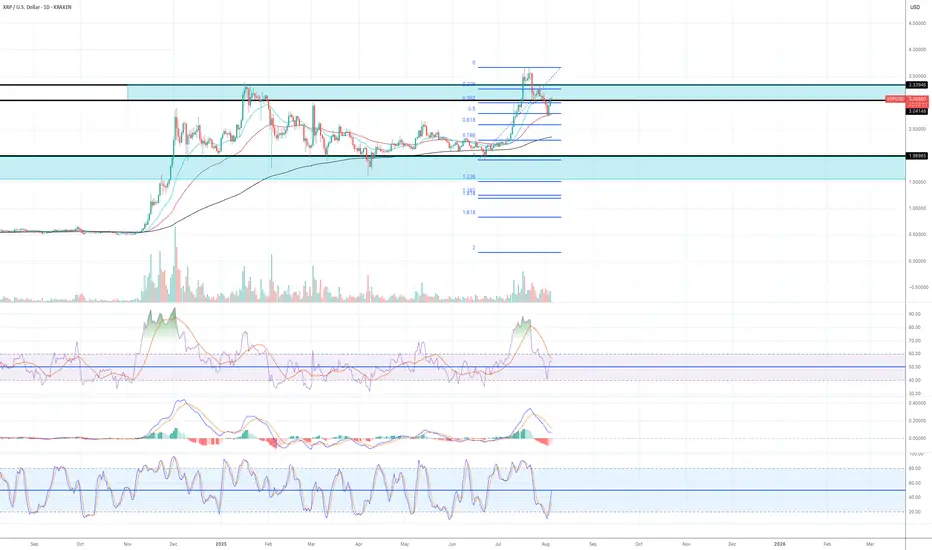
Working to move to the upsideMy views on XRP still hasn't change since my last article. The price action has been quite volatile, but if you look at it in the higher time frames such as monthly/weekly/daily, I think XRP is still working to move to the upside.
Daily:
1) The price has found the temporary support at Fib 0.5 level and EMA55.
2) yesterday's daily candle closed above $3.07 area (previous major resistance area)
3) Both RSI and MACD are still in the bull zone.
4) Stochastic has reached the oversold territory the lines have crossed and now are moving to the upside.
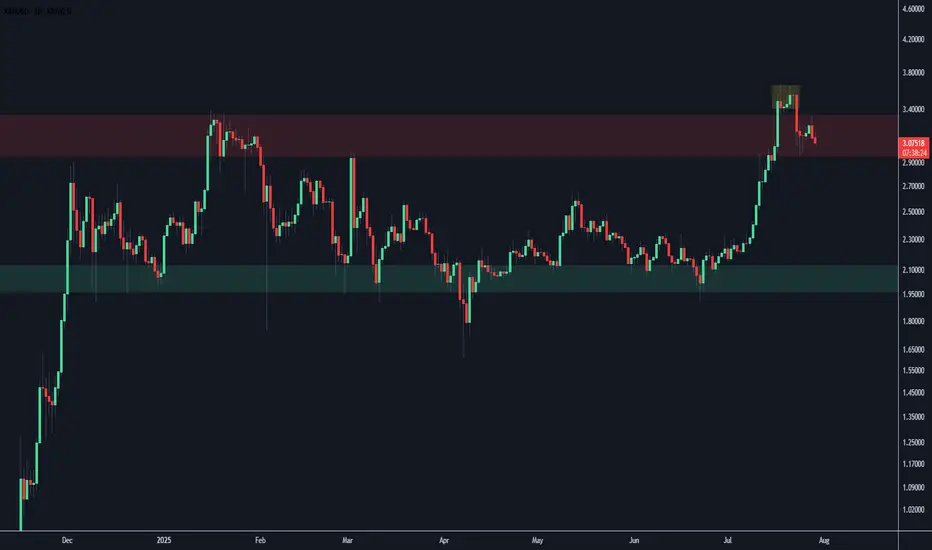
XRP Daily ChartReally starting to move down after ranging between this resistance this week.
Could easily make all time lows as easily as all time highs, not a bad price to take some profit.
$XRP on Daily TF is not bullish!! (Read Caption)Need a Strong Weekly breakout candle to invalidate this scenario!
Relax and watch the show - target = 13 dollarDear,
In a bull market it is normal to see a 10, 20% pullback before the next impulsive wave.
It is a normal level for XRP to reject for now because we came near the ATH.
With the next test of ATH i believe we will move fast trough it.
My personal target for this bull run is 13 dollar. It can go higher but i believe the market will be overbought.
Currently the RSI levels are cooling of, the 1H and 4H oversold so i believe we will reverse soon.
Take care.
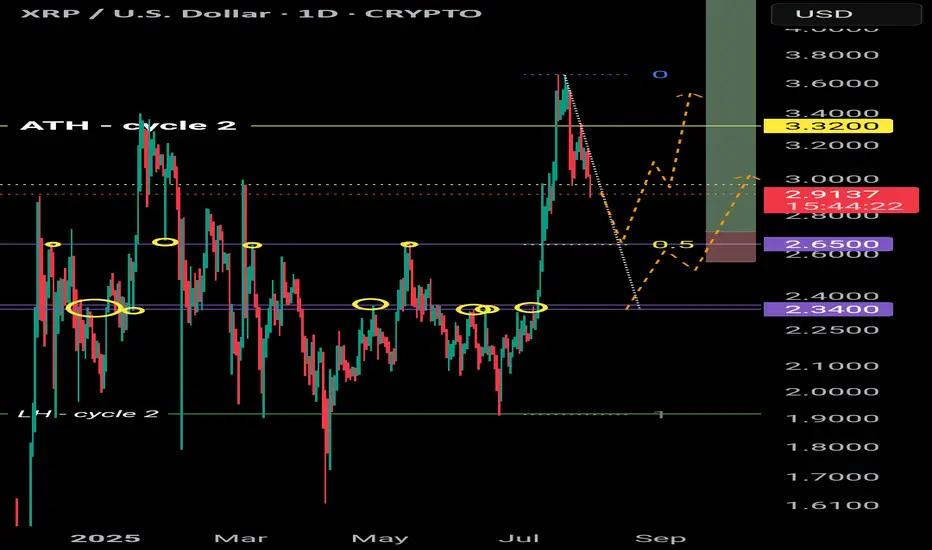
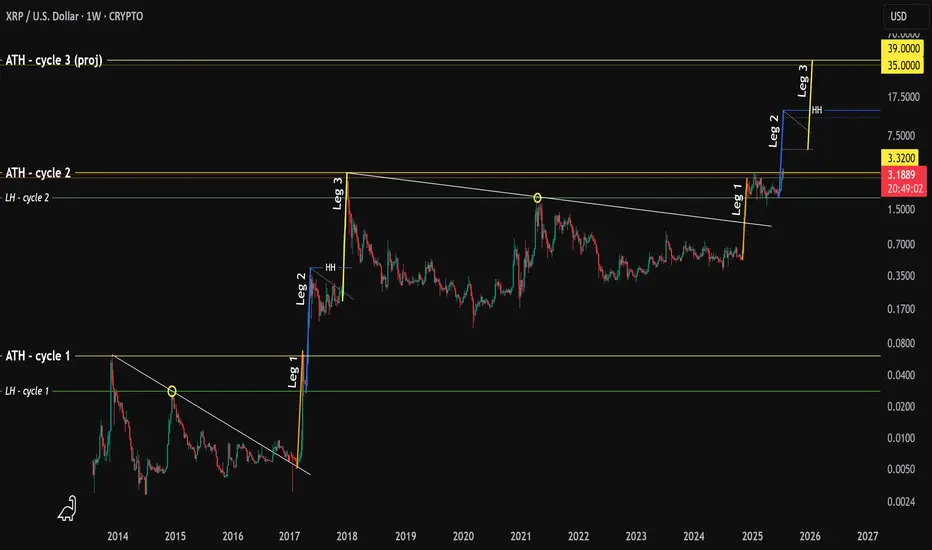
XRP - history repeating?Hello.
I'm going to walk you through what happened in the early years of XRP p.a. and how this fractal might play out today.
Here's what happened.
1. A high was printed in 2013 (ATH)
2. Followed by a lower high (LH)
3. XRP broke out of a downtrend 📈
4. In 2017 price increased 1,280% finding resistance @ ATH (we'll call this "Leg 1")
5. The LH then acted as support, followed by sideways price movement
6. Price increased 1,460% creating a higher-high (or "HH") which surpassed the ATH and this is "Leg 2"
7. Again, sideways price movement.
8. An increase of 1,560% creating a new ATH Dec 2017 - "Leg 3"
What's interesting here is that each leg takes 5 weeks to play out (that's 5 green weekly candles to put a finer point on it).
Fast forward in time - what do we see?
A high..
A lower high....
A breakout of the downtrend..
Followed by..... you guessed it... 5 green weekly candles
Hold on...
A rejection at the ATH
The LH acting as support...
With sideways movement .. 👀
The symmetry is quite profound and provides us with an idea of what will happen next.
If we consider the move in Nov 2024 as "Leg 1" then one could argue that "Leg 2" is currently in play.
Leg 1 was not as significant as the uplift we saw in 2017 (480% vs 1,280%)
However, if we assume that the variance between Leg 1 and Leg 2 rhymes then the projected uplift from the LH would be 550%.. making XRP price roughly $11-13
It follows that price will then move sideways/consolidate/capitulate for several months.
Followed by one last move to the upside which, using the variance between Leg 2 and Leg 3 put the final leg @ 585% or $35-39.
Wild guess but based on historical Bitcoin halving peaks and XRP ATH in both cycle 1 and 2 landed at the back end of Q4, it is assumed the same could happen (put simply: the end of 2025).
You're welcome.
XRP/USD Breakout Watch: $3.22 Target in SightA key blue trendline on the XRP/USD chart that reflects market sentiment. If price breaks above it with strong volume, we could see a rally toward $3.22.
Support zone: $0.55–$0.60
Bullish case: Improved sentiment, easing tariffs, and regulatory cooling
Strategy: Wait for breakout confirmation before entering
Share your thoughts — are you preparing for a breakout?

XRPUSD 4 Hour BottomXRP has broken out of the weekly wedge leaving a long weekly candle stick close. Price has pulled back indicating it it ready for the next leg higher. Daily candle closed bullish and 4 hour time from has double bottom.

XRPUSD Long, short, longWhole market is manipulated every minute... My prediction can be wrong but I see things this way right now ... Would be grateful for you to share your point of view ...
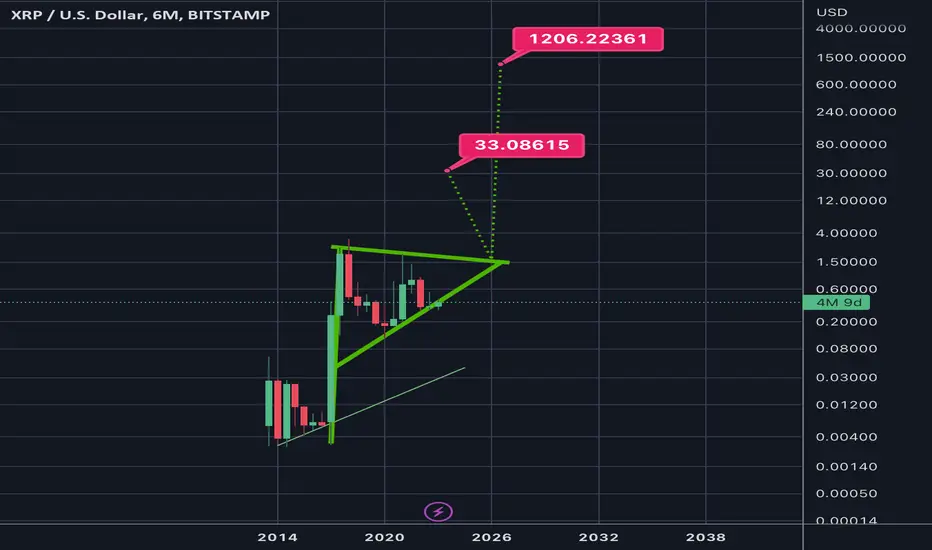
6month log chart on xrpusd suggests crazy potential targetsThe bull pennant we are in shown here on the 6month time frame seems to have a symmetrical triangle for its flag. The breakout target for just the symmetrical triangle is in the $33 range. Factor in the pole of the flag and the potential target skyrockets to 1.2k. Definitely not financial advice and certainly no guarantee it will hit either target as it’s still up in the air if log chart targets reach their full target as reliably as linear chart patterns do. Even if it does hit these targets you can see the apex of the pennant in its current trendline trajectories doesn’t occur until 2026. The only way I see price remaining inside this triangle for that long is indeed if the SEC ripple case is extended through appeal and taken to the Supreme Court. Hopefully not but it isnt impossible. If this were to occur I would simply keep dollar cost average accumulating until it was to break out from the triangle which would give me more opportunity to take some profit at the first target but then also hold onto some of the asset in case it does indeed reach the full bullflag breakout somehow all the way up at 1.2k. Simply posting this hear so I can see how well price action chooses to follow this pattern over the next year or few. Once again *not financial advice*
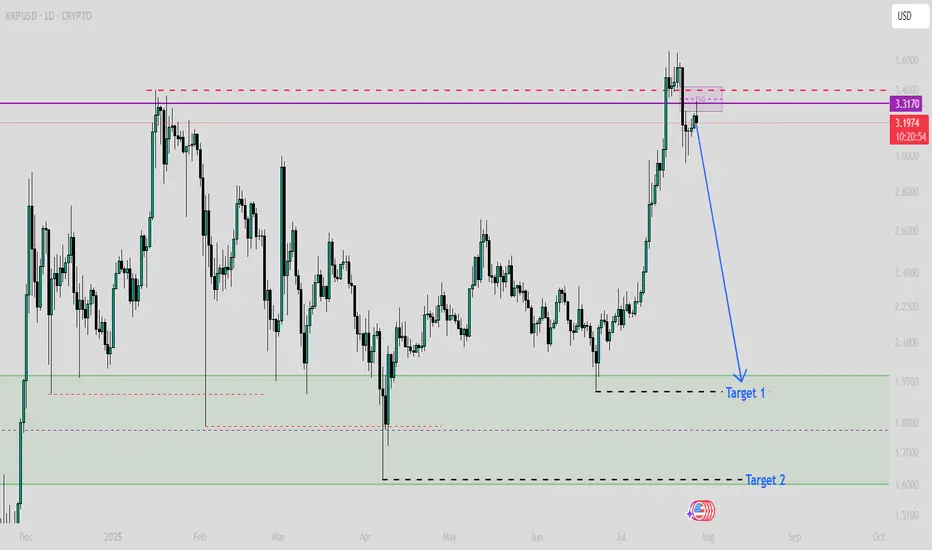
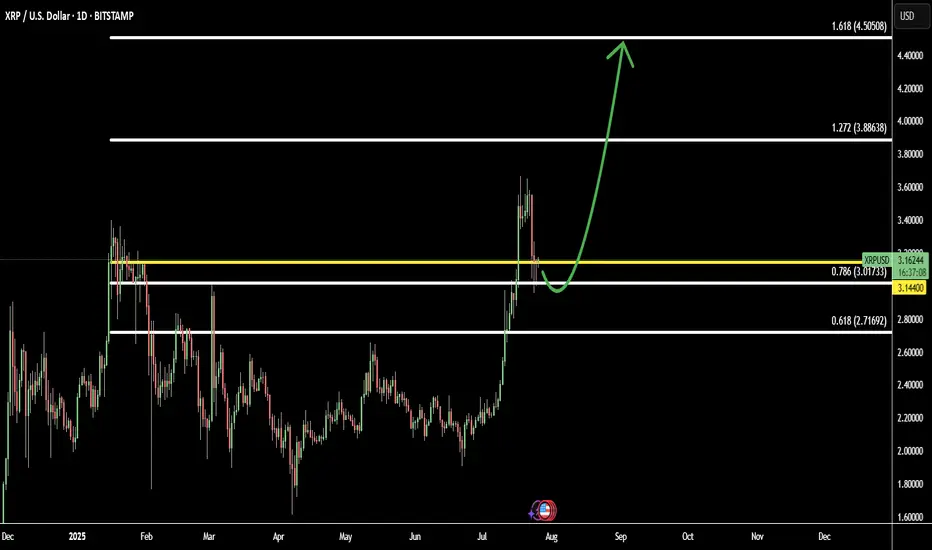
XRP Pullback Complete: Bulls Step In Toward Fibonacci TargetsAfter a healthy pullback, XRP (XRPUSD) is showing signs of renewed strength as new buyers re-enter the market. This correction phase appears to have attracted smart money, setting the stage for the next bullish leg.
The chart structure suggests XRP is now in a re-accumulation phase, with price aiming for mid-term Fibonacci targets:
Target 1: 1.272 Fib – 3.88 - continuation zone after breakout
Target 2: 1.618 Fib – 4.50 - strong extension level aligned with prior highs
If momentum holds and volume builds, XRP may resume its upward trajectory toward these targets in the coming weeks.
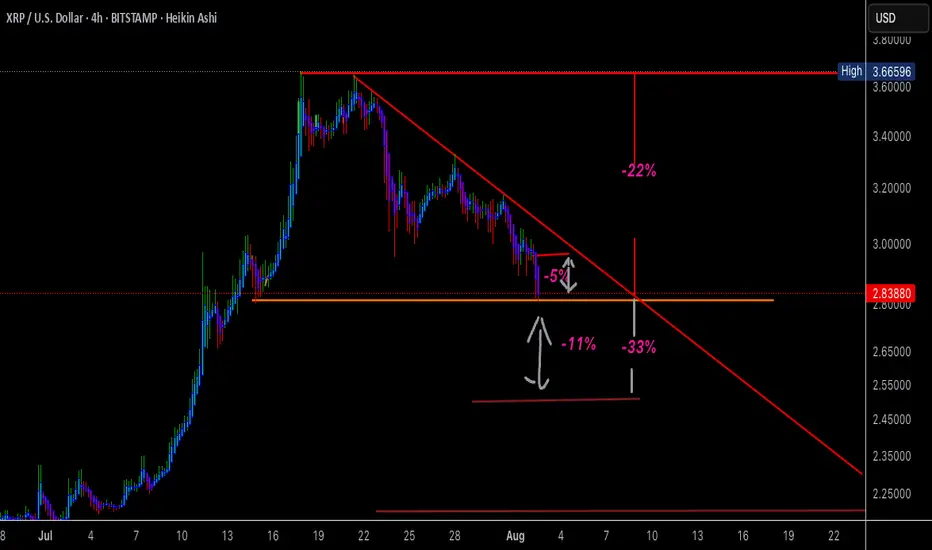
XRP to 2.80So, conjugate waveform or Elliot wave retracement is 5 steps. With 3 being the longest. 5 obviously the lowest. Once a demand or supply zone is tapped/broken into, they want the extreme of that zone. That's why I think 2.80 low.
With, 1234 break on Z out of the bearish Pennant into the demand. Forming the bottom of the, now larger C&H.
And aAaAway we go!

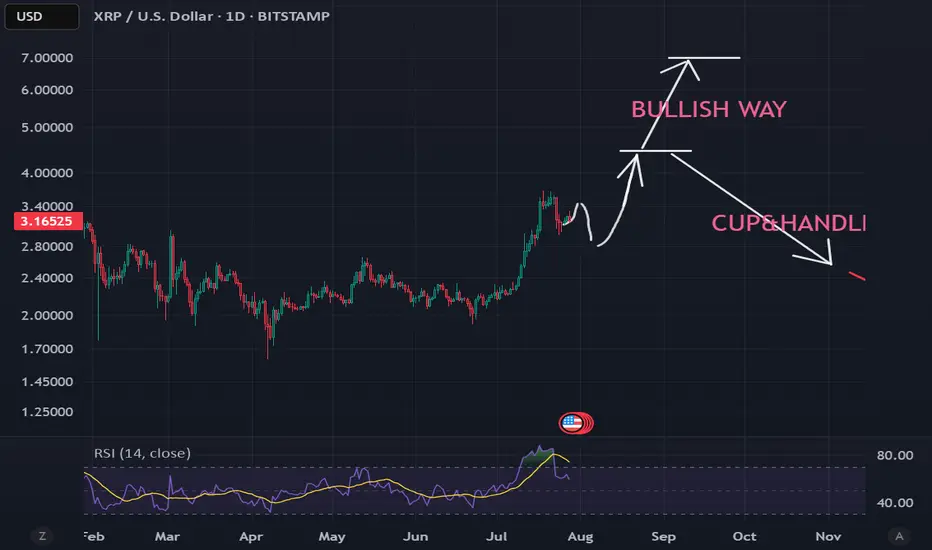
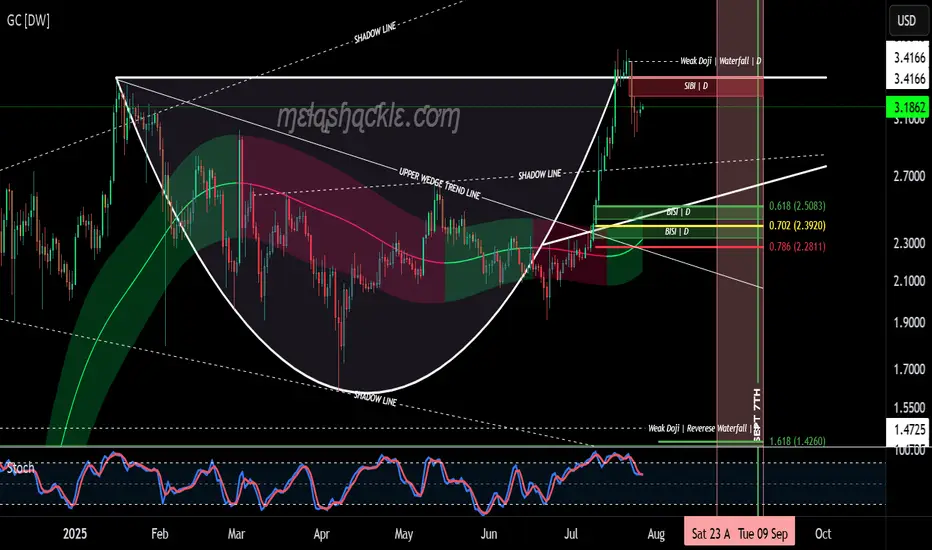
XRP Cup & Handle Pattern on the Daily Chart.XRP is now forming the handle on a very nice cup-and-handle pattern on the daily chart, starting at the previous all-time high set on January 16th, 2025.
But this pattern isn’t all sunshine and rainbows. The price of XRP could drop down into the $2.50 range—toward the bullish fair value gaps I’ve outlined at the bottom of the handle—before making any credible gains or a major breakout to higher levels.
I do believe we’ll see much higher prices in XRP in the coming years as we continue moving into the new global digital financial system. However, for this pattern to fully play out, there will likely be some pain before the pleasure.
I’d keep a close eye on the pink area marked on the charts—spanning from August 23rd through September 8th—as a potential zone for bearish price action.
Luckily for me, my XRP bags have been filled since before the Trump election pump, so I don’t personally need to buy more—unless I see a clear buying opportunity.
Good luck, everyone!
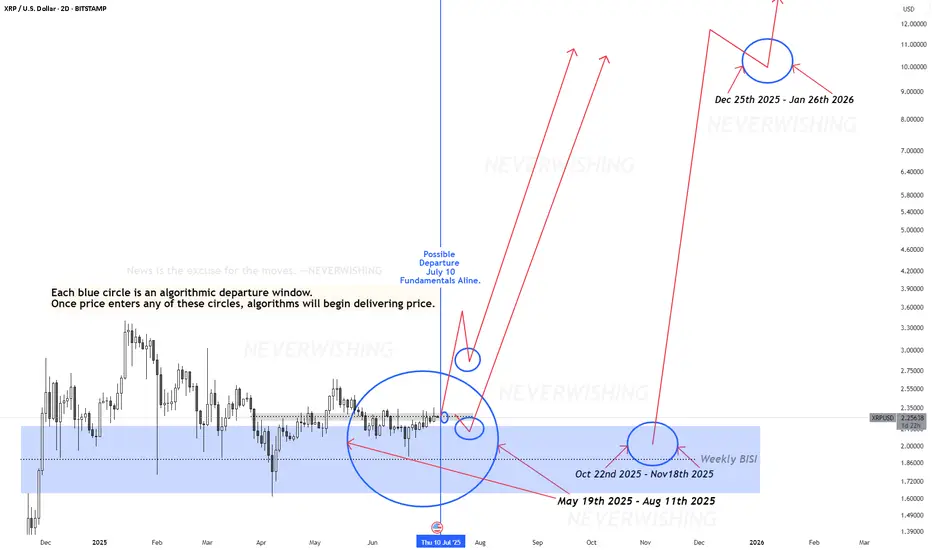
XRP: $10 Breakout? Watch These Algorithmic Windows!This XRP analysis highlights "algorithmic departure windows" (blue circles) where explosive price moves can occur.
Whenever price enters a blue circle, XRP can launch to $10 or higher instantly or within 33 days—no matter the news.
**Key Dates to Watch:
**Possible Departure: July 10, 2025 (fundamentals align)
**Other Windows: May 19 - August 11, 2025; October 22 – November 18, 2025
**Major Target Zone: $8.50–$11.50 (December 25, 2025 – January 26, 2026)
History shows that once price breaks out from these departure windows, XRP can reach its upper targets rapidly—sometimes in a single day, but almost always within 33 days or less.
News is the excuse for the moves—algorithms deliver the predetermined price.
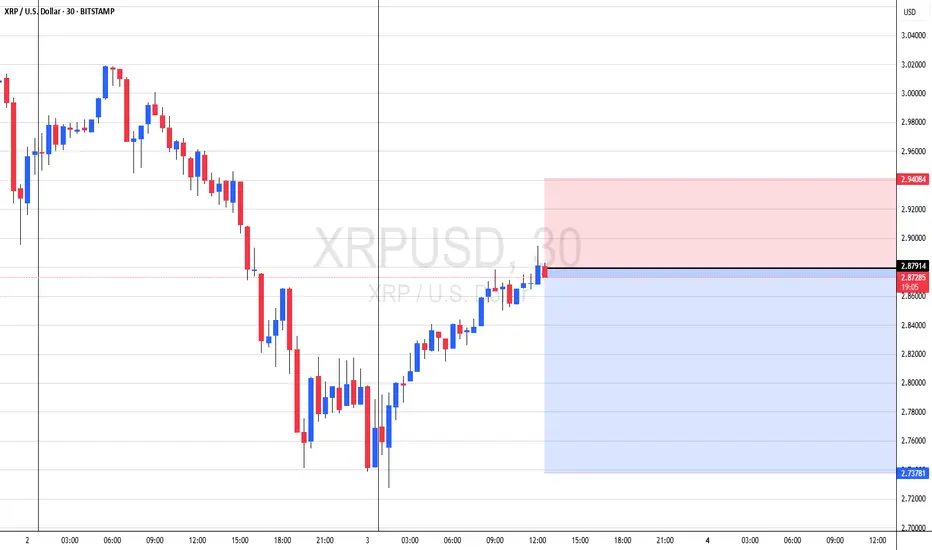
XRPUSDT Buy Pullback to Weekly LevelBINANCE:XRPUSDT pullback to weekly level.
Note: Manage your risk yourself, its good trade, see how much your can risk yourself on this trade.
Don't be greedy.
Use proper risk management
Looks like good trade.
Lets monitor.
Use proper risk management.
Disclaimer: only idea, not advice

xrp correction time rsi indicates oversold RSI is oversold on the 1 day daily correction happening next stop $285 ish good luck
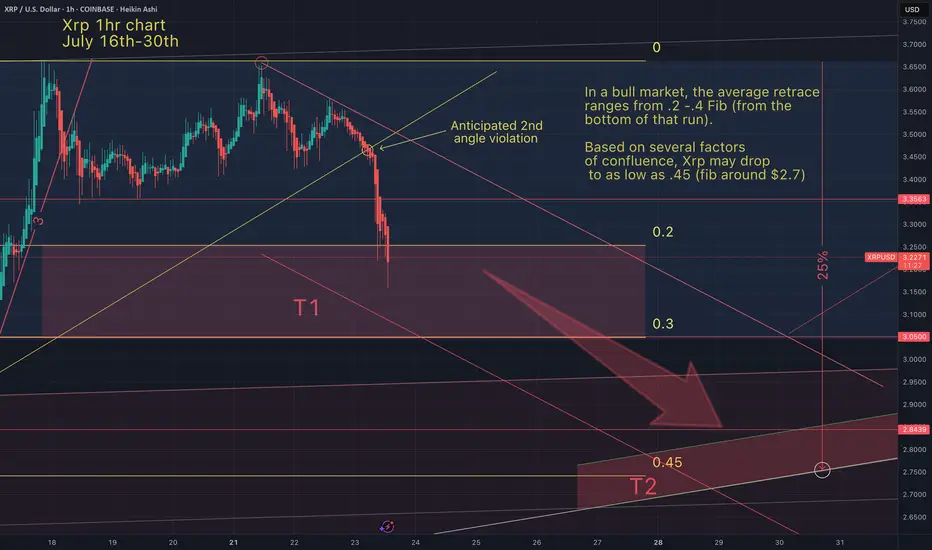
Xrp's next low I've already taken all profit at the 3rd angle vioation at the top of this run. Now I will buy back in 20%-25% lower, when Xrp hits this next beasrish target between $2.75 - $3.0.
See you at the top of this next rally up.