XRP: PullbackRipple’s XRP has once again seen a significant pullback since last Monday, raising the possibility that the high of turquoise wave B may already be in. For now, however, we continue to allow room for this corrective move to extend up to resistance at $4.09, before turquoise wave C drives the altcoin lower toward the magenta wave (2) low. With XRP still trading well above the $0.38 support level, the next upward impulse—magenta wave (3)—should then begin to take shape. Alternatively, there is a 33% chance that this bullish move has already started; however, this scenario would only be confirmed by a decisive break above the $4.09 level.
📈 Over 190 precise analyses, clear entry points, and defined Target Zones - that's what we do (for more: look to the right).
RIPPLE trade ideas

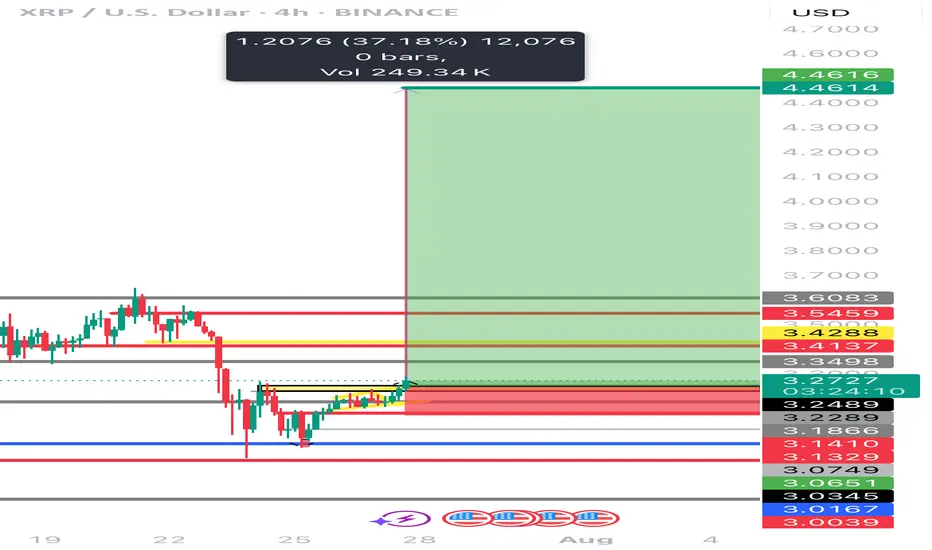
Can XRP Run 30% next week While we seen a clear cool of from XRP bullish movement in the last week are we now looking at an aggressive opportunity for the this sssest class shoot up %30 to create a new ATH of $4 and possibly beyond? Interesting times ahead with some strong news heading into next week XRP Army will have to wait and see what news comes out and will that influence XRP’s price point. The asset class sits around $3.28 at the time of this article post.
Cheers FC / EDub / AJ
XRP Confronts Daily SMA ResistanceFenzoFx—XRP remains bearish, trading below the 50-period daily SMA at around $3.18. The SMA acts as resistance. Immediate support lies at $2.96. A break below this level may trigger further downside toward the $2.66 demand zone.
On the upside, a close and stabilization above $3.27 would invalidate the bearish outlook. In that case, momentum could push prices toward the previous highs at $3.65.

XRPUSD broke the trendline resistance likely will go upXRPUSD was trading in down ward and recently formed the double bottom and broke the resistance and will likely to go up.

XRPYeah looks like we might be losing some strength ..
maybe after J.P speaks later this week could just makes us bounce . Until then it’s a fight to get back over the MA .
So we could go lower short term
XRP Temporary Pull Back Followed Bu Move Up To $4.00XRP Created a new high. Looking for a pull back to the 50% retracement level. Followed by a move up to the 141 fib level of around $4.00

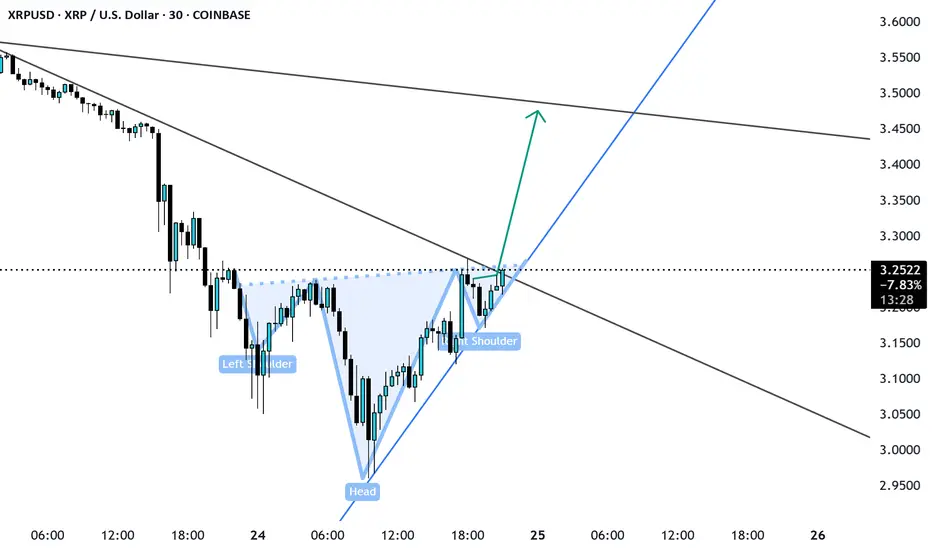
XRP SHS pattern Enter on Neckline breakout XRP pulled back from the support of 3.0 currently formed a head and shoulder pattern is likely to grow till 3.4 -3.45. let us see.
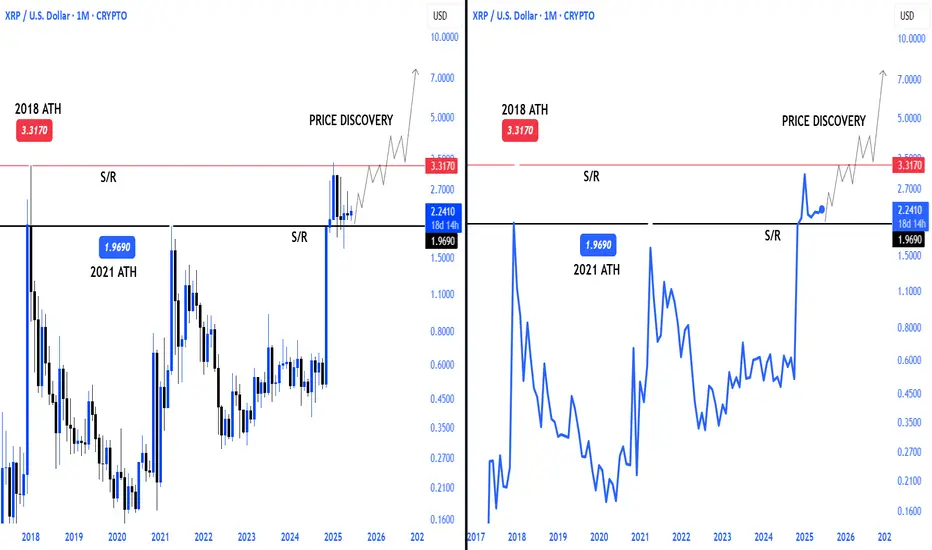
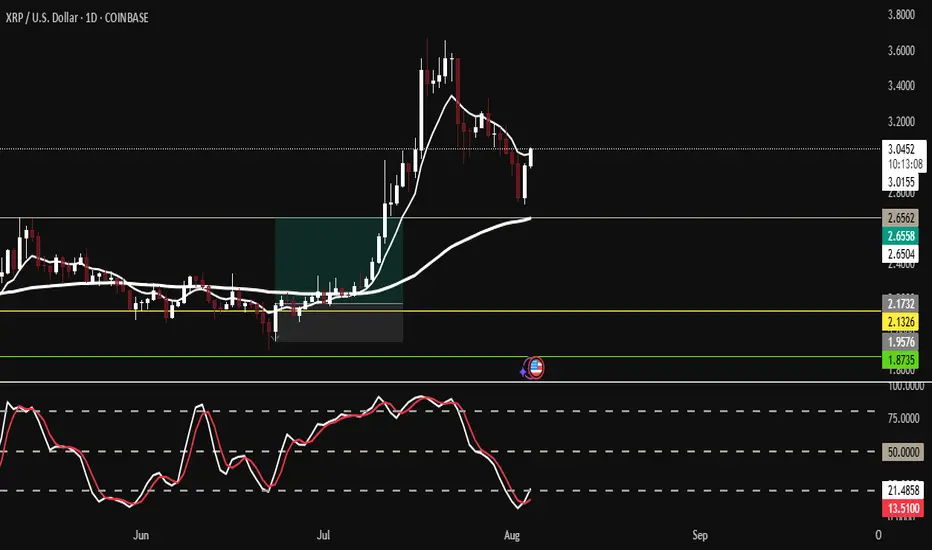
XRP CRYPTOCAP:XRP price discovery will be there sooner or later
2021 I think the current accumulation process on the ath price will be the trigger for an upward movement
Retest before it goes again ?This set up is not usually on my playbook but seen the strong momentum the XRP is having, this hidden divergency is as good as it comes, with good potential to workout. I believe if it does the first target will be around 4.30.

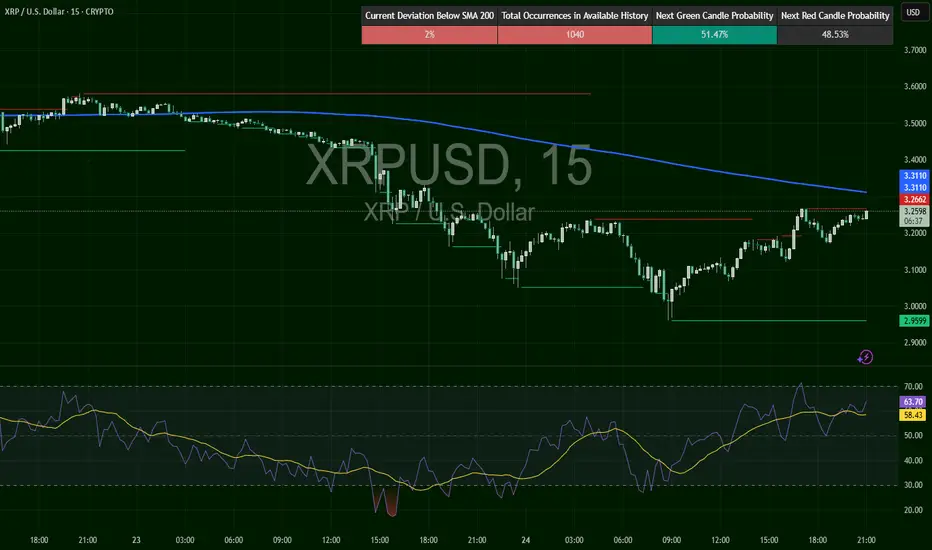
XRPUSD – Reclaim or Reject? Critical TestXRP flushed hard to $2.95, then reversed and is now pressing back into prior breakdown levels at $3.26–$3.31. 200 SMA above is resistance at $3.31. RSI at 63.14, bullish and rising. This is the make-or-break retest zone. Break it, and we could see $3.40+ fast. Rejection = trap.
You Are Getting Ripped Off On XRP Contd.... Once again for all the hype on xrp it still can not break the all time high.
Like I said 2 weeks ago when the price was at 3.60, I will see you at $3.00 by August 1st..
Its fading and the death nail will come 5-8 days from now.
The whole crypto market will crash. The slide starts in August.
I will be buying XRP for 55 cents in 2027.
Also Silver will outgain XRP in the next 2 years by 400 percent.
Laugh and mock all you want.
Come see me August 1st.

XRPUSD Technical Analysis — Bearish Retracement in PlayXRPUSD Technical Analysis — Bearish Retracement in Play
Overview:
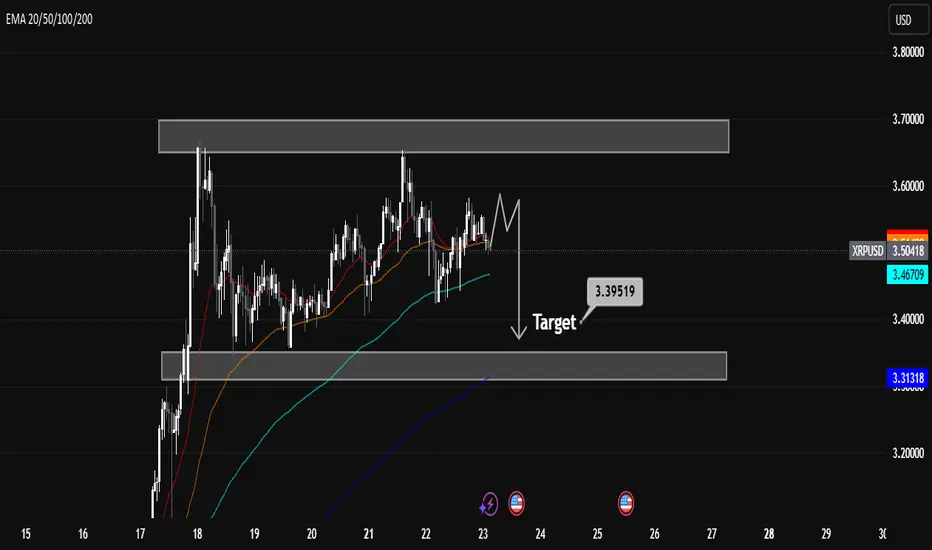
XRPUSD is currently exhibiting signs of bearish momentum after failing to break through a key resistance zone. Price action suggests a potential retracement towards the marked target level of 3.39519, supported by multiple technical indicators and price structure.
Key Technical Levels:
Immediate Resistance: 3.70 – 3.75 (strong supply zone; price rejected here multiple times).
Support Zone: 3.30 – 3.39 (prior demand zone and EMA confluence).
Target: 3.39519 (short-term bearish target as marked on chart).
Current Price: 3.50 (as of chart time).
Indicators & Price Action:
EMA Analysis:
EMA 20/50 (red/orange) are flattening out, indicating weakening short-term momentum.
EMA 100 (cyan) acts as current dynamic support.
EMA 200 (blue) is far below, suggesting room for deeper retracement if sentiment weakens.
Price Structure:
XRPUSD formed a double top near resistance, followed by lower highs.
Recent candle patterns show indecision and possible distribution.
Projected bearish leg toward 3.39519 suggests sellers are in short-term control.
Conclusion:
XRPUSD is likely to retest the 3.395 support level after rejecting the upper resistance zone. The bearish structure is supported by EMA alignment, price action, and repeated failure to break resistance. A break below 3.395 could open further downside towards 3.31. However, a strong bounce from support could invalidate this setup.
Trade Bias: Short-term bearish toward 3.395, watching for reaction at support.
XRP to $6?The optimistic target of $6 in 30 days is overpromised, unless a major developement comes from the White House.
Read more at: www.cointrust.com

XRP/USD – Bearish Shift After Momentum Exhaustion🧠 Summary:
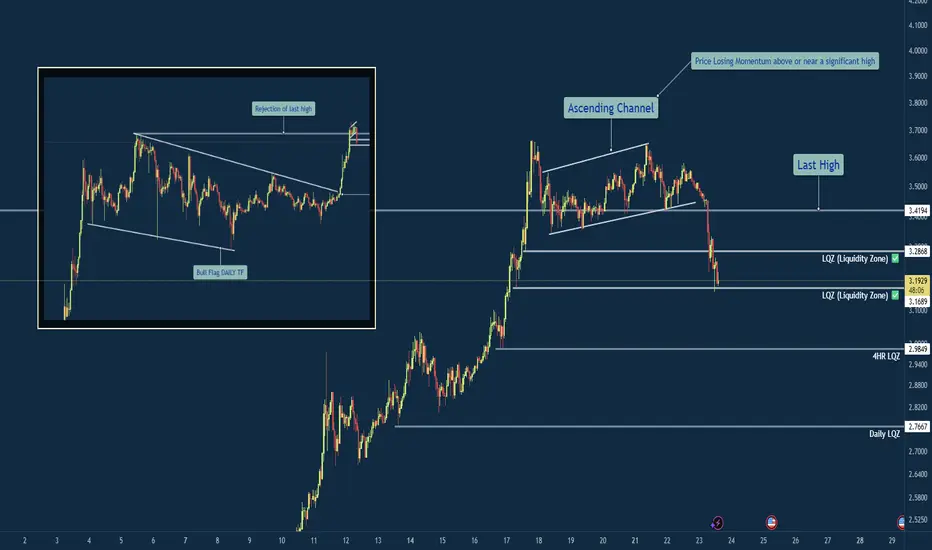
XRP/USD has shown clear signs of exhaustion after sweeping the previous high. Following a breakout from a daily bull flag, price struggled to hold momentum near the key level of 3.4194, forming an ascending channel that eventually broke down. Liquidity zones below current price are now in focus.
🔍 Technical Breakdown:
✅ Daily Bull Flag → Broke out with strength
⚠️ Rejection near Previous High (3.4194) → No follow-through
🔼 Ascending Channel → Formed post-impulse, now broken
📉 Momentum Shift → Structure flipped bearish
💧 Liquidity Zones (LQZ) below price acting as magnets
📌 Key Levels:
🔹 Last High: 3.4194 (Rejection Point)
🔹 Broken LQZ: 3.2868
🔹 Current Support: 3.1689 (LQZ - being tested)
🔹 Target 1: 2.9849 (4HR Liquidity Zone)
🔹 Target 2: 2.7667 (Daily Liquidity Zone)
🧩 Confluences:
Liquidity sweep of prior high
Momentum loss near key resistance
Break of ascending structure
Retesting broken zones with room below
⚠️ Final Thoughts:
This trade is playing out just as we described in the post before this on XRP. We discussed watching how price would react to this area before making any type of "Late Entries". XRP is still a huge and vital part of the Crypto Eco System so long term i am holding my Long position. The areas on the chart are still great areas to buy in at "Dollar Cost Average". This will be one of those positions that though it may be bearish on the lower time frame you need to zoom out and always keep an eye on the weekly and daily chart before making any drastic moves.
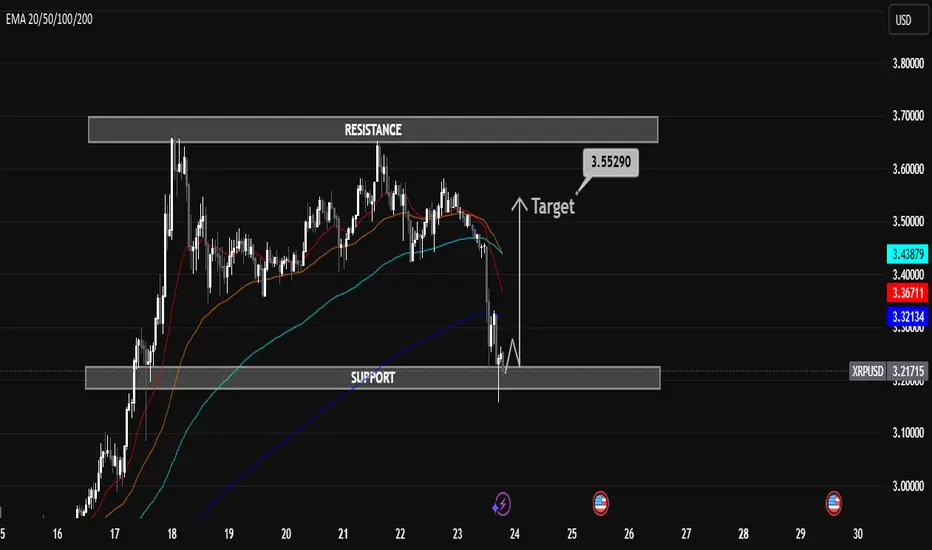
XRP/USD H1 Educational Market Analysis – Support-Based XRP/USD H1 Educational Market Analysis – Support-Based Long Opportunity
🔍 Structure Overview:
• Support Zone: $3.21 – $3.23
This level has acted as a strong liquidity pool and base for past bullish moves. Price has tapped into it, showing signs of potential demand returning.
• Resistance Zone: $3.65 – $3.70
Acts as a key supply zone, where previous bullish attempts failed. Targeting this area after a rebound is technically sound if structure confirms.
⸻
🔄 Price Action Insights (H1):
• Price broke down through EMAs (20/50/100/200), confirming short-term bearish pressure.
• A rejection wick from support hints at possible absorption of selling pressure.
• If price forms a higher low structure above $3.25 and reclaims EMAs, a potential bullish reversal may unfold.
⸻
🧠 Educational Note:
• H1 charts are ideal for intraday strategies, and this structure provides a clear example of:
• Support-resistance dynamics
• The use of EMAs as trend confirmation tools
• Reversal vs. continuation setups
⸻
🎯 Intraday Bullish Scenario:
• If price holds above $3.21 and breaks above the $3.40 (EMA cluster), bulls may push toward the $3.55290 target.
• This level aligns with the mid-range of the resistance zone, offering scalp-to-swing potential.
⸻
🚫 Bearish Risk:
• Failure to hold $3.21 could lead to a deeper correction toward $3.10 or even $3.00.
• Confirmation of bearish continuation would be a lower high rejection from EMAs without reclaiming them.
⸻
📌 Summary:
On the H1 chart, XRP is at a critical support. Watch for a clean bounce and break above EMAs for a move toward $3.55. However, losing $3.21 could attract further downside. Use price action confirmation before entries.
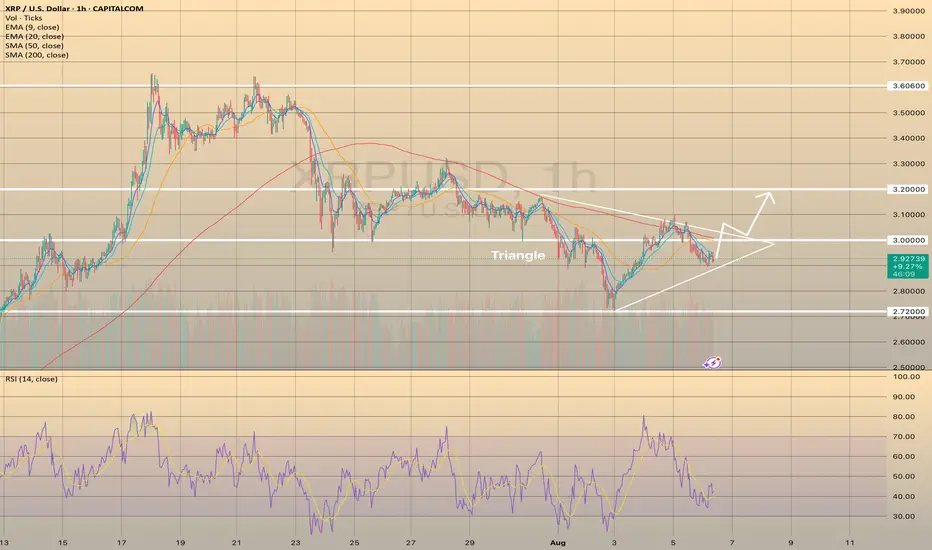
XRPUSD formed the Triangle pattern. The price may increase.XRPUSD formed the Triangle pattern. The price may increase.
XRPUSD has been declining since July 23, reaching the lowest mark at 2.72000 on August 3. Since then the price started to form the triangle pattern. It is not a reversal chart pattern, however, RSI indicator started to show some strength of the bullish momentum. In this case, if the price breaks through the SMA200 on hourly chart and holds above it and the level of 3.00000, the following rise towards 3.20000 is expected.
XRP ARE WE GOING TO $4 ANALYSIS Good afternoon
So looking at XRP we can spot a couple things :
Bullish Side: If we can break the high at 3.07 then 3.48,3.59,3.71, and 3.99 makes sense
Bearish Side: If we go below 2.88 then a drop down to 2.67 then 2.45 makes sense
Trade Smarter Live Better
Kris

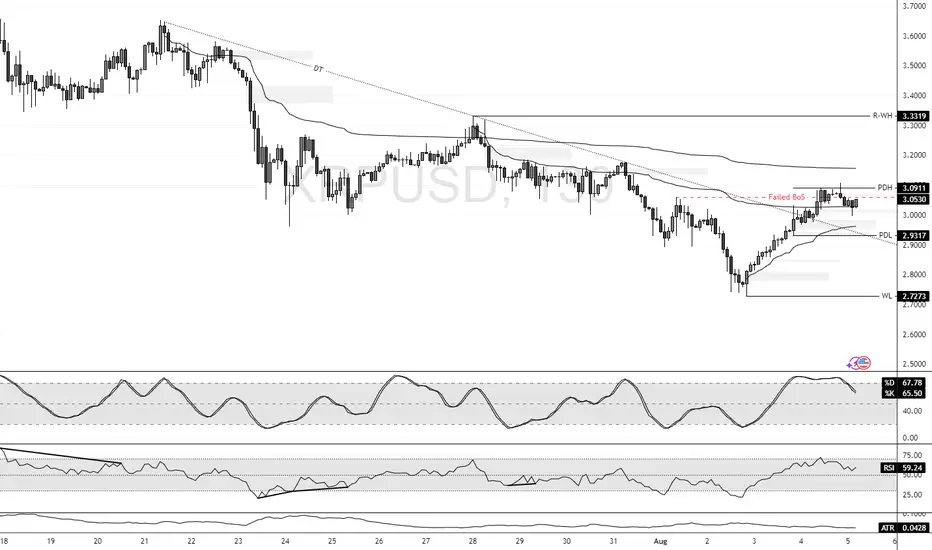
XRPUSD – Fade then HoldXRP saw an early-week fade from the $3.12 zone and is now trying to hold support above the 200 SMA ($2.96). RSI is gradually turning back up (44.27 to 50+ range soon), showing first signs of stabilization.

XRP's Failed Structure Break Signals Further ConsolidationFenzoFx—XRP/USD currently trades around $3.045 in a low-momentum market. Stochastic exited the overbought zone and is declining, signaling strengthening bearish momentum. The failed structure break in the New Session suggests a liquidity sweep with weak bullish interest.
Immediate resistance stands at $3.091. Technically, price is expected to decline toward the previous day's low at $2.931, a key liquidity zone. Please note that the bearish outlook is invalidated if price exceeds $3.091.
XRP ?
Hi
Don't miss 3-3.05 range
I think it's a value area for now.
Risking 0.05c only
Potential Upside as per previous analysis, AI etc
All the best
Not a guru

Vague idea of purchaseXRP after this sideways we had a median breakout if prices remain like this and there is a pullback to the next support.
It would be a huge trigger to buy until the next resistance region.
#XRPUSD 1st Aug Looking for one more move higherBINANCE:XRPUSD Looking for one more push to higher, and bullish as far as IV is intact. Any rally should find buyers in 3-7 swings and reach one more high minium.

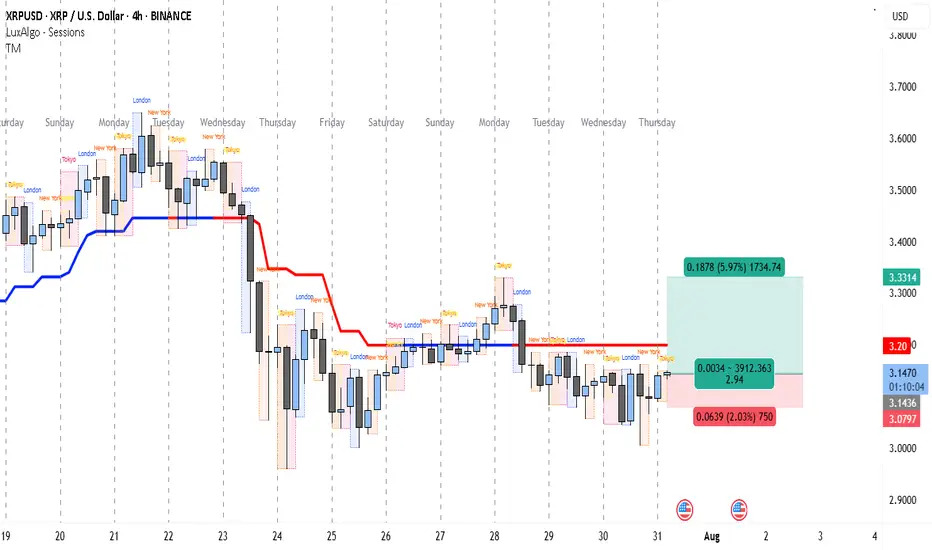
XRP’s 1:3 R:R Setup Could Pay Off FastThe 4-hour chart for XRP/USD indicates a market that has been under selling pressure since the sharp drop around July 23rd, where price broke down from the 3.40+ range. Since then, XRP has been struggling to reclaim higher levels, with the red trend indicator line (likely a moving average or trend-follow tool) acting as a persistent dynamic resistance.
After bottoming near the 3.05 zone on July 25th, the price moved into a sideways consolidation, repeatedly testing both the lower range (around 3.08) and upper range (around 3.20). This tight range suggests accumulation or distribution ahead of a bigger move.
Currently, the chart shows a potential long setup triggered around 3.1450, with a stop loss just below 3.0797 and a take profit target at 3.3314. This setup aims to capture a breakout from the consolidation zone toward the previous resistance area just below 3.35. The risk-to-reward ratio is favorable (close to 1:3), making it an attractive trade for short-term swing traders.
The target level aligns with the price area before the breakdown on July 23rd, where sellers previously gained control. Breaking through that level could signal a short-term trend reversal. However, the price still needs to clear the 3.20 resistance with a strong candle close to confirm bullish momentum.
Trade Setup
• Entry: 3.1450 (current level, inside consolidation support)
• Stop Loss: 3.0797 (below recent swing low)
• Take Profit: 3.3314 (prior resistance zone)
• Risk-to-Reward Ratio: ~1:2.94
• Trade Bias: Short-term long aiming for breakout from consolidation