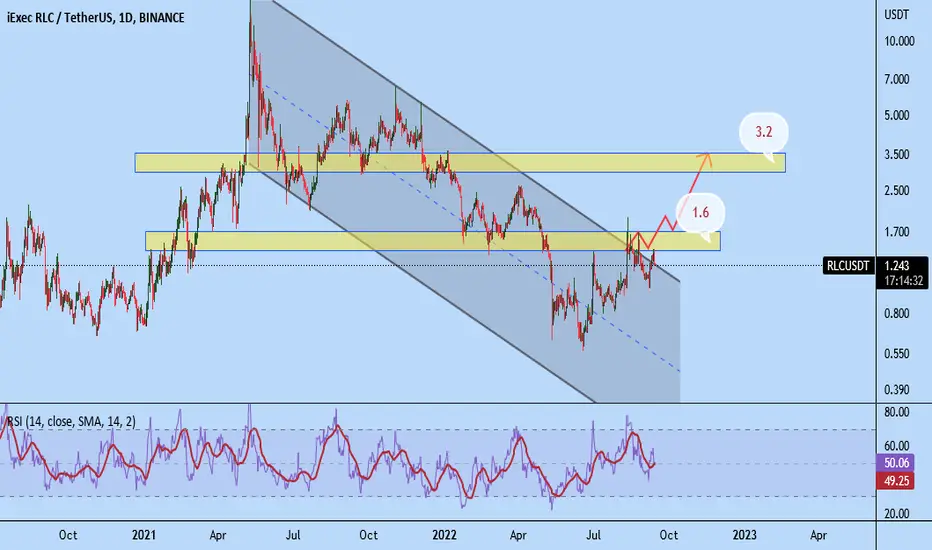
Rlcbreaking descending channel in weekly tf
incase of successful breakout expecting massive bulish keep eyes on that
RLCUSDT.P trade ideas

RLCUSDT is testing the demand zone
The price is testing the demand zone and needs to hold it.
IF the price is going to lose this support we could see a new bearish impulse until
the daily support.
How to approach it?
IF the price is going to lose the support and retest ads new resistance, According to Plancton's strategy , we can set a nice order
–––––
Keep in mind.
🟣 Purple structure -> Monthly structure.
🔴 Red structure -> Weekly structure.
🔵 Blue structure -> Daily structure.
🟡 Yellow structure -> 4h structure.
⚫️ black structure -> <= 1h structure.
–––––
Follow the Shrimp 🦐

RLCUSDTIlliquid coin but you can take advantage of this during crashes if you have buy orders all the way down.
The wicks on this coin are pretty crazy as we saw in the March 2020 crash.
Got up to $14 last bull run. Amazing RR Play here

RLC Long at 1.12$Long at 1.12$ - SL: 0.94
with 5 Tps on chart, secure some profits at Tp1 (1.37$) and set SL above entry

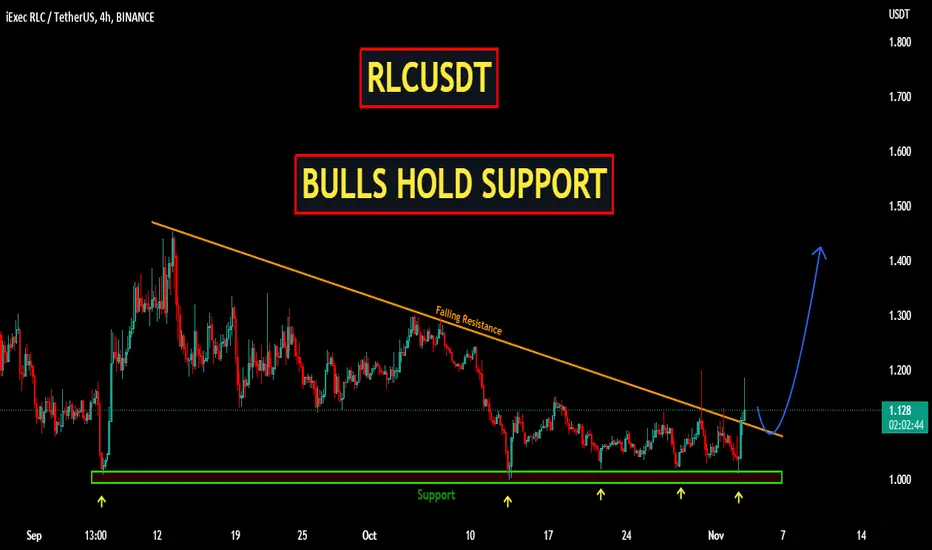
RLCUSDT | BULLS HOLD SUPPORTRLCUSSDT has been trading under the falling resistance on shorter time frame. The price approached to support zone and bulls took control form there.
Previously too bulls hold the support zone.
Now the price has broken above the falling resistance.
We are expecting a price can be pulled back from here.
Manage your trades accordingly.
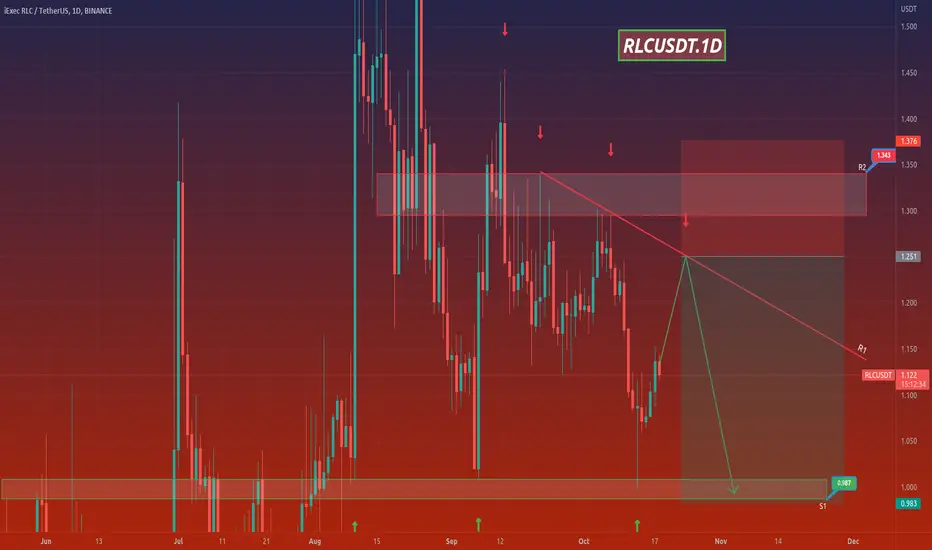
RLCUSDTHello Crypto Lovers,
Mars Signals team wishes you high profits.
This is a one-day-time frame analysis for RLCUSDT
According to our previous analysis on October 12, we predicted a falling trend to happen after and now our prediction came true. There are R2 and R1 as our resistance areas which both include the disability of the price to rise. And S2 used to be another resistance area in our chart. At the present, we have the fluctuation of price above S1 and our expectation will be a rise to reach R1 and there we should receive some confirmation candles in order to have a decline predicted and then our short position is activated. When we have these signs, a fall will be waiting for the price toward S1. In case the price moves above R1, surely it would face more rise.
Warning: This is just a suggestion and we do not guarantee profits. We advise you to analyze the chart before opening any positions.
Wish you luck
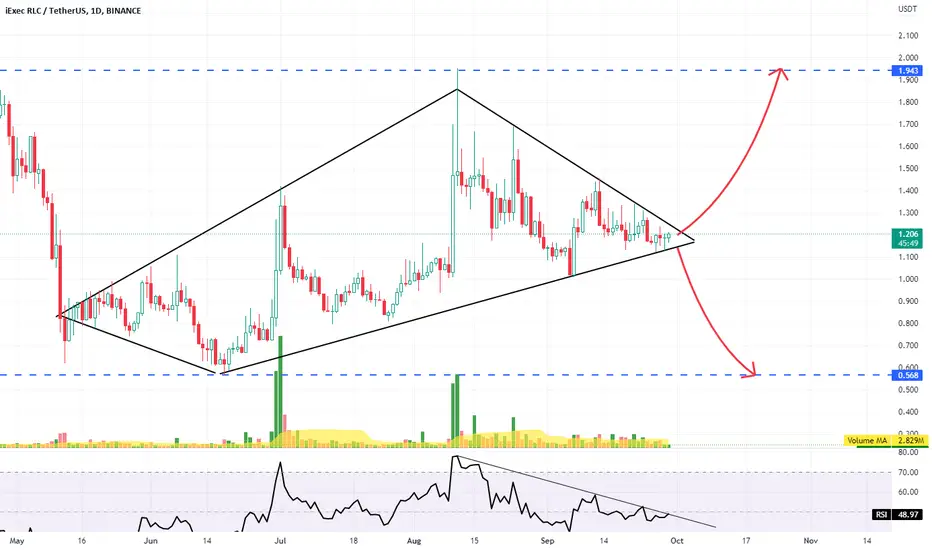
RLC potential big moveRLC is an Ethereum token (web3 crypto) of IExec, specialized in cloud computing. In the roadmap of the company, they intend to announce "RLC Learn & Earn" program in 2023. Will it be a new hype after "Play & Earn" with AXS, "Run & Earn" with (STEPN) GMT? Let wait until then... But at the moment, RLC seems to make a big move the next days.
RLC's prices have been consolidating in a diamond pattern for almost 4 months. A breakout is expected to be very soon. RSI is also at the breaking point. An upside rally would be favored (indeed the pattern looks like a diamond bottom one), but let's play safe and wait until confirmed breakout to enter.
* Tommorow, markets would have high volatility with the PCE report on inflation in the US.
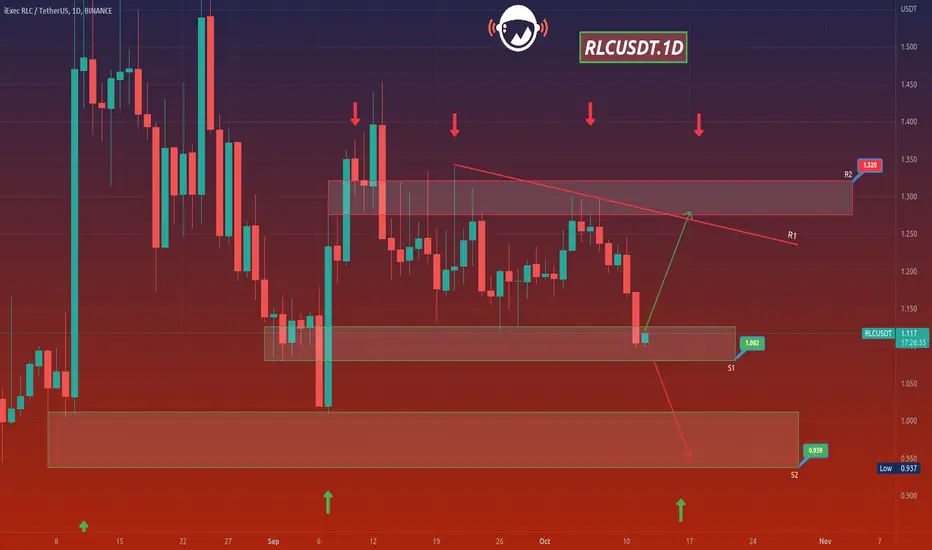
RLCUSDTHello Crypto Lovers,
Mars Signals team wishes you high profits.
This is a one-day-time frame analysis for RLCUSDT
Here we observe R2 and R1 are the resistance areas that contain the disability of the price in order to rise. And S1 and S2 are the support areas which express the support of price at different points. Thus, we have the fluctuation of price in S1 area and we predict two options to happen for it. Either the price will give us some confirmation candles to rise and surely an increase will happen toward R1 or R2. Or the price is not supported in S1 and faces a decline down to S2. Don't forget to activate your stop-loss points due to the unstable situation of market.
Warning: This is just a suggestion and we do not guarantee profits. We advise you to analyze the chart before opening any positions.
Wish you luck
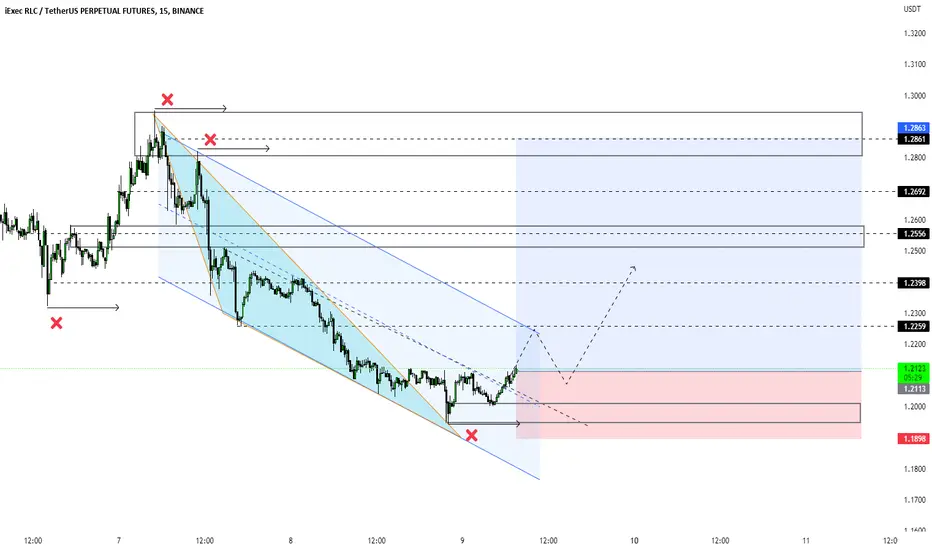
DAY14 #RLCUSDT (#LONG)DAY14 #RLCUSDT (#LONG)
More trading signals and their results, in my channel, link in the description
1% of the deposit
Margin: isolated
⚖️Leverage: x10-20
🗝Entry point: 1.2110-1.2125
🎯target 1 - 1.2259
🎯target 2 - 1.2398
🎯target 3 - 1.2556
🎯target 4 - 1.2692
🎯target 5 - 1.2861
❌stoploss: 1.1898
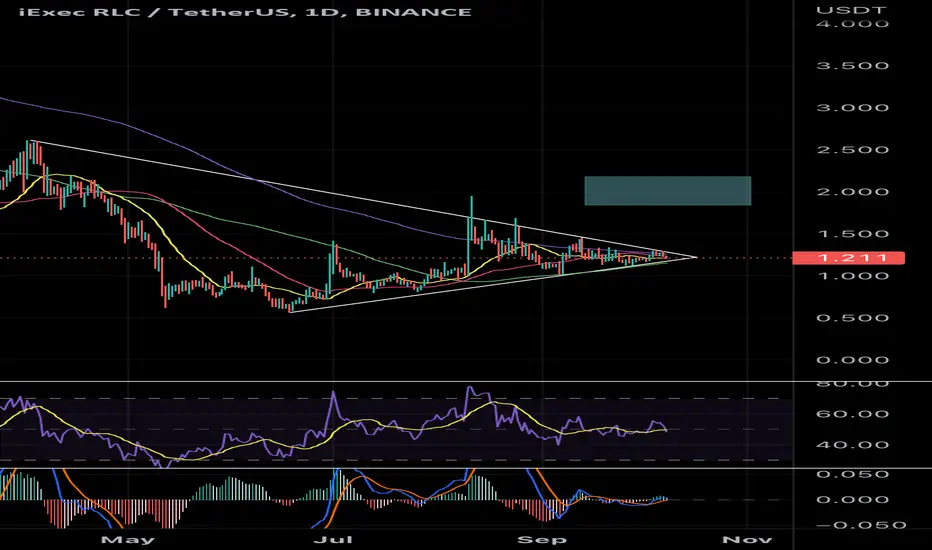
RLC Long Position IdeaRLC’s symmetrical triangle is coming to an end and we might see a $1.8-$2.2RLC within a few days once it breaks out.
The target is from FIB 0.786-0.618 starting from the beginning of the upper trend of the symmetrical triangle to the beginning of the lower trend of the symmetrical triangle.


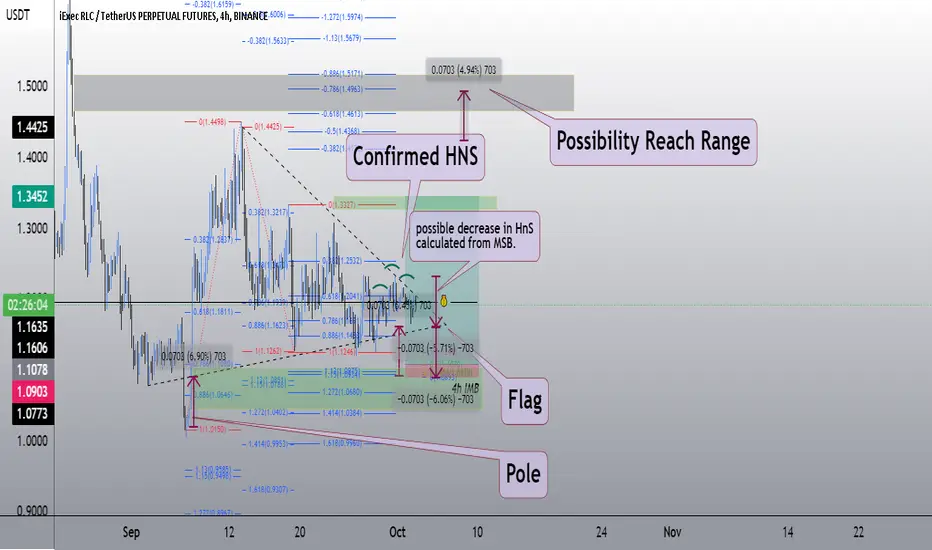
Trade #12 iExec RLC Man im tired to typing lol
All detail available on chart.
Entry 1.1078
SL 1.0903
Take Assets : 1.3452
Possibility reach price 1.46 - 1.51
If there's confusing detail reach me on message
Better Open this link on PC/Website
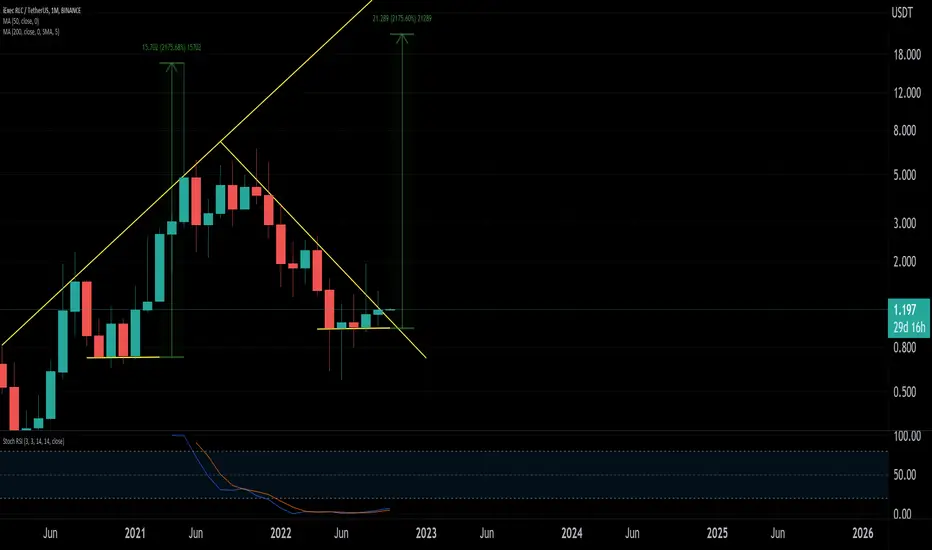
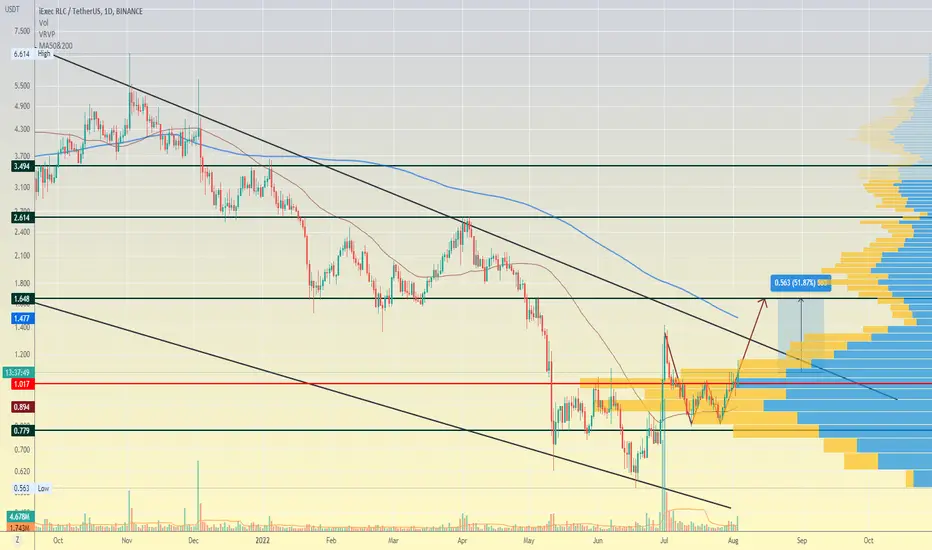
iExec RLC/USDT - 2000%+ Potential growth if history repeatsBetween 2020 - 21 RLCUSDT formed a solid base with 4x monthly candles before seeing growth of 2000% percent. Now in 2022, we have again formed a strong base of support with 4x monthly candles, and have just gone above a long term resistance line. If history repeats, RLC could reach a price of $22 which is 2000%+ increase from the base of the 4 - 5 most recent monthly candles. Stochastic RSI also looking good.
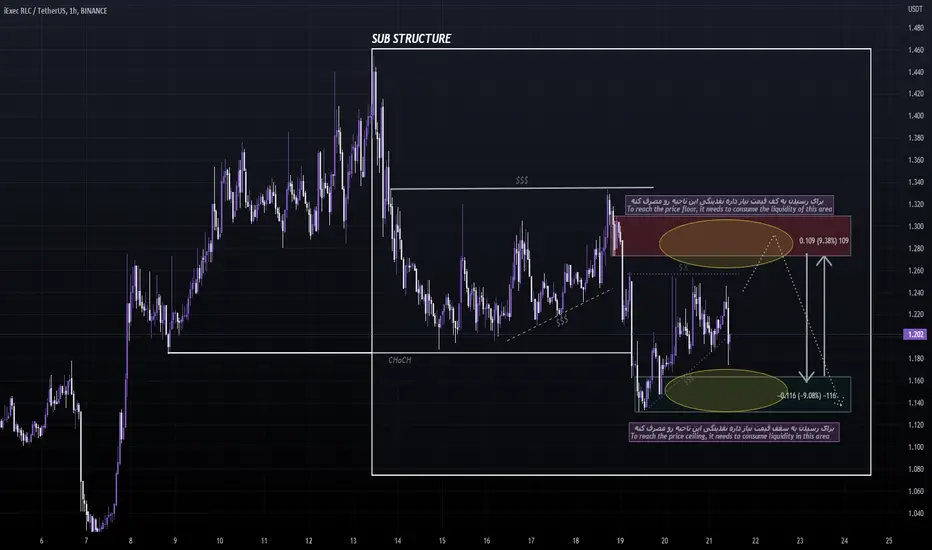
RLC/USDT NEW SETUP 👴Hi 🖐
In the photo, I fully explained that to reach the price of the ceiling and the liquidity floor it should consume which area, but although the liquidity trend is broken, I would probably first get high in liquidity, because at the higher timing the price is downward and the changing nature of the creature is created. .
In general, in each resistive or support area, the lower time gave the lower time to enter the position. I have helped you so far with you.
Goodluck 🌟
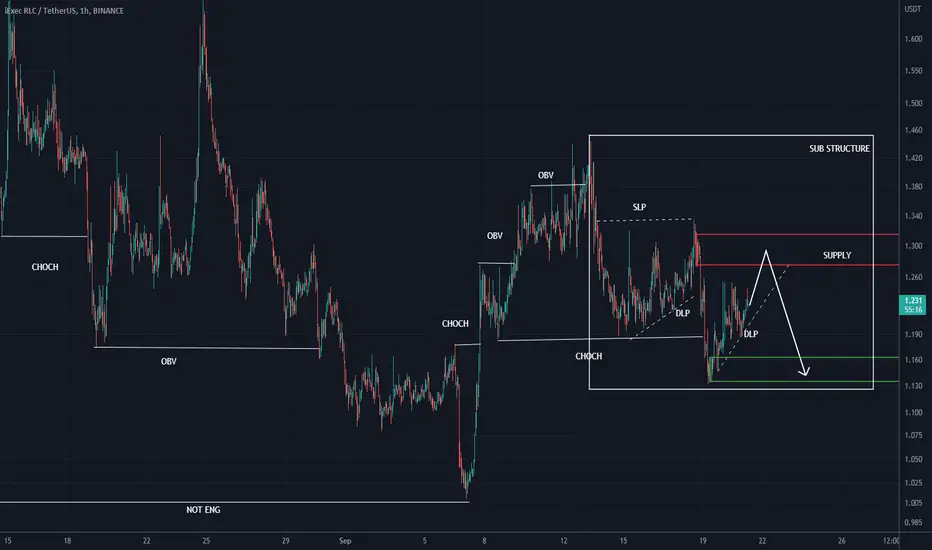
RLC CAN MAKE A CORRECTIONFrom the announcement area it can form a minor correction. You must be careful that the larger structure is not yet bearish
RLC/USDTRLC/USDT
He broke the roof of his channel and fixed it above it.
If it maintains this range, it can grow to the specified targets.
#RLCUSDT #RLC #BTCUSDT #BTC #ETHUSDT #DOGE #DOGEUSDT
RLC broke out falling wedge#RLC/USDT
$RLC broke out from 4h falling wedge pattern.
🐮 possibly price will do a pullback to the broken line that is around support zone, then can continue its upward move to touch resistance zone around $1.6.
🐻 if price break down from support zone it will drop to next support and lower line of wedge.
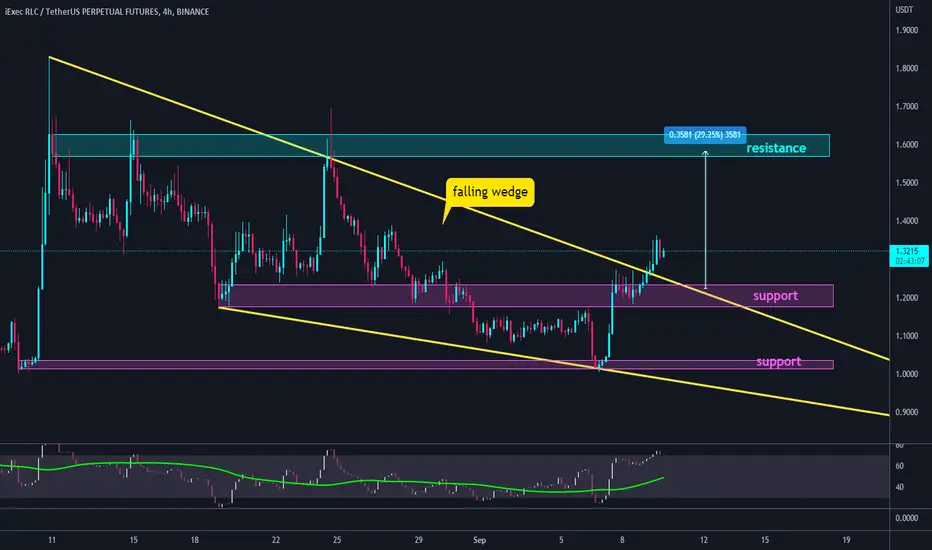
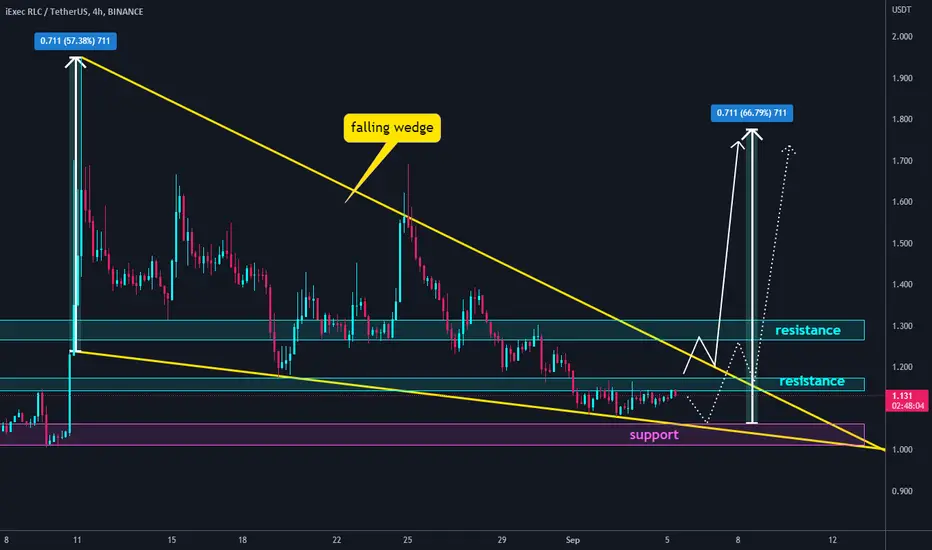
RLC falling wedge#RLC/USDT
$RLC is inside a falling wedge pattern, above the lower line, and below the resistance zone.
🐮 break out from current resistance zone will increase price toward upper line of wedge, and if successful to break it out, it will continue the upward move to prices above $1.7.
🐻🐮 rejection from current resistance can drop price to lower line of wedge which is the same with support zone, and after that maybe attempt to break out this pattern.
🐻 but if price going to break down from lower line of wedge this analysis will be invalid and price can fall to $0.8
Do You Know About RLC USDT ❓🟧 RLCusdt
⏰ Weekly
📅 SEP / 04 / 2022
✴️ It is Down Trend and has Dynamic Resistance.
🔶 We can see more details in the lower time frame.
🔸 I will show details in another chart. please follow my analysis .
📛 Follow the market trend and decide to buy or sell.
⚠️ (This isn't a signal for buy or sell) ⚠️
..........................................
#️⃣ 13 / 06 / 1401
👸 Analyzed by : Parisa_Alipoor
..........................................

RLCUSDTRLCUSDT, is forming a W bottom, eyes on a volume increase on break. we should see 50+%, on break.
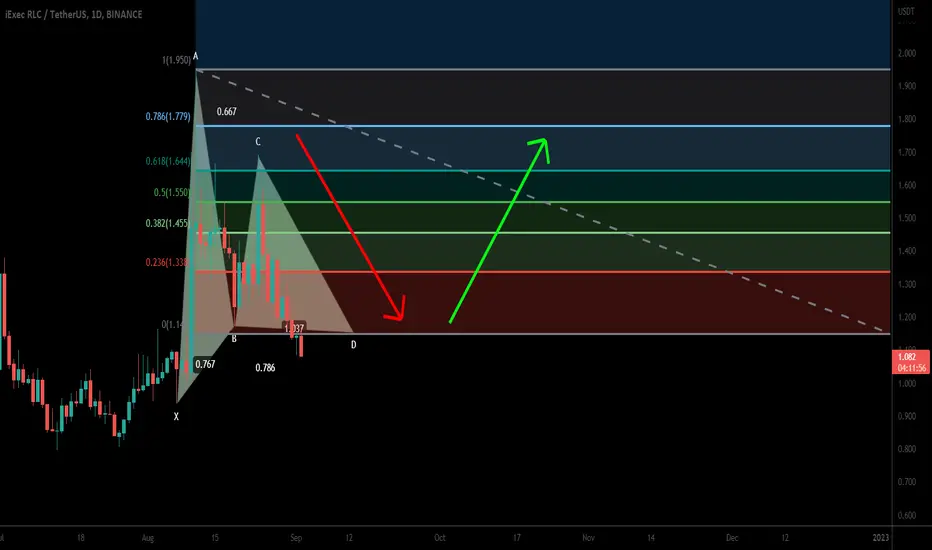
iExec RLC formed bullish Gartley for upto 88.50% moveHi dear friends, hope you are well and welcome to the new trade setup of iExec RLC token with US Dollar pair.
On a daily time frame, RLC has formed a bullish Gartley pattern.
Note: Above idea is for educational purpose only. It is advised to diversify and strictly follow the stop loss, and don't get stuck with trade
RLC i will long at bluei checked Fibo points with many place. And i saw same zone (blue one) to long.
Lets go
