RLC iExec LONG SET-UPs 20220630Signal: Blue -> Green * n
Two set-ups
Risk Reward: 2
RLC , iExec, RLCUSD , RLCUSDT ,RLCUSDTP, BITCOIN ,CRYPTO,CRYPTOCURRENCY
DISCLAIMER
This is only a personal opinion and does NOT serve as investing NOR trading advice.
Please make your own decisions and be responsible for your own investing and trading Activities.
RLCUSDT.P trade ideas

Buying RLC Here Here it is, and the Lower Highs are broken too, since the new High is higher than the previous one.

RLCUSDT🔥Let's analyze the RLCUSDT chart
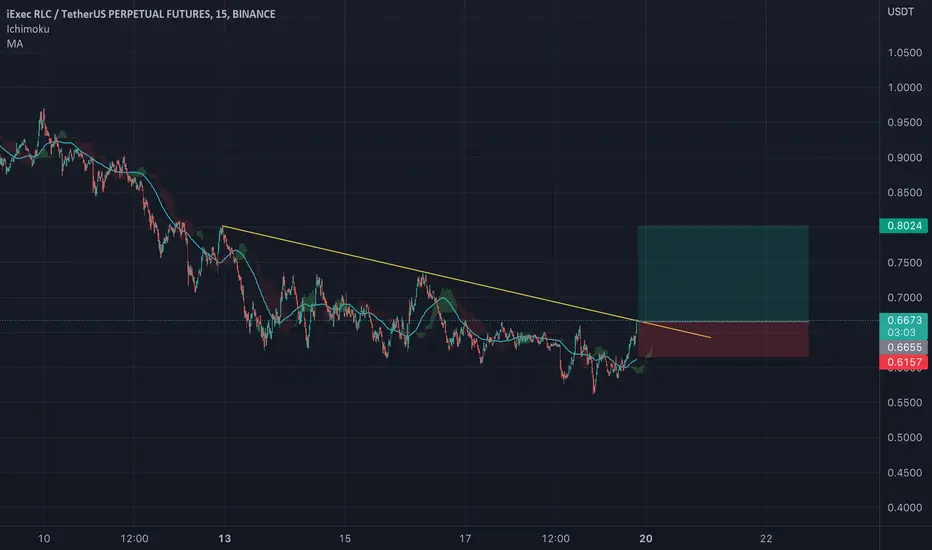
I expect a retest of the countertrend to the 0.670 zone, this will be a potential LONG entry point!
Sample deal plan:
Sample deal plan:
💡Entry $0.670
🔝Take profit 0.720$
✖️Stop-loss $0.640
✅Don't forget to visit the channel there is a lot of useful information about trading.
✅Write your comments what you think about this coin.

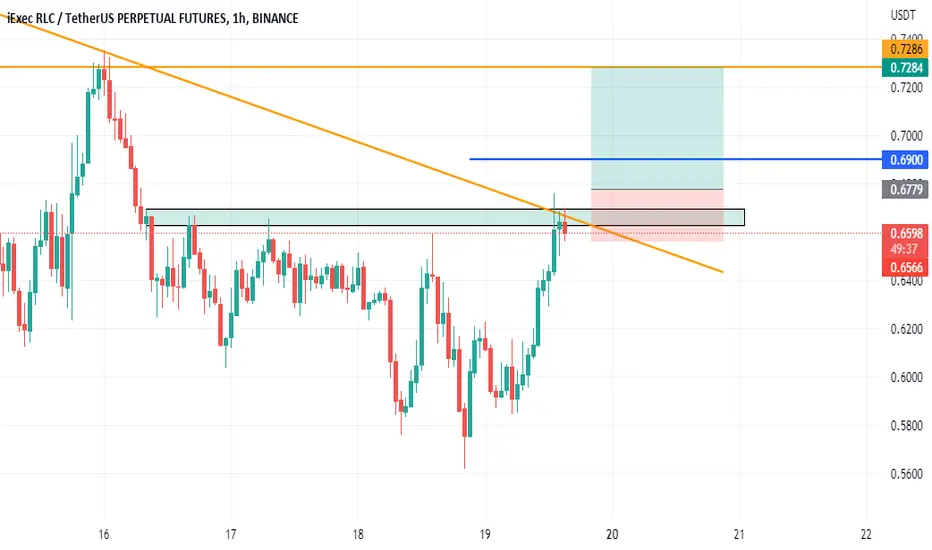
RLC Buy SetupRLC
Entry After 1HGreen Candle Closes Above the Box
Entry: 0.6778
1st TP: 0.69
2nd TP: 0.7282
SL: 0.6547
Use Proper Risk Management Because Market is Volatile
Local LongRLC - Oracle.
Holding above great support level.
RSI - oversold.
Might see MACD candle turn green on higher TF.
Looking good for spot as well.
Do NOT use high leverage.

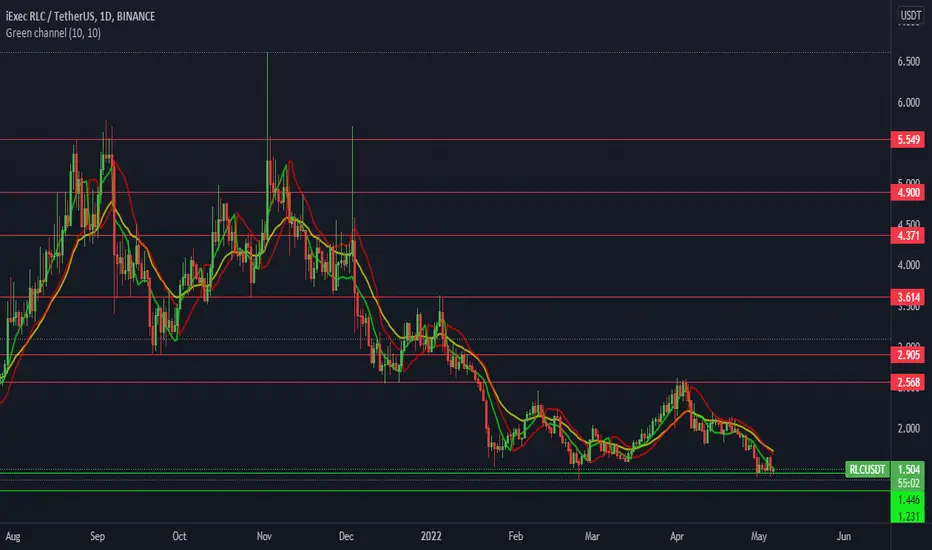
RLC/USDT is at DCA priceAs per my analysis, RLC is at a good price to accumulate.
All the targets are mentioned. #NFA and #DYOR

RLC/USDT is a Buy !💎 RLC/USDT 💎
Long ✅
📊 Entry : 1.9 - 2 $
🎯 Targets : 2.2 - 2.4 - 2.6 - 2.8 - 2.954 $
Enjoy !

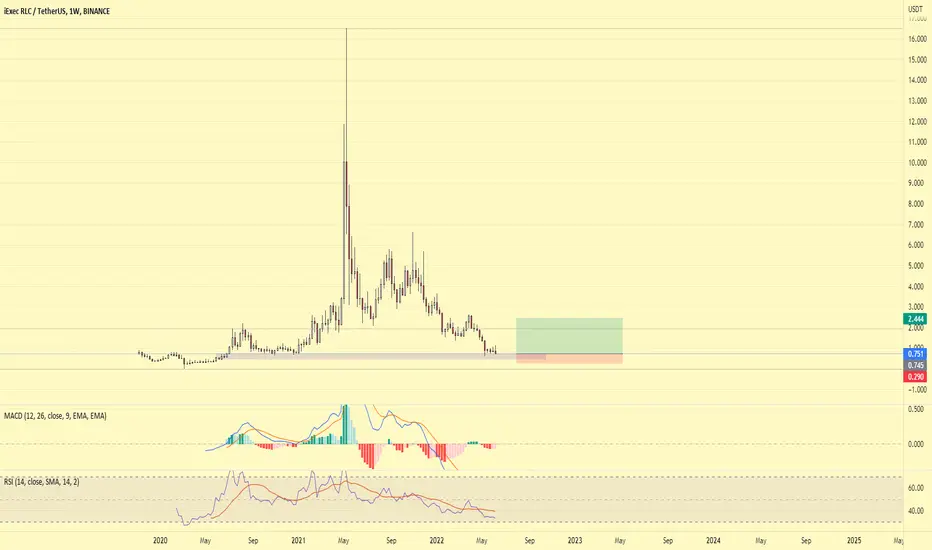
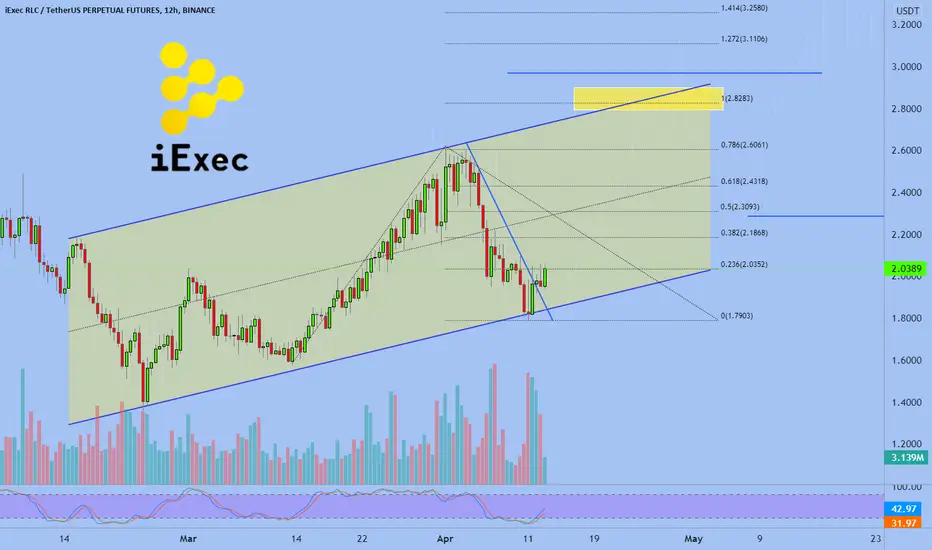
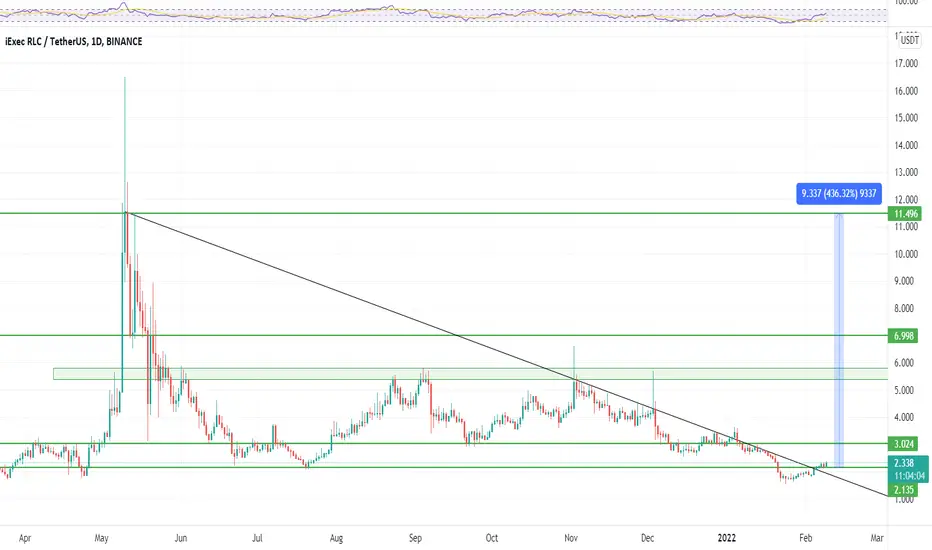
iExec RLCWe see an uptrend for iExec RLC. The price of the token has rebounded from the support line. It may roll back to the previous low, and trade sideways for some time. Further, we will set the targets by the trend-based Fib extension.
Best regards,
EXCAVO
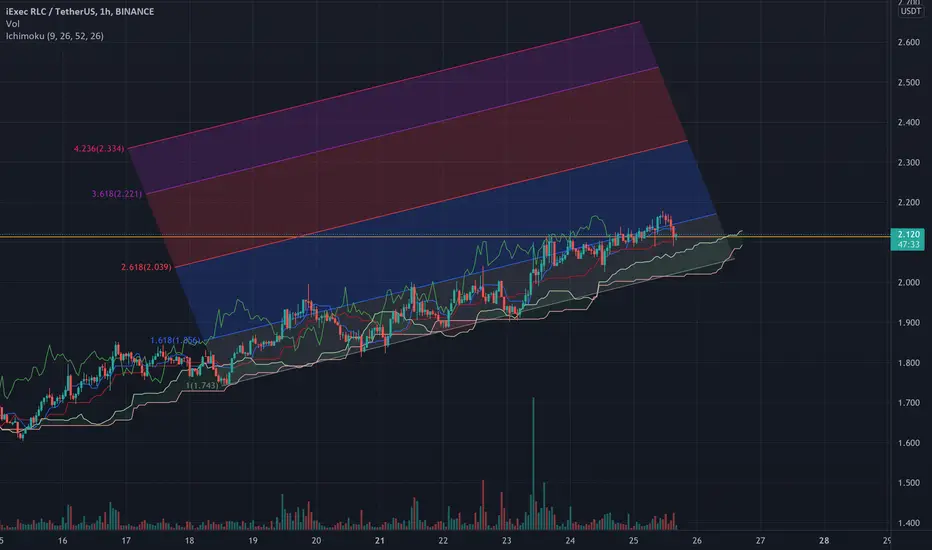
No time to buy LRCAs it is clear from the Fib area LRC couldn’t pass the 1.61 line so it will continue down to a resistance level. The volume is not increasing so the chance to go above 1.61 line is not so much

RLC/USDT BUYING SET-UP RLC Back to retest on support after can't break psychology resistance at $2
Potential back to try resistance to breakout🚀
Target mentioned in the chart
Stoploss : $1.75
Risk : 5%
long positionundervalue and double bottom showing all komo touched in all time fram and we can expecting a bulish momentom after btc show a green light to market .then rlcusdt could pump hardly.

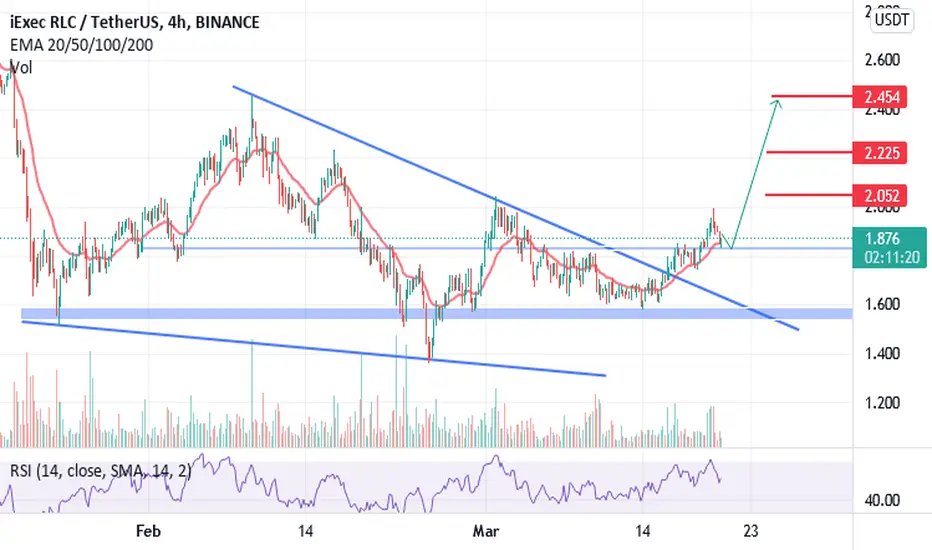
RLC UndervaluedRLC is severely undervalued and the TA suggests a mini break out here, as it cracks resistance from the wedge formation, lets see if we can get a decent swing here.
🆓iExec RLC (RLC) Mar-07 #RLC $RLC
After RLC broke out of the $1.6 zone, buying pressure came back strongly and RLC rallied to the $2 zone shortly after. This is a sign that the $1.6 zone is still a good support for RLC. If we don't lose this zone, in the near future RLC can rise back to the 2.5$ zone
📈RED PLAN
♻️Condition : If 1-Day closes ABOVE 1.6$ zone
🔴Buy : 1.6
🔴Sell : 1.9 - 2.2 - 2.5
📉BLUE PLAN
♻️Condition : If 1-Day closes BELOW 1.6$ zone
🔵Sell : 1.6
🔵Buy : 1.3
❓Details
🚫Stoploss for Long : 10%
🚫Stoploss for Short : 5%
📈Red Arrow : Main Direction as RED PLAN
📉Blue Arrow : Back-Up Direction as BLUE PLAN
🟩Green zone : Support zone as BUY section
🟥Red zone : Resistance zone as SELL section

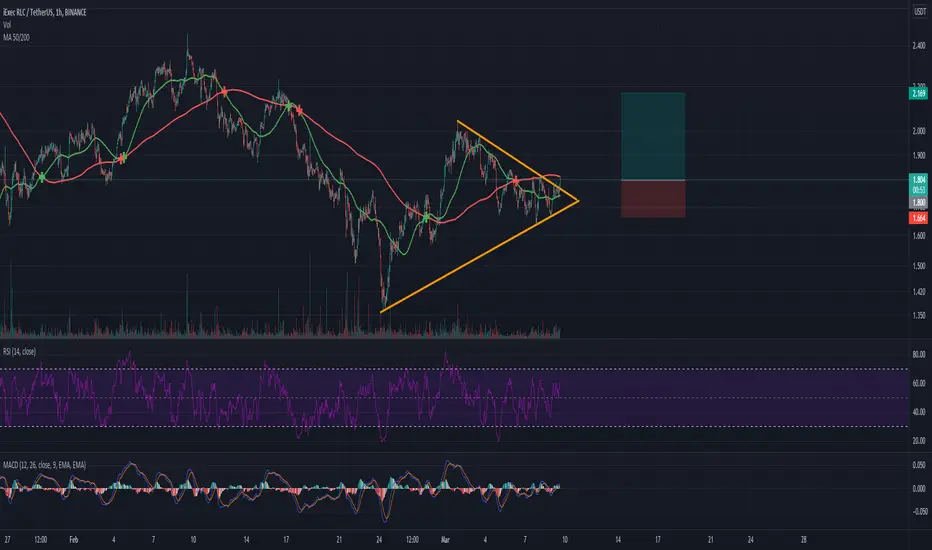
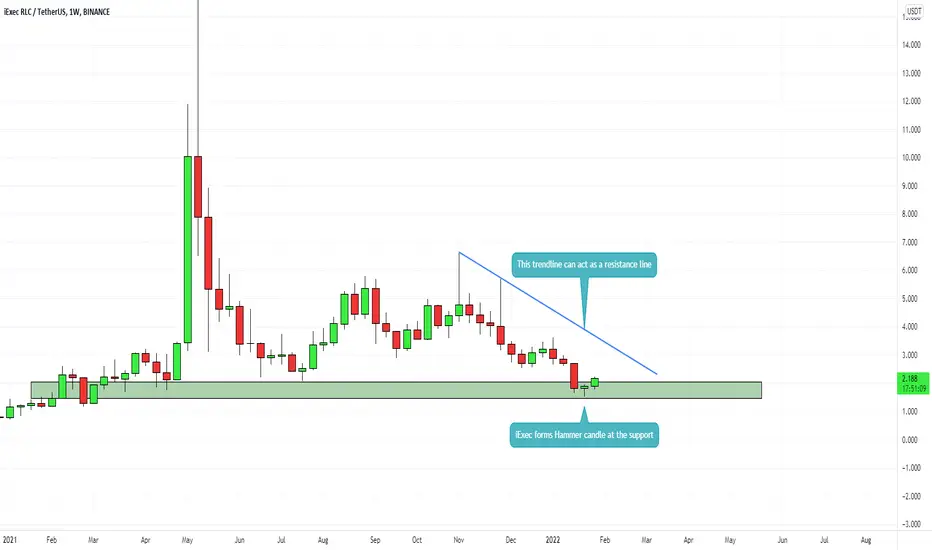
iExec forming long opportunityiExec looks good for taking a long trade as you can see in the chart it has formed a hammer candle at the support level. One can go long and can keep the Sl below the hammer candle low and can expect a target upto the trendline marked in blue.
#RLC short X3 The Rising Wedge BreakdownThis pattern has a familiar look to a bear flag ( shows a rising wedge 19h chart, while a bear chart pattern is evident in the daily chart.
During the formation, there are a few indicators that can be used to determine whether the pattern is a real pattern or a disguise.
As this formation progresses, it is a favorable signal if the volume is decreasing. That’s because it would show a divergence between price and volume, adding evidence that a reversal may be imminent.

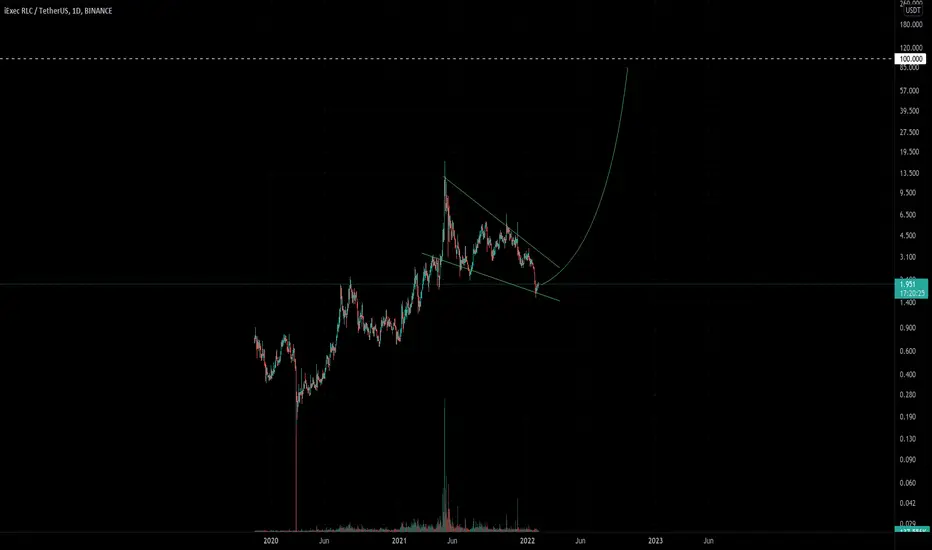
$RLC 50x opportunityGem. Long term (6+ month).
Strong fundamentals.
Take profit: 100$
No stop loss.
Do your own research.
RLCRLC currency has good conditions for entering a step. The entry point and targets are specified in the chart.
This analysis is not a trading signal and is just a personal analysis, so be sure to check your chart before taking any position.
RLC bull push Rlc strong support @ 1.77 area.. now we look up.. we might never get to see this price again.. we will keep pushing up still price takes out the price high..
