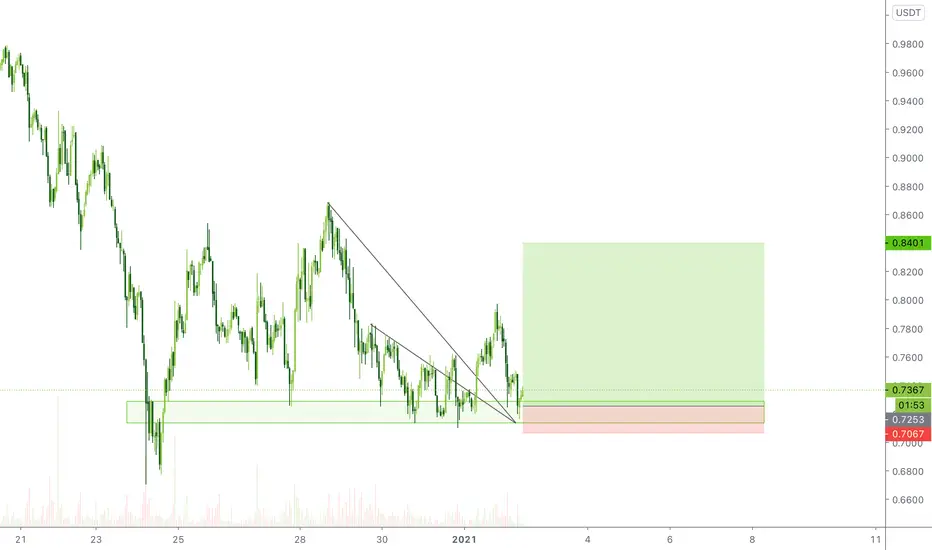
RLCUSDT (RLC) - UPTREND CONTINUATION ANALYSIS 🔎
- RLCUSDT pumped and hit a swing high.
- Price then retraced for a retest of the flip horizontal support and 0.618 fibonacci retracement level.
- Price action printed the double bottom trend reversal pattern at the retest area.
- Price brokeout above the double bottom neckline resistance.
- Price action is printing an ascending triangle pattern.
- There's a breakout potential.
BUY ENTRY ⬆️
- Breakout above the ascending triangle's horizontal resistance.
TARGETS 🎯
- Horizontal resistance level R1
- Horizontal resistance level R2 (swing high).
- Fibonacci extension levels.
SETUP INVALIDATION ❌
- Breakdown below the ascending triangle's inclined support.
RLCUSDT.P trade ideas


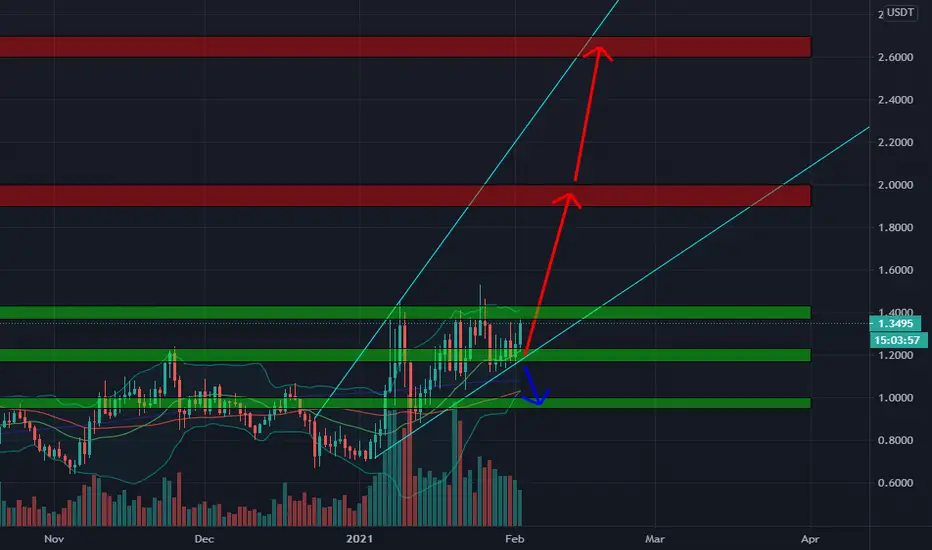
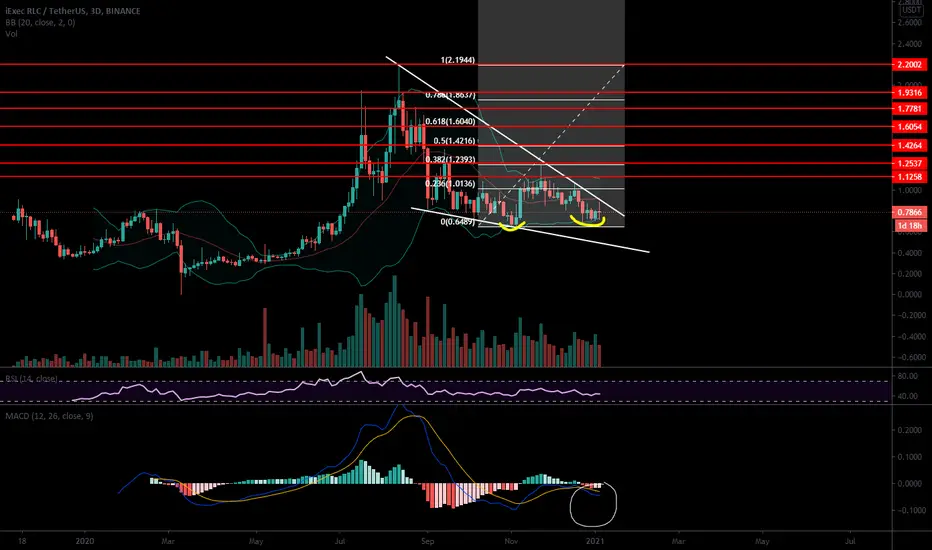
🆓iExec RLC/USDT Analysis (2/2) #RLC $RLCRLC has conquered 1.2$ zone and this will be a step to help RLC increase strongly this February to $2 and $2.6 zones.
📈BUY
-Buy: 1.17-1.23$. SL if B
-Buy: 1.37-1.43$ if A. SL if B
📉SELL
-Sell: 1.9-2.0$. SL if A
-Sell: 2.6-2.7$. SL if A
♻️BACK-UP
-Sell: 1.17-1.23$ if B, SL if A
-Buy: 0.95-1.0$, SL if B
❓Details
Condition A : "If 1D candle closes ABOVE this zone"
Condition B : "If 1D candle closes BELOW this zone"
RLCUSDTRLC is going to be super profitable in mid-term and for now in this time frame shows the bias which is bullish
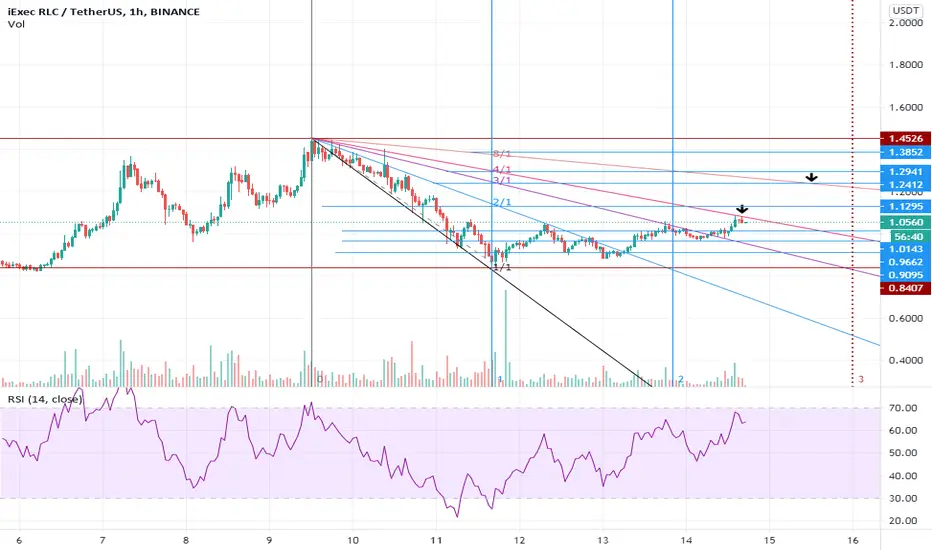
RLCUSDT 1H SHORTAfter breaking the bullish channel and also crossing the 0.786 Fibonacci support line, we have to wait for the reaction of 0.88 Fibonacci. If it crosses this line to 1 Fibonacci, then it will move to 1.27.
0 1.1230
SL 1.1625
TP1 1.1187

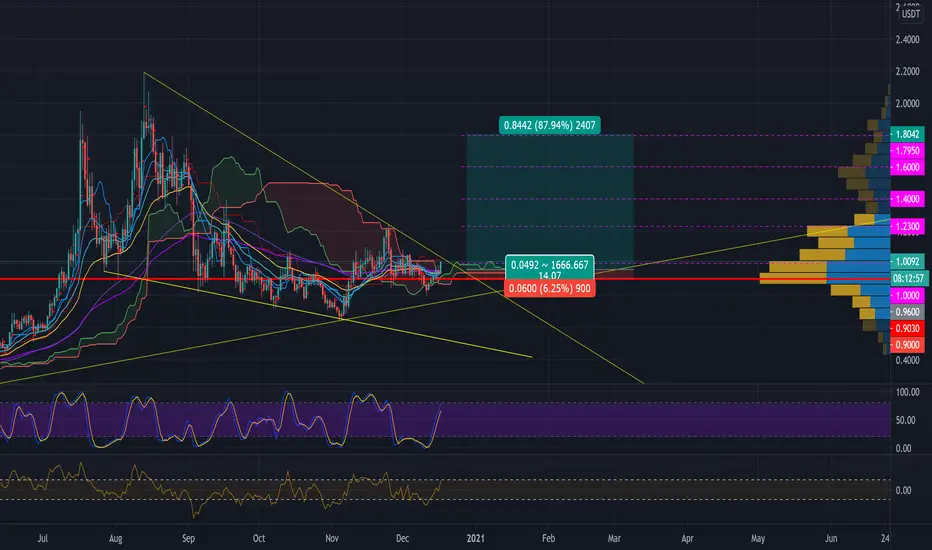
RLC USDTBuy area 0.8 - 0.9
SL : under 0.70
TP : 1.0 - 1.2 - 1.4 - 1.6 - 1.8 --- 2 +++
DWYOR and Good Luck

RLCUSDT 1H Ready to break the floorAfter crossing the 0/88 Fibo Nachi line, be prepared for a powerful floor break
0 1.2895
SL 1.3350
TP1 1.2790


RLC Price At daily resistanceRLC cryptocurrency coin price at daily resistance.
breakout above the red zone will send price higher
Wait for price to breakout above 1.5$
Buy above 1.5$


BUY small bag of #RLCI noticed an interesting buying pattern + volume growth on the pullback.
Be aware of the risks that BTC may pull many altcoins down. The only way to hedge against this is with stops and diversification, do not trade too many assets at the same time.
RLCUSDT IDEAHi guys,
RLC can also have big potancial. You can follow this setup. Yellow lines Take profit. Enter from green line.
1.12 entry
1.04 stop
1.30-1.45 and +++ can come.
Good luck.
If you like tap.

RLCUSDTA volume diversion bar has formed on the daily chart. Fractal is above the 13ema and price has pushed into the high/low 5ema channel without crossing the high. Price is above the 200ema and RSI above 50, which tells us this is an up-trending market. The first target is the last fractal high or a volume diversion bar to the downside. A stop will be placed below the prior daily candle 13-01-2021. Enter on today's candle 14-01-2021. Good luck!

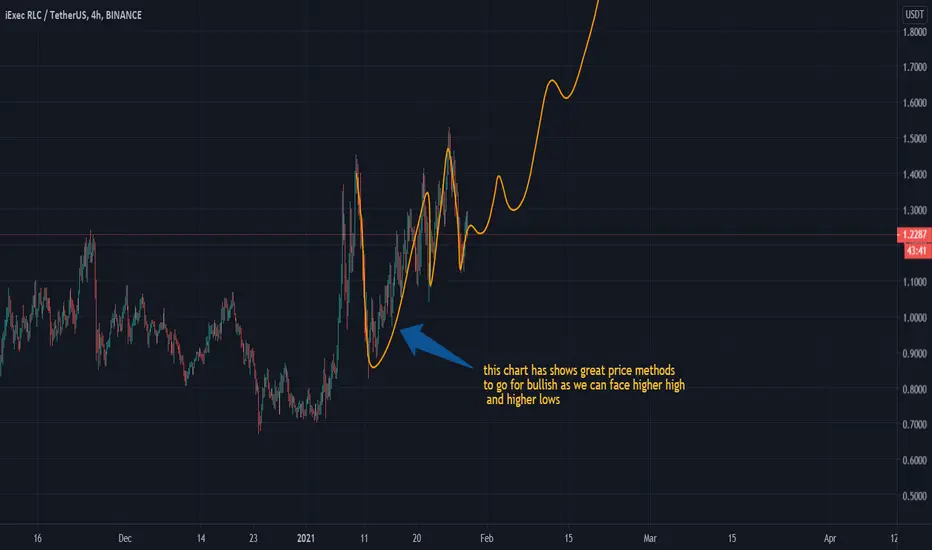
RLC Breaking out, TODAY!RLC will go after soo much weeks pushing in the end more up. I see it will reach around first 1,45 and after that higher.
This is the best moment what i think to buy, i buy more and what you do?

RLCUDTIf you cross the specified range, the buy signal will be activated at target 1.25, otherwise, it will return to the support level of 0.90.
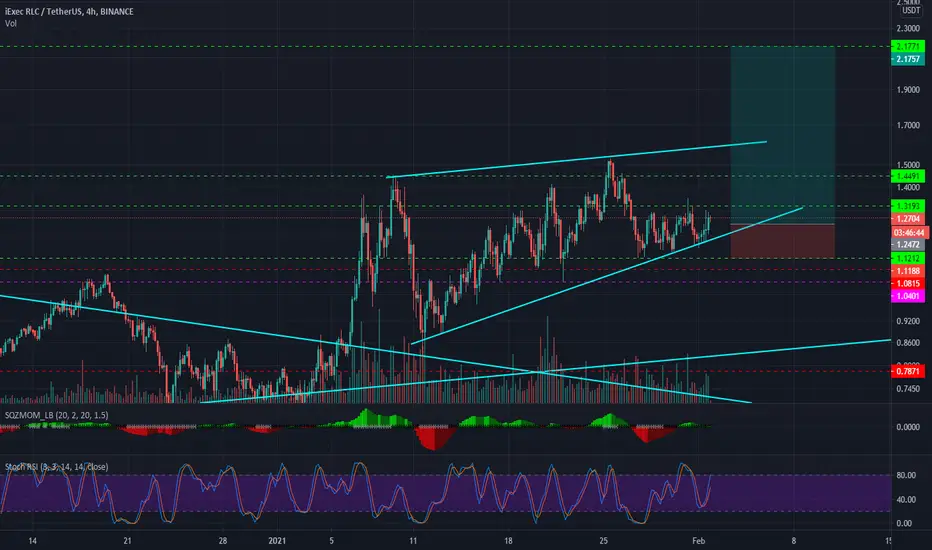
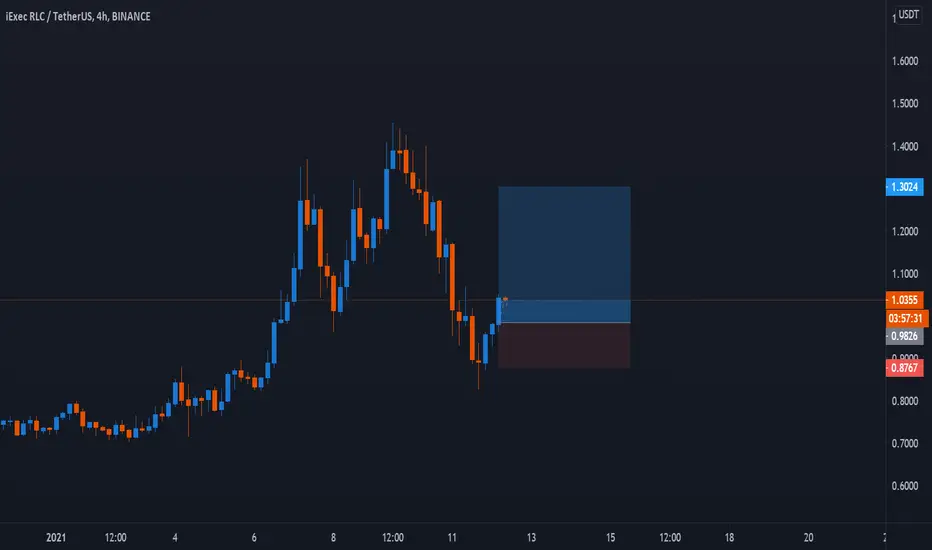
RLCUSDT is testing 4h resistance 🦐$RLC.X IF the price will have a breakout from bull flag, According to Plancton's strategy (check our Academy), we can set a nice order
–––––
Follow the Shrimp 🦐
Keep in mind.
🟣 Purple structure -> Monthly structure.
🔴 Red structure -> Weekly structure.
🔵 Blue structure -> Daily structure.
🟡 Yellow structure -> 4h structure.
⚫️ Black structure -> <4h structure.
Here is the Plancton0618 technical analysis, please comment below if you have any question.
The ENTRY in the market will be taken only if the condition of the Plancton0618 strategy will trigger.

RLC READY FOR A RUNCurrently its facing some resistance , As Soon As Volumes Come in it Will Run Hard.
Targets On Chart :)

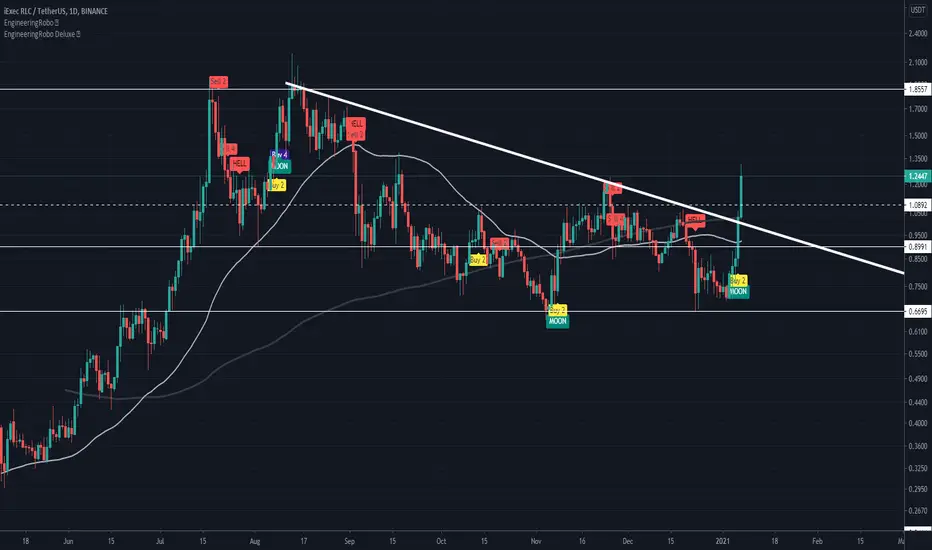
RLCUSDT What we see now :
1- the price at 1.24$
2- the support level at 0.89$
3- the resistance level at 1.80 $
4- the price cross MA 50 and MA200 " wait for daily close confirmation "
5- three positive buy signals are active now
what we should do :
- according to TA and robo signals it is a good opportunity to take a position in this trade
- follow the robo sell signals
trade with your own responsibility
RLCUSDT ready to surprise us?Meme coin likes to go crazy every 6 months. Coming up on the end of a falling wedge here. Double bottom, higher lows. Going to start a position here. could see a 3 bagger.
BINANCE: RLC/USDT🛒 Pair: RLC/USDT 🛒
== SPOT==
⏰ 1399/09/27 ⏰
🕰 17/12/2020 🕰
Duration:
📈 SHORT - MID 📈
Ex: Binance
🛒 Buy1 : 0.990 - 1.00 🛒 1/6
🛒 Buy2 : hidden 🛒 2/6
🛒 Buy3 : hidden 🛒 3/6
👉Sell Targets👈
🎯TP1: 1.020 🥉
🎯TP2: hidden 🥈
🎯TP3: hidden 🥇
🎯TP4: hidden 🏆
🎯TP5: hidden 🚁
🎯TP6: hidden ✈️
🎯TP7: hidden 🚀
🎯TP8: hidden 🛰
⛔️ SL: 0.899 ⛔️ with 4Hrs. candle closing below