iEXEC RLC ✅ Massive Uptrend! Horizontal Levels To Keep an Eye on💬 iExec's RLC token "runs on lots of computers" and RLCs price action just keeps running.
We are coming up to the last point of resistance for RLC's USDT chart, and logically it may be time for another pullback.
If and when we get that pullback there are some juicy support levels to look for if RLC is to make new highs (new highs could be in the cards given RLC's correlation with other alts making waves recently; see the related ideas).
Hit that 👍 button to show support for the content!
Help the community grow by giving us a follow 🐣
-----
Higher Timeframe overview:
Support:
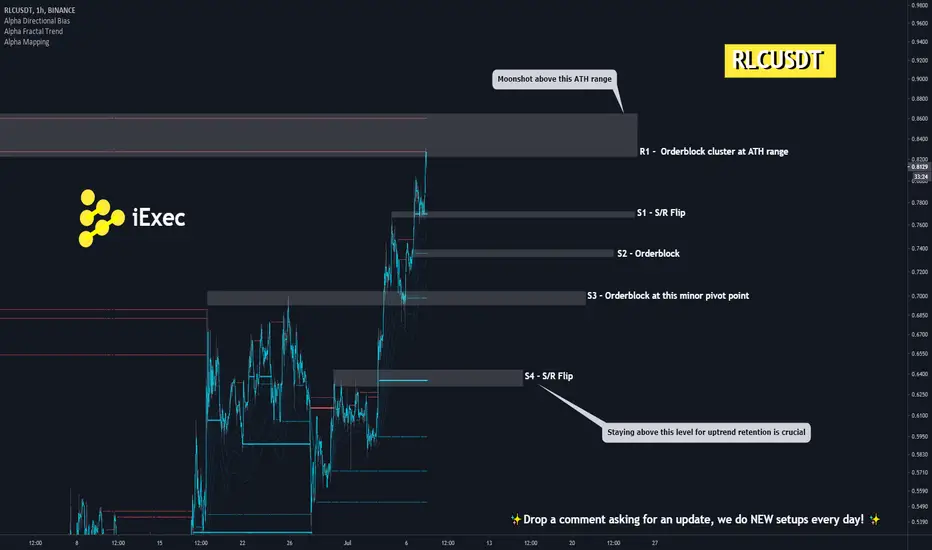
S1: The S1 S/R flip is the first level of support for RLC. This one could see a reaction on the way down or perhaps hold in a quick corrective move if the bulls are adamant about not correcting until resistance is fully breached.
S2: The S2 orderblock is the next best bet for the bulls if S1 can't hold. If S2 doesn't work as support, it should at least see a reaction as price moves past it.
S3: The S3 orderblock at the minor price pivot point could be the perfect entry for bulls looking to enter during a period of consolidation. If one is trying to enter with resting orders, it makes sense to put at least some portion of your orders here.
S4: If S4 can't hold, then our last level of interest is the S4 S/R flip. A quick retest of the prior range before moving up makes sense, so getting a fill here is optimal if RLC is to keep running.
Resistance:
R1: The R1 orderblock cluster at the All-Time High (ATH) range is the only resistance on our chart, but it is a big point of resistance. This is not only the lone resistance on our chart, but it is the last resistance on the RLC chart in general. It is very likely price struggles here.
-----
Summary:
If bulls can break resistance either now or after consolidation, the sky is the limit. Entering while price is going up into support doesn't make sense. Entering on a pullback to one of these levels could pay off if proper risk management is used. Otherwise playing a breakout of resistance has some logic in it as well. That said, any long-term RLC holder has to be thinking about taking profits here... there isn't another target left on the chart.
Resources:
www.newsbtc.com
✨ Drop a comment asking for an update, we do NEW setups every day! ✨
RLCUSDT.P trade ideas
RLC/USDT - LONG - POTENTIAL 24% - ALL TIME HIGH???PAIR: RLC / USDT
T/F: 1HR
LENGTH: MEDIUM/LONG
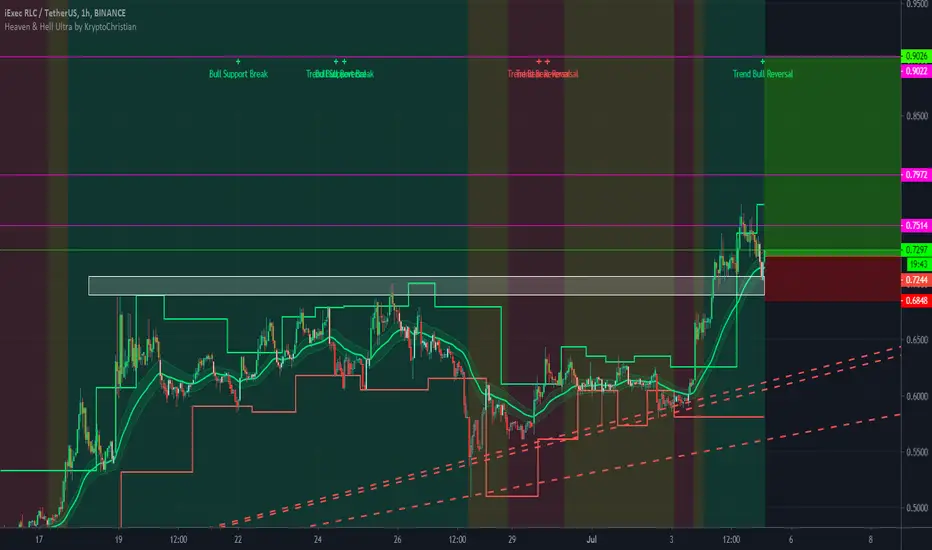
ENTRY: 7295
TP1: 7514
TP2: 7972
TP3: 9022
S/L: 6848
NOTES:
- Sitting on support
- Oversold on RSI Deviation
- Warning could breakdown hard based on historical movement
- Breakout to pullback
- Strong Uptrend
- Minimal resistance above, could see a new all time high
Look after your portfolio and it will look after you & If you liked this idea, please like and subscribe to my profile.
Please always trade with caution, manage your trades and stop-losses This is not professional financial advice, just my thoughts and trades I am taking please trade safely and responsibly.
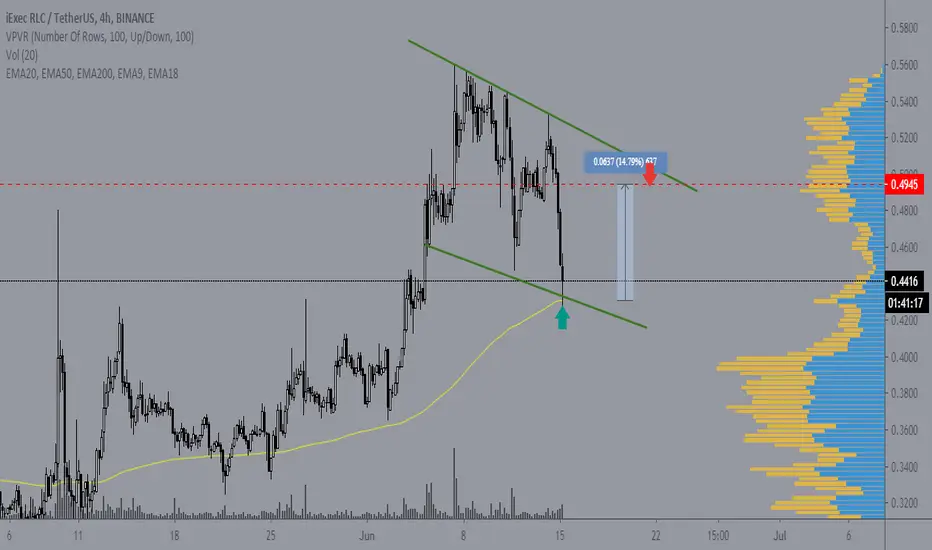
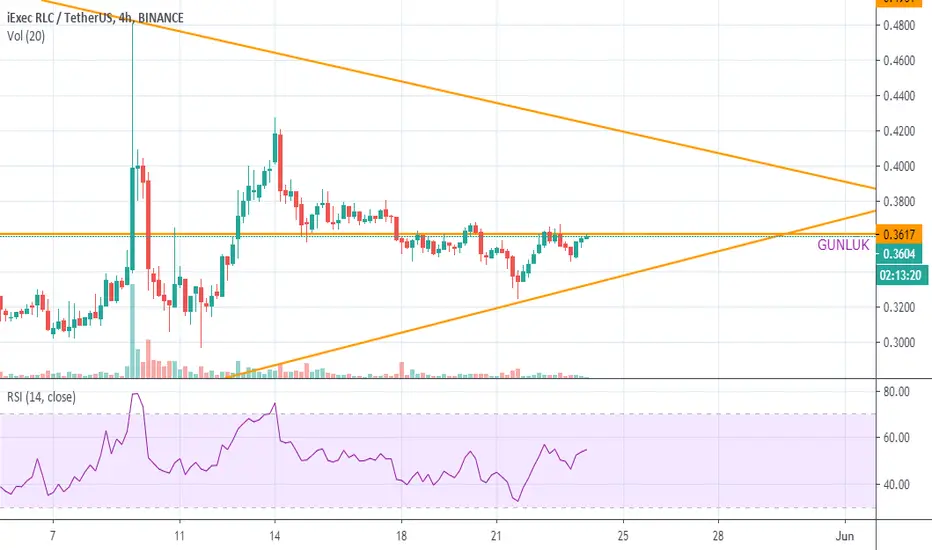
RLC/USDT LONG Swing Trade RLC/USDT movin bullissh flag , now comin lower border and MA200 , buy 43xx , near target 49xx . SL 41
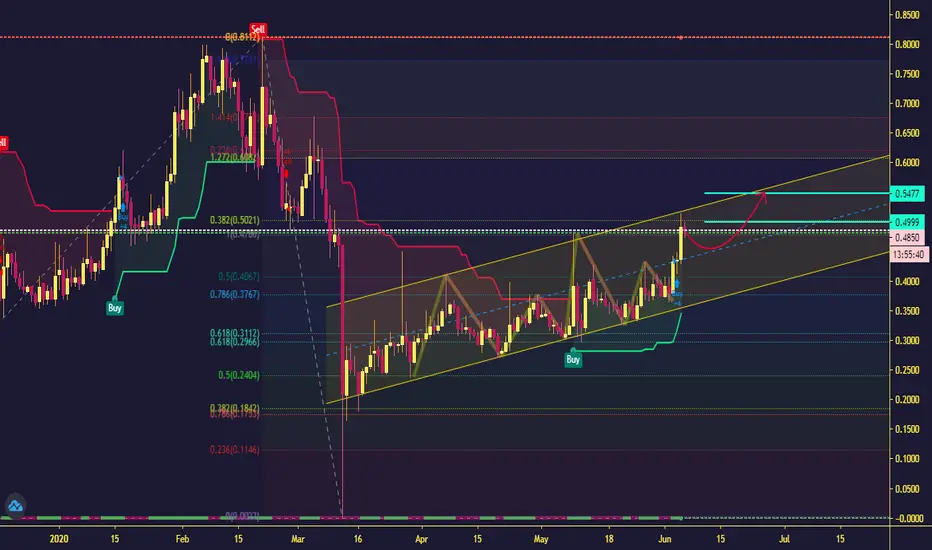
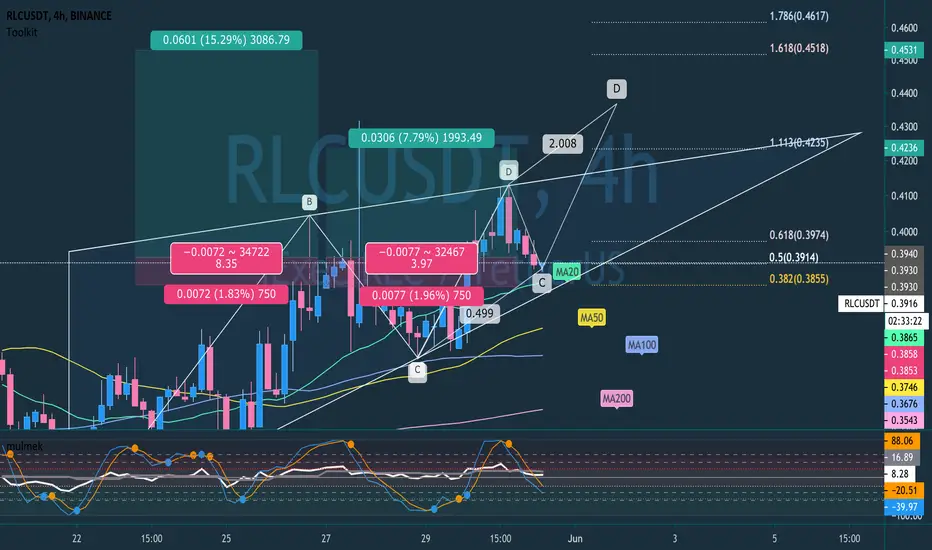
Possible RLC PathRLc is between the paralel trend lines and it bounced from the point EMA50, 2 Trend Lines and strong S/R zone intersected.
Daily RSI and MACD have high values. Firstly, price decreasing expected but then it can rise

RLC/USDTHello friends
Based on my analysis of the daily time form, this currency is in an upward channel and I expect it to reach the targets I have set for it.
be successful and victorious
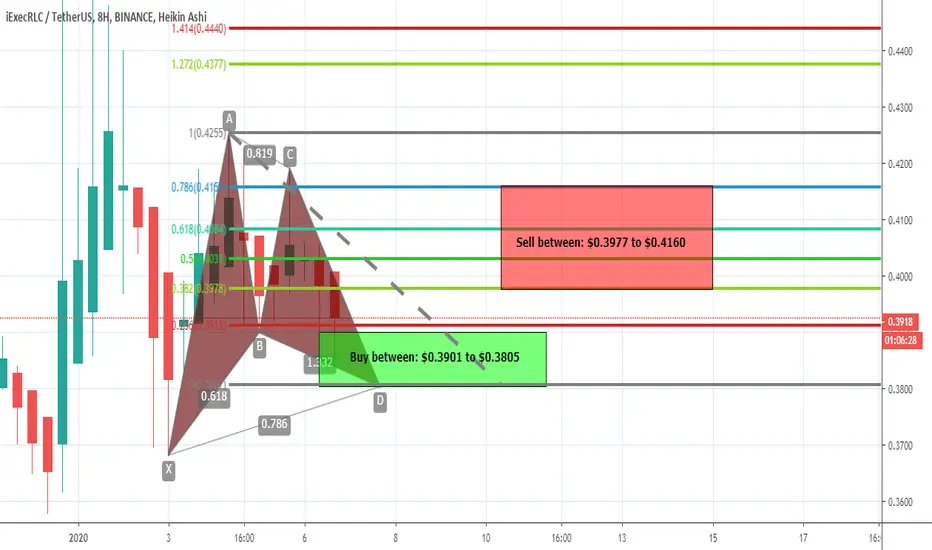
RLCUSDT formed Gartley | A good long opportunityWorld's 100th ranked crypto out of more than 2300 cryptocurrencies iExec RLC (RLC) has formed bullish Gartley pattern and entered in potential reversal zone and ready for bullish reversal soon.
This potential reversal zone should be used as stop loss in case of complete candle stick closes below this zone.
Lets have a look at the dimensions of iExec RLC price action's move:
After initial leg (X to A) the A to B leg is retraced between 0.618 to 0.786 Fibonacci (here I have ignored very minor difference) and then B to C leg is projected between 0.382 to 0.886 of A to B leg's Fibonacci projection and final (C to D) leg is retraced between 0.618 to 0.786 Fibonacci as perfectly required for Gartley pattern and now the price action is moving in potential reversal zone of this Gartley pattern, now we can expect bullish divergence at any time which will lead the priceline between 0.382 to 0.786 Fibonacci projection of A to D leg, but after this bullish divergence if the candles sticks will be closed above the 0.786 Fibonacci levels then it can also lead to the long term bullish move.
As per Fibonacci sequence method we can set our targets as below for mid term trade:
Buy between: $0.3901 to $0.3805
Sell between: $0.3977 to $0.4160
So this very short term 8hr time period chart is giving very good long opportunity
Regards,
Atif Akbar (moon333)
The harmonic moves analysis involves hours of hard work and determination however the success of harmonic trading in fiat and cryptocurrencies is around 80% therefore it is always important that you follow any stop loss strategy while trading harmonic patterns I have also shared a stop loss idea in this article, the information in this article is for educational purpose only this is not an investment advice, I have tried my best to catch the harmonic moves as per predefined classical harmonic Gartley pattern if you find any flaw or you have any suggestion feel free to share with me in comments section.
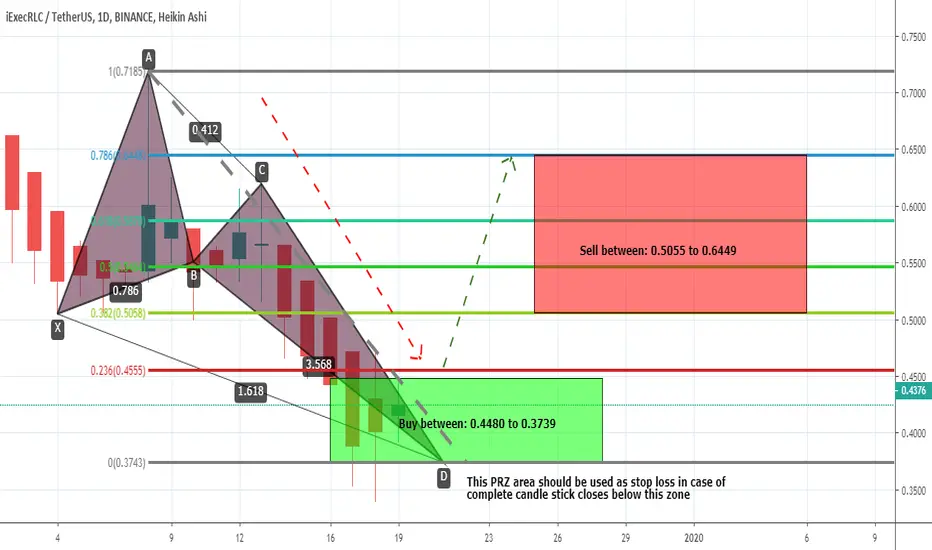
RLCUSDT formed bullish Butterfly | Upto 72% bullish movePriceline of iExecRLC / US Dollar cryptocurrency has formed a bullish Butterfly pattern and entered in potential reversal zone.
This PRZ area should be used as stop loss in case of complete candle stick closes below this zone.
I have used Fibonacci sequence to set the targets:
Buy between: 0.4480 to 0.3739
Sell between: 0.5055 to 0.6449
Regards,
Atif Akbar (moon333)
RLCUSDT formed bullish Shark | Upto 20% bullish movePrice action of iExec RLC / US Dollar has formed a bullish Shark and entered in potential reversal zone.
This PRZ area should be used as stop loss in case of complete candle stick closed below this area.
I have used Fibonacci sequence to set the targets:
Buy between:0.6143 to 0.5860
Sell between: 0.6429 to 0.7036
Regards,
Atif Akbar (moon333)
