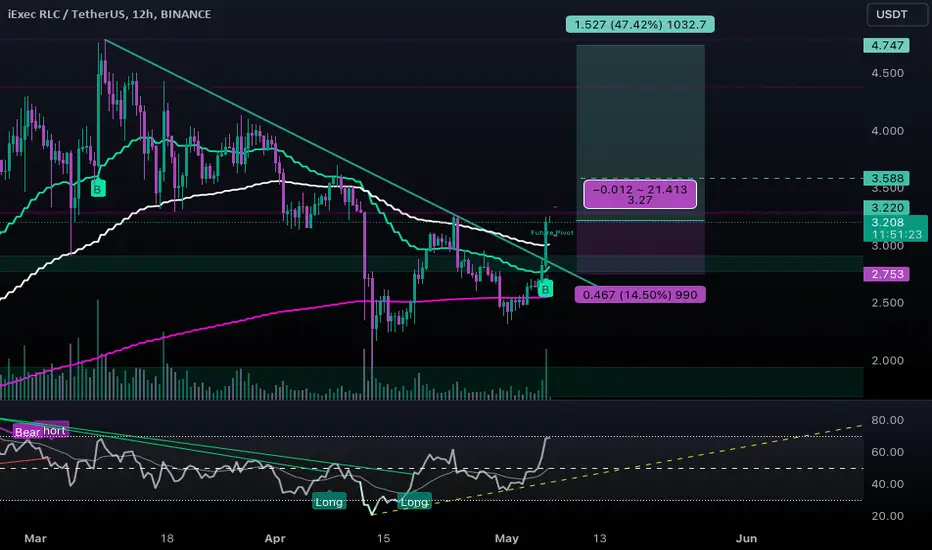
#RLC/USDT - Long - Potential 47.42%Strategy: Long
Exchange: BINANCE
Account: Spot
Entry mode: Market order in range
Invest: Risk 1%
Exit:
• ⎿ Target 2 : 4.747 47.1%
• ⎿ Target 1 : 3.588 11.19%
Entry: 3.227 ⌁ 3.227
• ⎿ Current market price: 3.227
Stop: 2.753 (-14.69%)
Technical indicators:
Volume pump, RSI momentum, crossing 20 & 50 MA
• ⎿ 24h Volume: 11176946.9429
• ⎿ Satoshis: 3.227
• ⎿ Analysis: TradingView
RLCUSDT trade ideas
$RLC looks amazing for a midterm
Trading the double bottom pattern involves identifying a bullish reversal pattern on a price chart and making trading decisions based on the pattern's confirmation. Here's a step-by-step guide on how to trade the double bottom pattern:
**Identify the Double Bottom Pattern**: A double bottom pattern appears on a price chart after a downtrend and consists of two consecutive troughs (lows) with a peak (high) between them. The lows are approximately equal and signify a possible reversal in the downward trend.
**Confirm the Pattern**: Before initiating a trade based on the double bottom pattern, it's essential to confirm its validity. Look for several signs to confirm the pattern:
` - Volume: Ideally, the volume should decline as the pattern forms and increase when the price breaks above the confirmation level.
- Symmetry: The two troughs should be roughly equal in depth and width, forming a "W" shape.
- Price Breakout: Wait for the price to break above the peak (high) between the two troughs, confirming the pattern.
`
**Entry Point**: Enter a long position (buy) once the price breaks above the peak (high) that separates the two bottoms. Some traders prefer to wait for a slight pullback after the breakout for a better entry point.
**Stop Loss Placement**: Place a stop-loss order below the lowest point of the double bottom pattern or slightly below the breakout level. This helps to limit potential losses if the pattern fails to hold, and the price resumes its downtrend.
**Take Profit Target**: Calculate the distance between the lowest point of the pattern (the bottom of the "W") and the peak (high) that separates the two bottoms. Then, project this distance upwards from the breakout point. This distance can serve as a potential target for taking profits.

#RLC/USDT#RLC
The price is moving in a triangle pattern on the 4-hour frame, about to break to the upside
The area in green is a very strong support area, and the price rebounded from it at the price of 3.40
We have an upward trend on the RSI indicator
We have a higher stability than move Average 100
Entry price is 3.85
The first goal is 4.05
Second goal 4.43
Third goal 4.80

RLC/USDT Ready to Take Juicy Liquidity Present Above? 👀🚀💎Paradisers, eyes on #RLCUSDT as it dances within an ascending triangle, hinting at a thrilling upward breakout. If it breaches through, brace for a significant bullish wave.
💎Here's the twist: if #iExecRLC stumbles at the triangle's lower edge, we're banking on a bullish pivot from the $2.83 support. This level is drenched in liquidity, marked by past rallies and vibrant green candles.
💎If GETTEX:RLC dips below $2.83, watch for a bullish swing from the $2.078 zone. A failure to rebound here might unleash a sell-off spree. Stay nimble and prepared to shift gears as we chart #RLC's course through these market waves.

Short RLCIt has broke down the support level and retested the daily opening as you can see in the chart,expecting the correction of 4-5% if btc goes down then we can expect more correction.
Comment what's your view of this idea 💡
RLC/USDT LOOKS PROMISING FOR BULLISH MOVE The RLC/USDT pair is currently exhibiting a breakout from a triangle pattern on the 4-hour timeframe chart. If this breakout is successful, we may anticipate a bullish move ranging between 20% to 40%. It is advisable to exercise caution and wait for confirmation of the breakout before considering any trading decisions.
Please note that this information is not intended as financial advice. It is crucial to conduct thorough research (DYOR - Do Your Own Research) and consider various factors before making any investment decisions. Trading in the cryptocurrency market carries inherent risks, and it is important to stay informed and use proper risk management strategies.

RLC TO BREAK TRIANGLE VERY SOON.RLC is testing support and having bullishness in crypto coins. RLC is expected to go for a long.


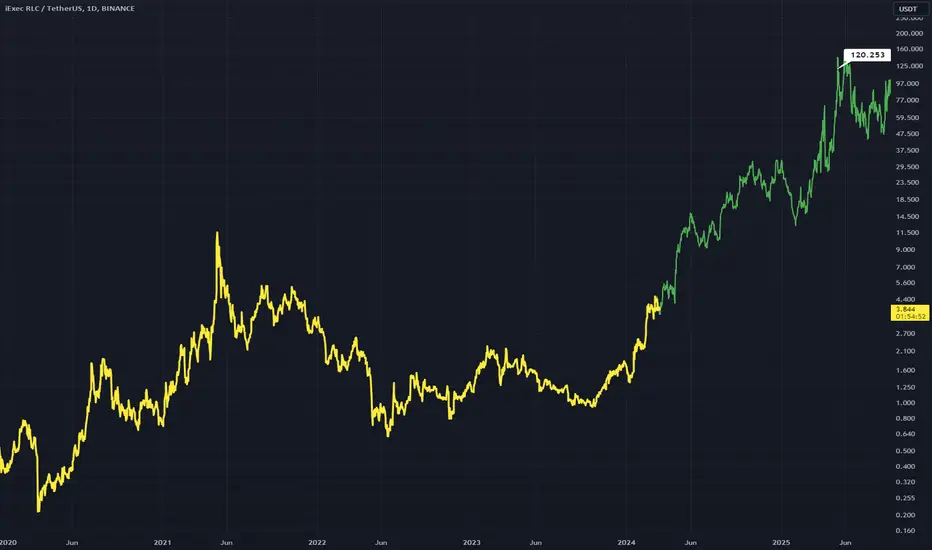
RLCUSDT - Bull Market RiseA bull rise that is comparable to the one I plotted on ROSEUSDT
The have a similar upper resistance line that wants to be tested
This could push the price way up to over the $100 range
Bullish Daily Chart
Again using the bars pattern tool for these AI coins
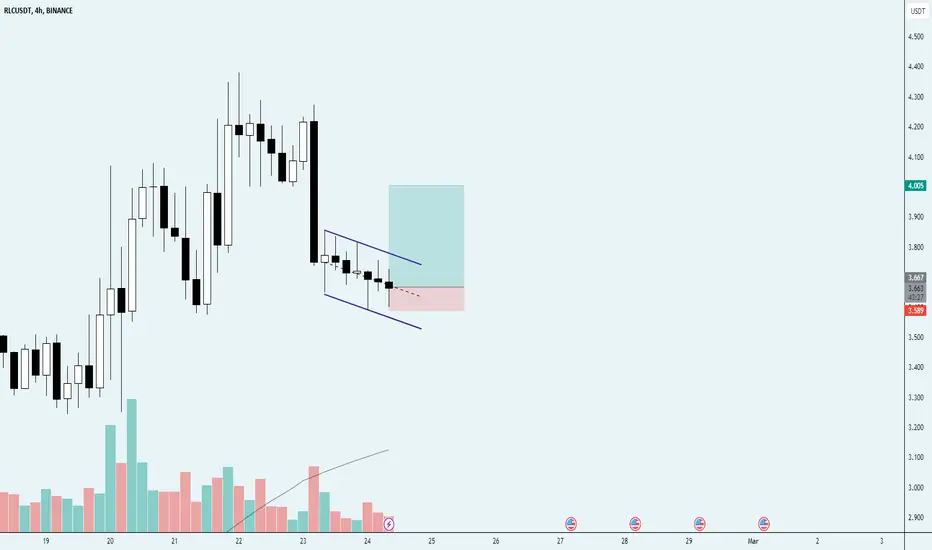
RLC/USDT Lose Moment to upward, Keep an eye on the OB or demand.💎 RLC has recently encountered significant developments in the market. There is potential for RLC to retest the Bullish OB around $3.55 before resuming its upward movement and possibly reaching our target area.
💎 However, if RLC fails to bounce and instead breaks down below the Bullish OB, the next support level to watch for is around $2.8.
💎 The demand area holds significant importance, as a strong bounce from this level could signal continued upward momentum for RLC. However, if RLC breaks down below the demand area, it would indicate a shift to bearish sentiment, potentially leading to further downward movement.

iExec RLCWhat Is iExec RLC (RLC)?
iExec is the leading provider of blockchain-based decentralized computing. Blockchain is utilized to organize a market network where people can monetize their computing power as well as applications and even datasets.
It does this by providing on-demand access to cloud computing resources. IExec can support applications in fields such as big data, healthcare, AI, rendering and fintech. IExec was founded on Oct. 16, 2016, with the goal to reinvent cloud computing through the creation of a new cloud computing paradigm.
Total Supply
86,999,785
Strongly undervalued price comparing to Total Supply. Partnered with Microsoft Azure few times ago.
------------------------------------
Trading Parts :
------------------------------------
Buy Zone : 4.7$ (Now) - 4$ (Rebuy More)
TP1 : 7.5$ (Security TP)
TP2 : 15-16$
TP3 : 24.5$
STOP : 2.8$
------------------------------------
Stay Safe + Follow TheKing
Happy Tr4Ding !

RLC NEW INCREASE VOLUMERLC has a new increase in volume trend which could confim in the coming time frame.
We will follow the trend to see if it's able to confirm.

RLC/USDT Indicating continue the upward movement for RLC!💎 RLC has recently undergone notable market dynamics. Following its breakout from the supply area, RLC experienced a significant upward movement, with no retesting observed thus far.
💎 RLC can retest the demand area and subsequently bounce for further upward movement. However, if RLC breaks the resistance without retesting the demand, it could signal a continuation of the upward movement towards our target area.
💎 On the other hand, if RLC fails to bounce during the retest of the demand area and instead breaks below it, this could be interpreted as a bearish sign. In such a scenario, the price of RLC may continue its downward trajectory, leading to further declines.

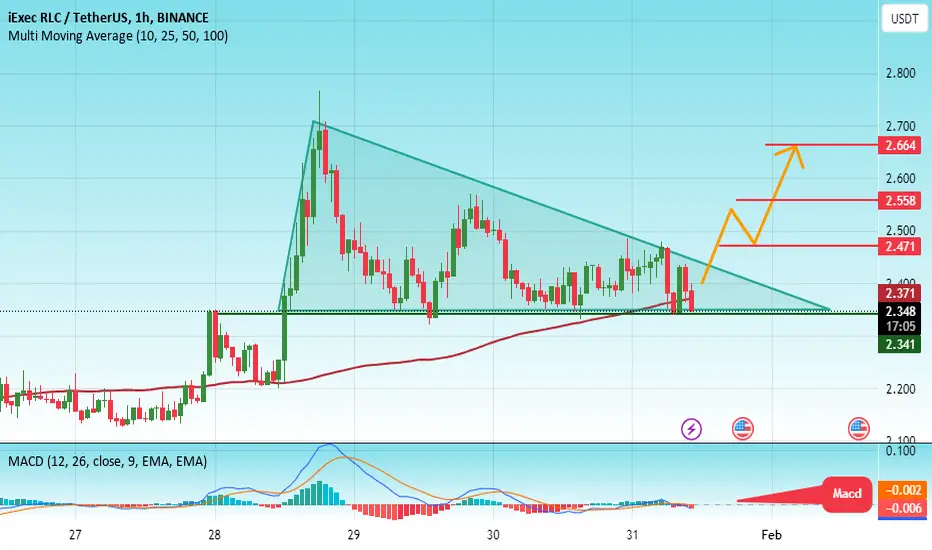
#RLC/USDT#RLC
The price moves in a triangle pattern on a 1-hour frame
It is expected that the triangle will be penetrated upward with stability above the Moving Average 100
We have strong support to rely on at the lower border of the triangle
Also we have oversold on MACD
Current price 2.36
The first goal is 2.47
The third goal is 2.55
Third goal 2.66
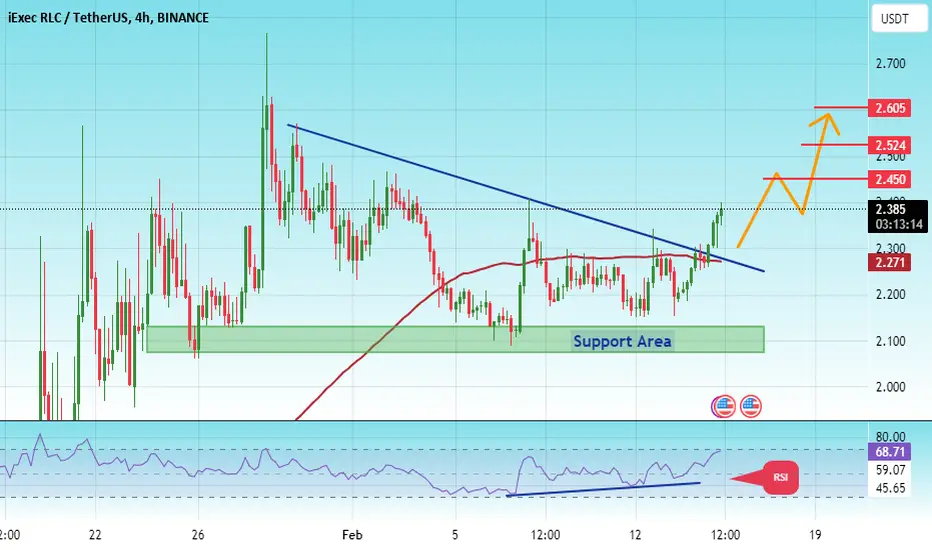
#RLC/USDT#RLC
The price broke the descending triangle upwards on a 4-hour frame
Drawing support from the green support area
We have support from the RSI indicator
We have a higher stability of Moving Average 100 that supports the rise
Expected to rise on targets
Entry price 2.38
The first goal is 2.45
Second goal 2.52
The third goal is 2.60
$RLC Long tradeGETTEX:RLC Long trade. According to my fibo levels there should be long trade.
Not a financial advice.
RLC/USDT Facing strong resistance, Could RLC breakout this area?💎 RLC has witnessed significant developments in the market. Currently, RLC is facing strong resistance in the market. Just a few days ago, RLC attempted to break through this resistance but faced a hard rejection, causing the price to retest the support area.
💎 Now, RLC is once again attempting to break through this formidable resistance level. If this attempt succeeds, it could trigger a bullish momentum, leading to a significant upward movement in price and probability reaching our target at the bearish OB area.
💎 However, if RLC fails once more to break through the resistance and displays bearish rejection candles similar to what occurred previously, there is potential for the price to retreat back to the support level around 1.85 to gather momentum for another attempt.
💎 The support area is of utmost importance, and a bounce from this level is necessary. If RLC is unable to sustain its position above the support, indicating a breakdown of support, it could lead to a shift back to a downward movement, potentially revisiting the demand area or even going further down.

RLCUSDTRLCUSDT is currently in a bullish trend.
Price is forming a bullish flag pattern, indicating a potential continuation of the uptrend.
The pair is finding support at the 50% Fibonacci retracement level, adding confluence to the bullish bias.
What you guys think of this idea ?

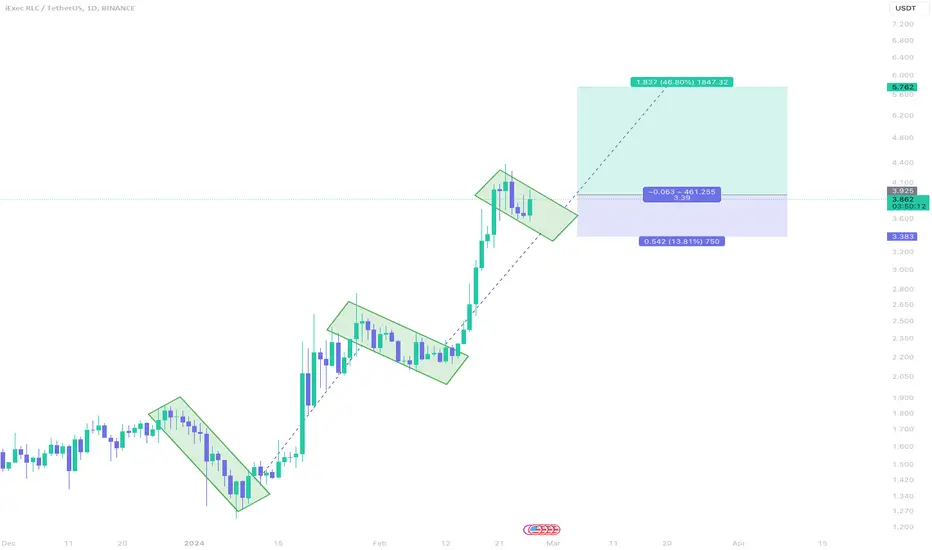
RLC - An Unconventional Trade Opportunity - For Brave-hearted #RLCUSDT Analysis
Description
---------------------------------------------------------------
+ RLC is presently consolidating near the resistance zone, displaying a consolidation pattern akin to its previous two consolidations.
+ Although this pattern may seem unconventional for trading, I maintain optimism regarding RLC's potential to adhere to this pattern and progress towards the next target.
+ Should this pattern persist, I intend to enter a long trade with a target set around 5.762. + Consider following this trade if you're willing to assume some risk in pursuit of substantial profits.
---------------------------------------------------------------
VectorAlgo Trade Details
------------------------------
Entry Price: 3.870
Stop Loss: 3.383
------------------------------
Target 1: 4.191
Target 2: 4.490
Target 3: 4.996
Target 4: 5.762
------------------------------
Timeframe: 1D
Capital: 1-2% of trading capital
Leverage: 5-15x
---------------------------------------------------------------
Enhance, Trade, Grow
---------------------------------------------------------------
Feel free to share your thoughts and insights.
Don't forget to like and follow us for more trading ideas and discussions.
Best Regards,
VectorAlgo
RLC/USDT BINANCE:RLCUSDT
This idea has a long-term profit goal.
All goals are indicated on the chart.
- Risk 0.5% on deposit
- RR-1/2
P.S (This is not an investment recommendation, this is my personal opinion.f)

RLC - Descending Channel Tightening I just longed GETTEX:RLC with a tight stop loss (%2) I just like the way it is shaping up in this tight channel and with the altcoin market showing strength today this one has been lagging.
Looks good for a push to fill in the inefficiency above.
May just dump and hit my stop overnight, but worth the risk imo.
Trade safely, use stops.
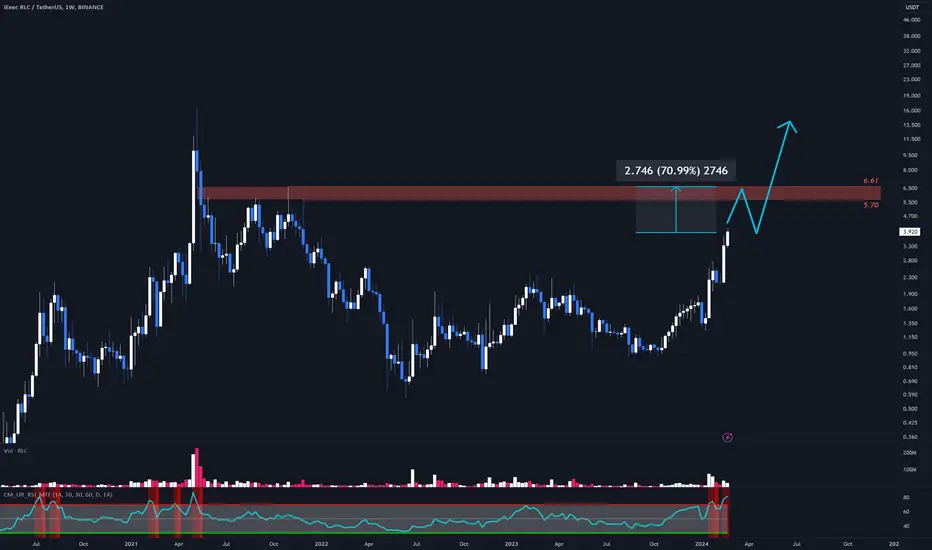
$RLC Poised for a 71% Rally in the Upcoming Week or Twoweekly chart is looking very bullish, another 71% upside here is almost guaranteed at this point,
ultimately, it runs higher to new all time highs, but market dynamics have to play out first.
weekly volume isn't even that high compared to the volumes seen in summer 2022.