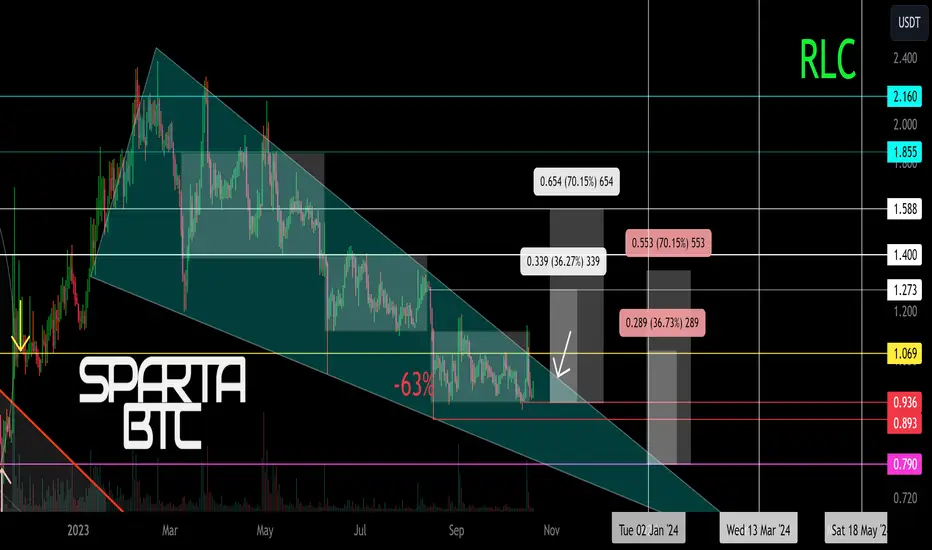
RLC/USDT Secondary trend. Decline -63% Wedge. 10 2023Logarithm. Time frame 1 day. Secondary trend.
Working with a wedge . Breakout, pullback after breakout. Showed percentages, two targets in succession and two options if the breakout will be now or after another decline when forming a wedge from key support zones. Stop loss on such coins before reversals is usually knocked out. Its length does not matter (large slippage due to liquidity) The chart earlier is a witness to it.
If you are working from the average buy/sell price , then put the average price between the two zones in your risk management, it is more rational. Hope for the best, but expect the worst. As a rule, breakouts on similar cryptocurrencies of such liquidity take place in impulses by a significant percentage. Take profits and forget it, move on to another similar coin before the breakout. Pump/dump coin is not for accumulation.
Low and medium liquid alts. Try to take the momentum, that is, the first movements of the trend reversal (breakout of the wedge), do not emphasize the instrument (crypto coin), it is all conditionally crypto garbage. Use the given time, don't use high leverage + protect profits if they are substantial. There is no real shock capitulation yet, whether they will do it or not is another question.... But always more yes than no.
🧠 Mani and risk management. .
In any case, always follow mani management, less margin, more spot. Limit potential risks, especially on HYIP garbage, observe adequate risk management especially when working locally, no matter you are working with stop loss or from average buy/sell price. Risks are calculated in advance, not post facto. Set adequate targets as for a local trend, without hamster x's (i.e. maximum channel range or a little more than the average price of targets (according to TA) of the wedge.
Line chart.
RLCUSDT trade ideas
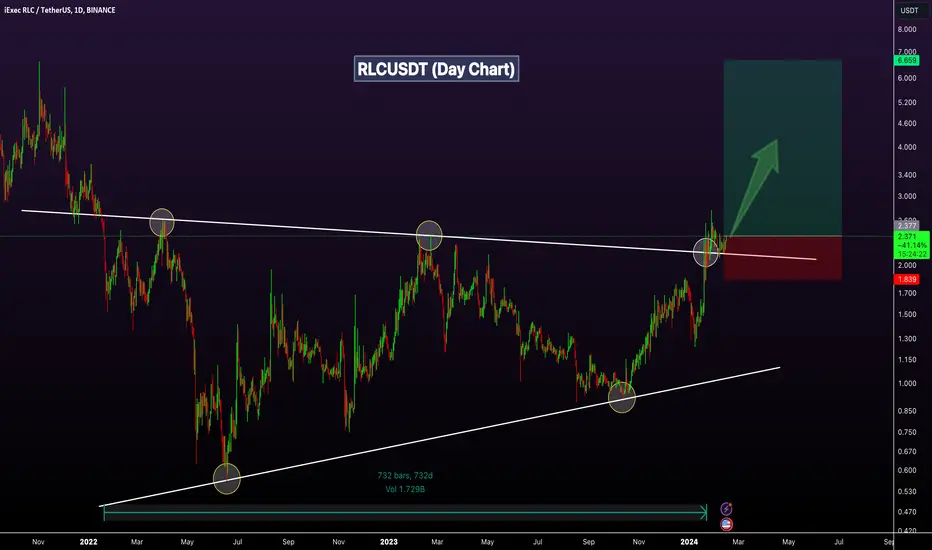
RLCUSDT RLCUSDT Technical analysis update
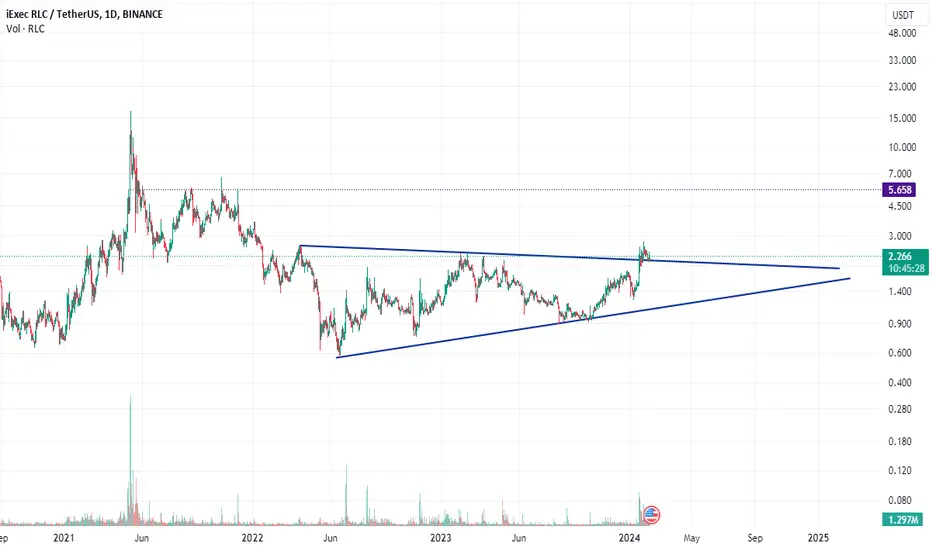
RLC price exceeded the resistance line of a triangle pattern with high volume on the day chart, after over 700 days of formation. While this could indicate potential upward movement in the coming days
Buy Level: Below $2.40
Stop loss: $1.83
Regards
Hexa
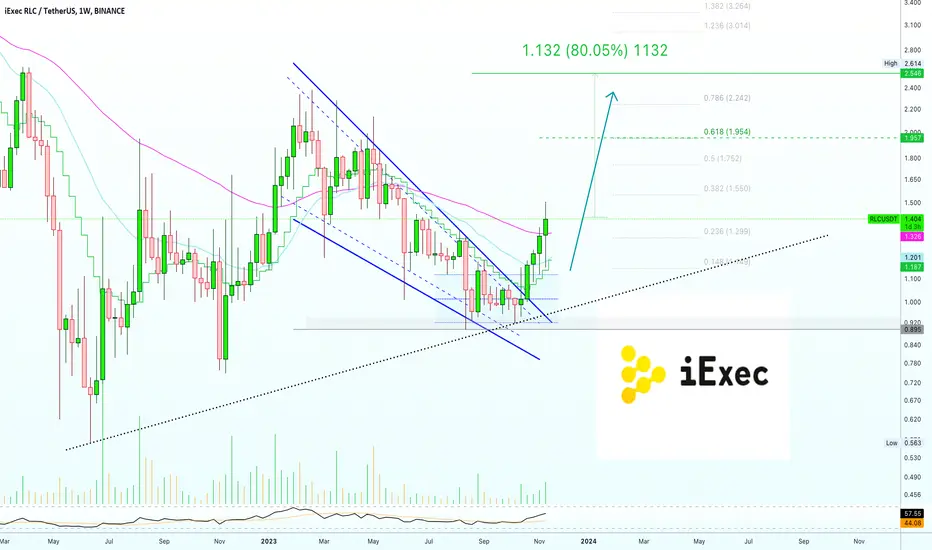
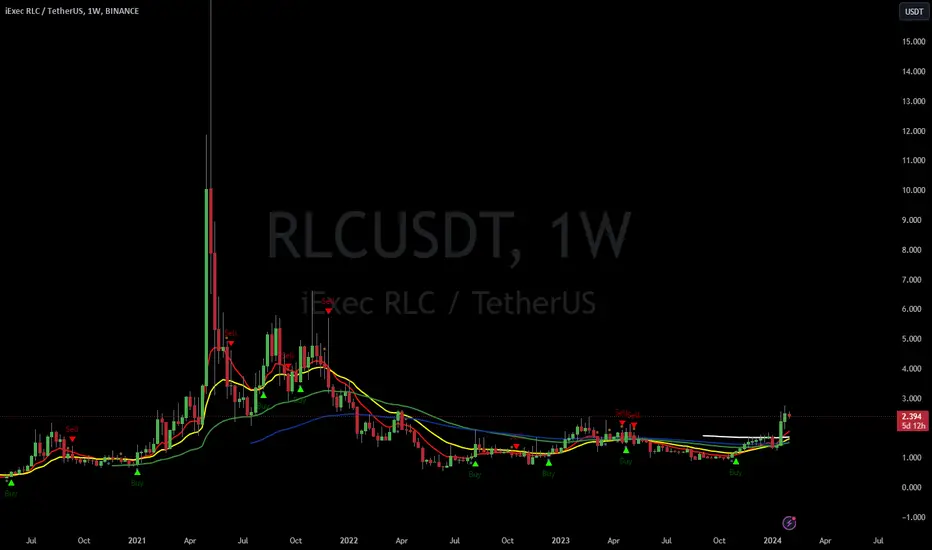
✴️ Easy 80% Bullish Jump Confirmed | iExec RLCWe have a strong chart with many great signals pointing to a nice jump, it can happen fast as soon as confirmation comes in.
➖ iExec RLC produced a higher low in August 2023 vs June 2022, a long-term higher low.
➖ This is the fifth session to close bullish (green). 5 weeks straight.
➖ Volume is rising and this week marks the first bullish close above EMA50 since January 2023.
➖ These signals are supported by a strong RSI.
👉 We can see 80% growth fast and easy , this is no big deal. With more possible long-term.
This is not financial advice.
Remember to do your own research and planning because the charts can always change.
Thank you for reading.
And thanks a lot for your continued support.
You are appreciated.
Thanks for the follow. 👑
Namaste.
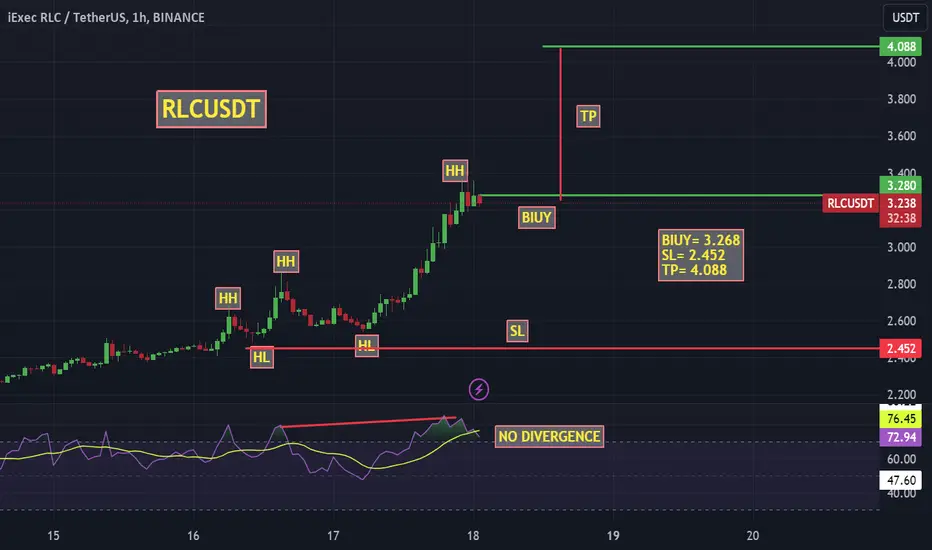
RLCUSDT - BUY NOW RLCUSDT-
1 Open a Spot position so you can enter a trade and TP is slightly hit the target.
2. Make sure you can open the position with your risk management.
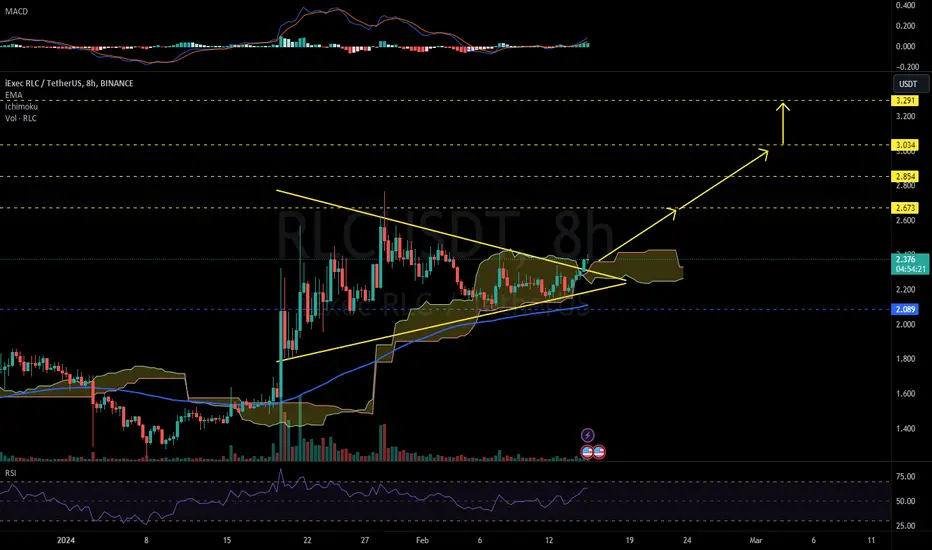
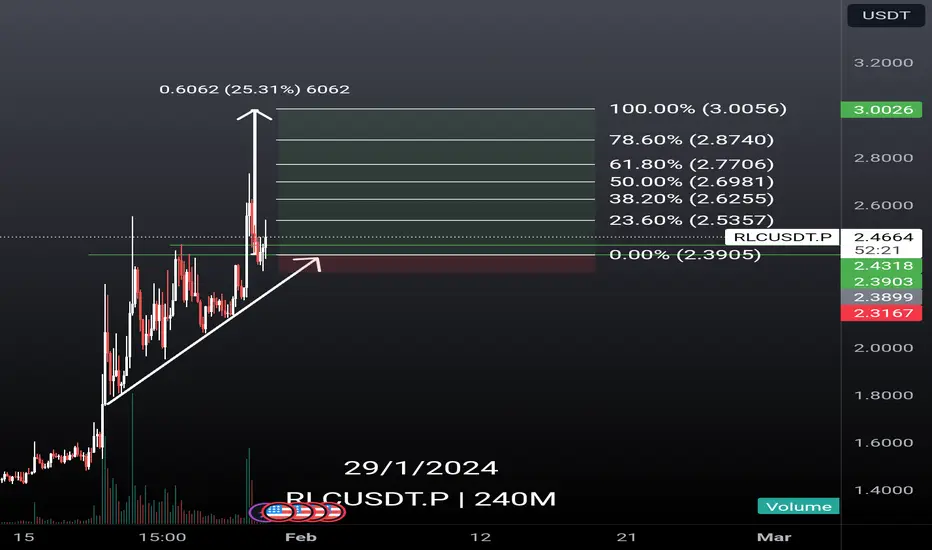
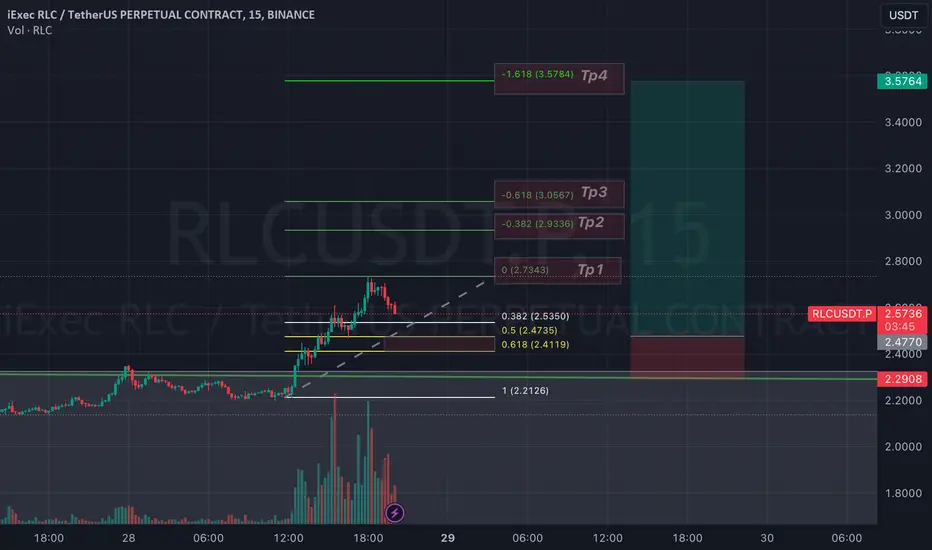
RLCUSDT 8H#RLC broken out from the Bullish Pennant. It is also passed the Ichimoku cloud on 8H timeframe. Targets are:
$2.673 $2.854 $3.034 and $3.291
RLC Buying Frenzy: Seize the Opportunity Now!## RLC Coin: Recent News and Disclaimer (as of February 15, 2024, 09:43 CET)
**Disclaimer:** I am not a financial advisor and this is not financial advice. Please do your own research before making any investment decisions.
**Recent News:**
* **Red Light Finance (RLC) announced a partnership with Chainlink on February 13, 2024.** This partnership will integrate Chainlink's decentralized oracle network with RLC's lending platform, enabling access to secure and reliable off-chain data. This could potentially increase the transparency and efficiency of the RLC platform.
* **RLC's price has seen some volatility in recent weeks.** After reaching a high of $0.012 on February 9th, the price has since fallen to around $0.008 as of today. This is likely due to the broader market downturn in cryptocurrencies.
* **There are no major fundamental updates for RLC at this time.** However, the team is continuously working on developing the platform and expanding its ecosystem.
**Additional Notes:**
* It is important to be aware of the risks associated with investing in cryptocurrencies. The market is highly volatile and there is a chance that you could lose all of your investment.
* It is important to do your own research before investing in any cryptocurrency. This includes understanding the project's whitepaper, roadmap, and team.
* You should only invest what you can afford to lose.
I hope this information is helpful. Please let me know if you have any other questions.
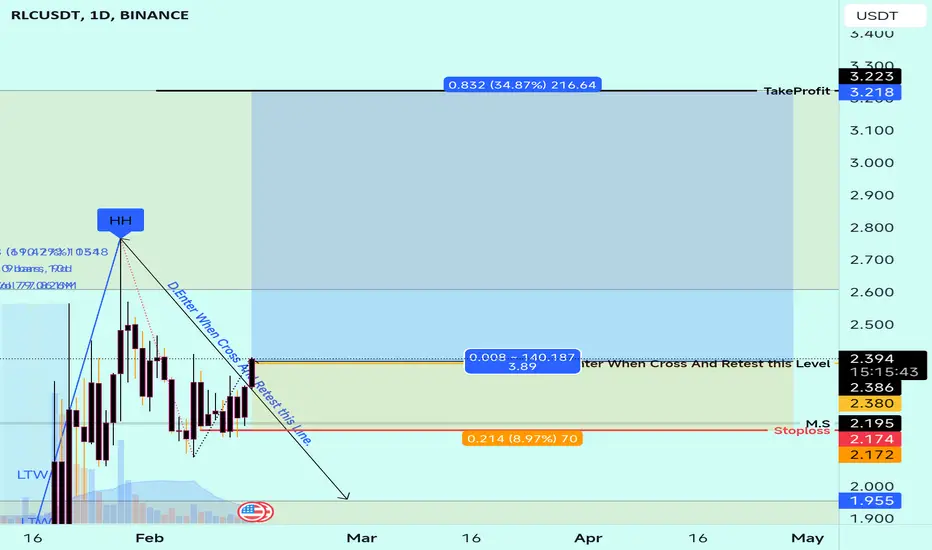
#RLC Long Scenario RLC Long Scenario
RLC waiting for breakout of trendline.
We are above support lovel.
After breakout and retest will Enter long
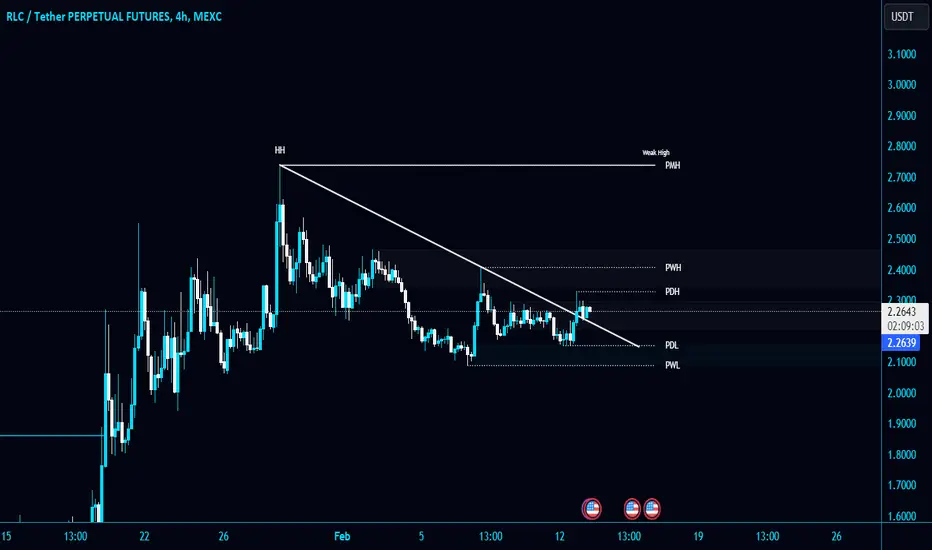
#RLC/USDT breaks the Diagonal Trendline in 4-Hour TF!#RLC/USDT breaks the Diagonal Trendline in 4-Hour TF!
GETTEX:RLC needs to hold the trendline to gain the bullish momentum. Looking for a long position. The local resistance level is PWH $2.41.
#RLCGETTEX:RLC is one of the powerful Web3 and AI project. These two are going to build a new vision for our lives and of course for the crypto future. As you can see on the #RLC chart the downtrend was broken, completed its re-test and started to move upwards. The project has potential to jump up to $6 band. The #INJ had a chart like this and it made a great journey $1,2 to $45. I'm very much bullish for RLC and believe that it will make a spectacular movement trough to the top .
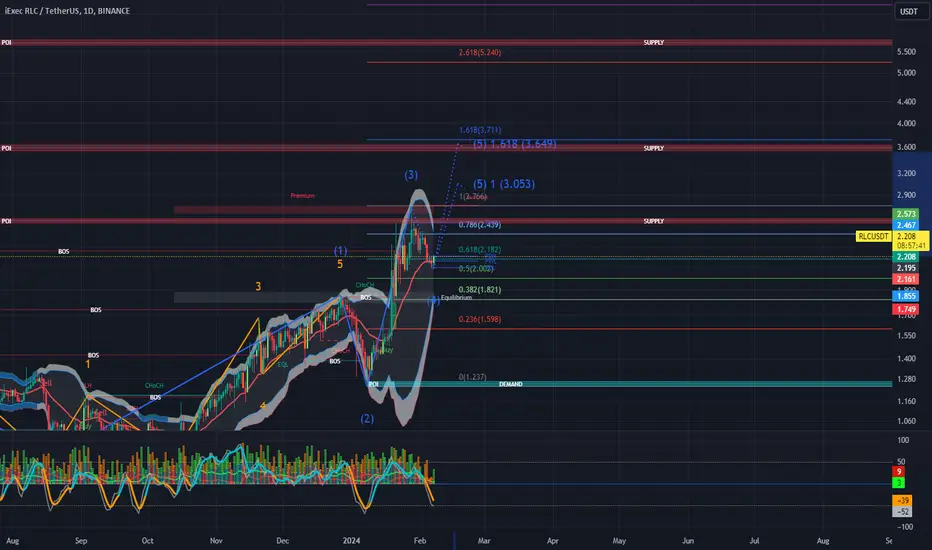
RLC - 1D - $3,50 - 59% profit possibleRLC is holding support and looks ready to continue it's upward movement in a Elliot wave 5. The potential target could be somewhere around $3,50 and can give a potential profit of approx. 59%.
RLC is definitely bullishWe have had an ascending channel that broke the bottom once but it was faked out and again the price returned to the ascending channel that I marked on the chart.
On the bottom of the white boxes, they show the overflow that the candles have done well.
From where I entered START, the upward movement has started. We have bullish CH and BOS on the chart and the candles have respected the demands well.
Above we have a liquidity pool that I specified with $$$. The candles are going to clean this pool in the first step.
I marked the TPs on the chart.
I also marked a FLIP LINE on the chart that I use for my loss limit. When 1 daily candle closes below this line, the analysis will be invalidated.
For risk management, please don't forget stop loss and capital management
Comment if you have any questions
Thank You

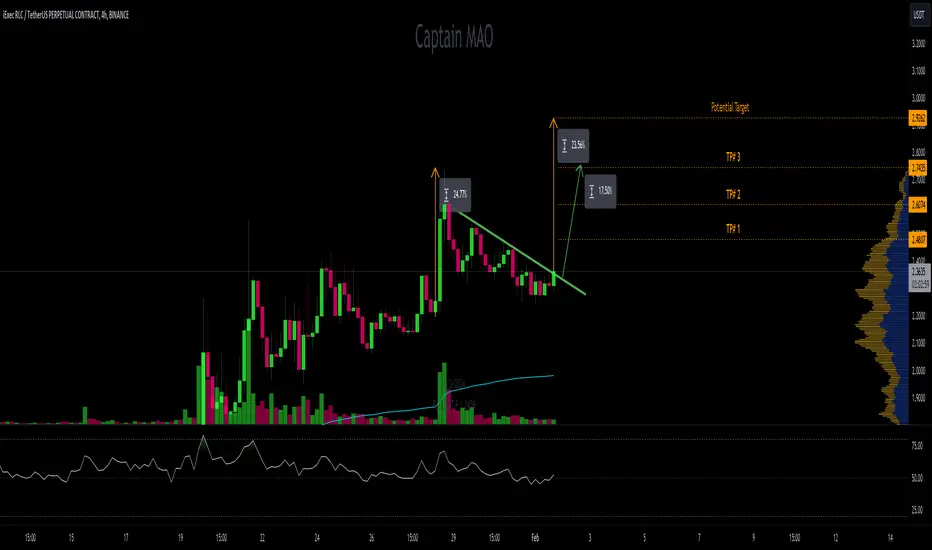
RLC breakout ,scalp RLC stayed strong now about break out for scalp traders 17-20% move from break out
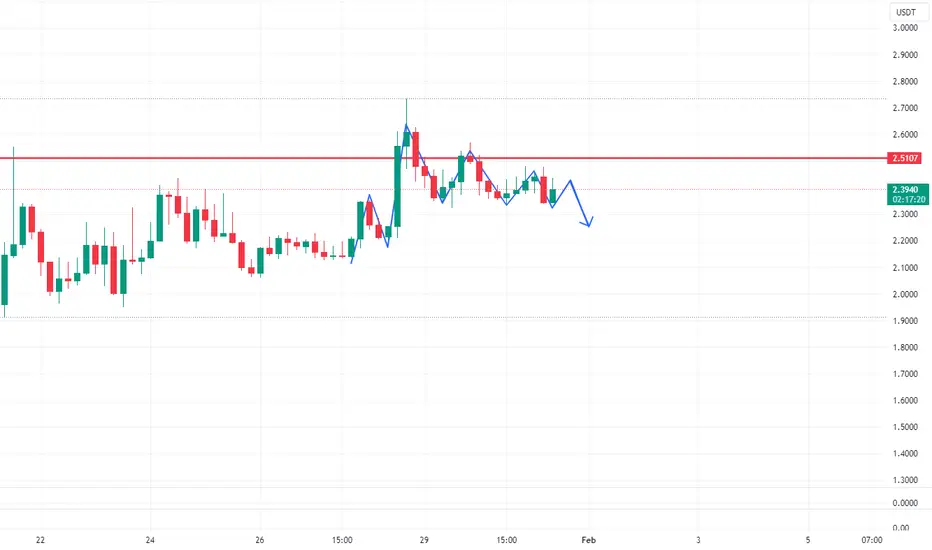
RLCUSDT.PAnticipating a decline in RLC against USDT is based on the observation of a pattern characterized by three consecutive bottoms.
Don't forget to check and support my portfolio
#1 RLC. Another GEMRLC/USDT
Looking at the weekly and monthly chart, I can see that it's trying to get back into trading zone of $5 and $3.8. I see it very bullish, with a stop loss under $2.2 this is a keeper and let the baby ride. Do not under estimate RLC. It is a GEM, A KEEPER!
RLC USDT PERPHello Trader BINANCE:RLCUSDT.P
The positive rlc area makes an ascending triangle, and the area is also valid for bullish, take limit area is at 2.4318 - 2.3905 for stop loss I use 3% because the return posted is quite large too, to minimize losses and fake patterns.
Please add a comment and Positive feedback and constructive criticism are important to authors and the community.
Disclamer: Not Financial Advice
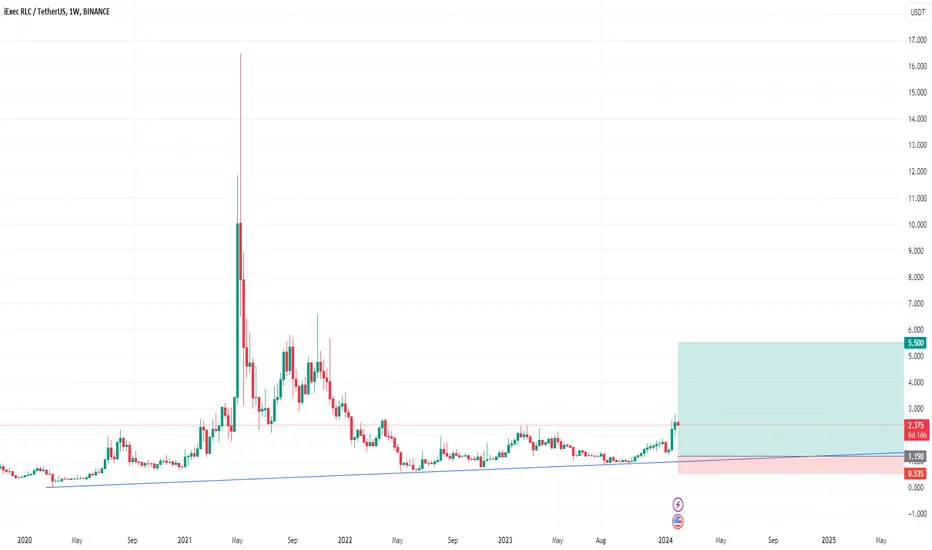
RLCUSDTRLC can perform in the upcoming bull run. Monthly support lies at 1.19 where accumulation can be done for the long term target of 5.50
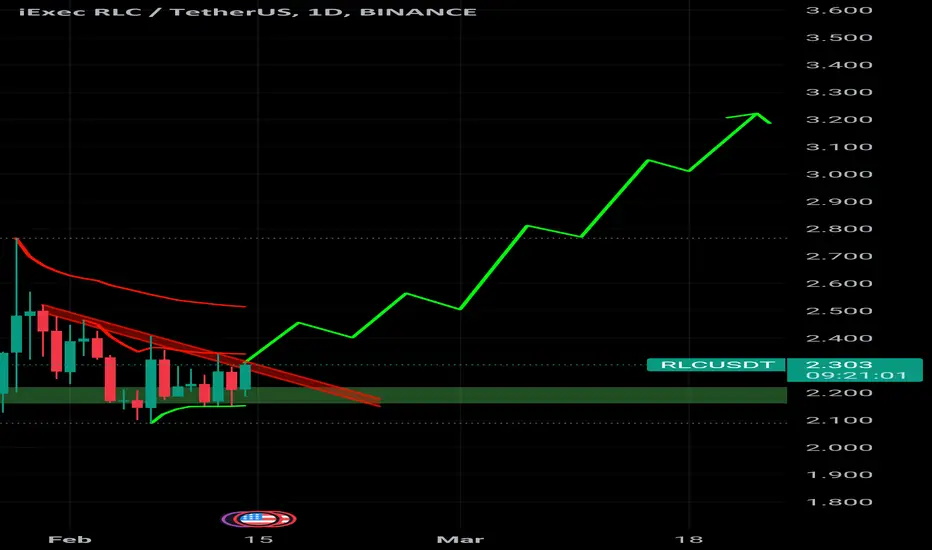
RLC Break up the channel ... RLC break up the range channel finally, we are waiting for confirmation.
Then go Long Position as you see in the chart.
BINANCE:RLCUSDT.P BINANCE:RLCUSDT.P
#RLC/USDT#RLC
The descending triangle has been broken since July 2022
Powered by a moving average of 100.
Also, there is a large oversold position on the MACD.
Current price 1.38
First goal.2.35
Second goal 3.50
This represents 300% of the current price.
Supported by upward momentum from the market

RLC LongI think this one can resume the pump from here if holds.
Risking some on this from here with tight stoploss.
I am in LL Long from here.
1.3850 and below.
Targeting 2 and higher if resumes.
Invalidation is tight clean break below local low at 1.37.
Note: Not a Financial Advice.

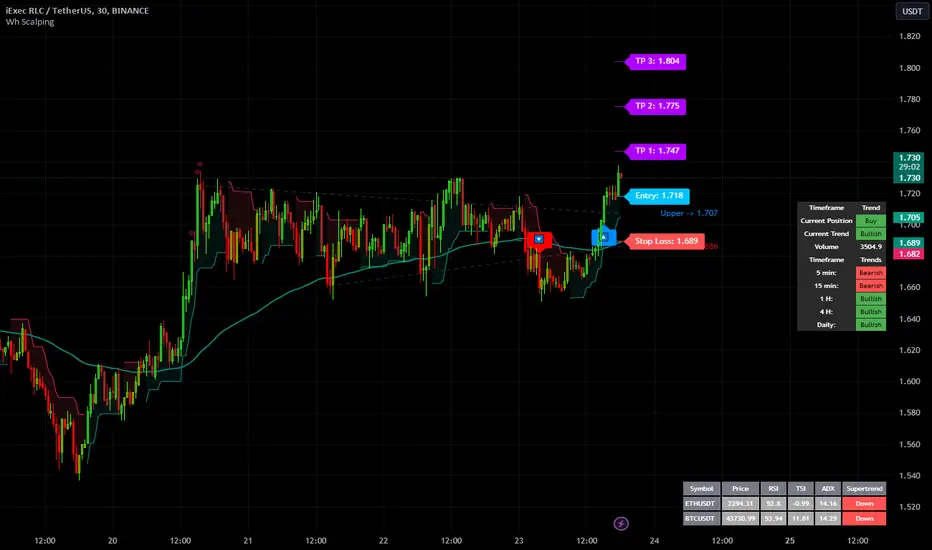
RLC/USDT Could RLC bounce from here and continue upward??💎 RLC is currently positioned at a pivotal support area, where a bounce is crucial for continuing its upward trajectory towards a strong resistance target. This moment is critical for determining RLC's short-term market direction.
💎 However, should RLC fail to maintain its stance at this support level and instead break below it, it would signal a bearish development for the asset. Such a breakdown would confirm a bearish trend, potentially steering RLC towards the lower demand area.
💎 The demand area, therefore, represents a significant juncture for RLC. For the asset to resume an upward trend, it is essential that it demonstrates a strong rebound from this area and successfully surpasses the resistance level. If RLC is unable to accomplish this – showing signs of weakness or continued consolidation at the demand level – it would likely lead to an extended downward trend, pushing the price further down.

RLC/USDT riding bulls? 👀 🚀 RLC Today analysis💎Paradisers, it's time to watch RLCUSDT closely as it presents a potential opportunity. Recently, it has shown a notable rejection from its resistance level, hinting at a high chance of a bullish continuation from the 0.5 Fibonacci retracement level.
💎#IEXEC has consistently followed a pattern of breaking above a descending trendline and initiating an upward move. Currently, after facing rejection at the resistance level of $1.511, the likelihood of a continued uptrend seems more pronounced. RLC is now targeting resistance levels at $1.511 and possibly extending to $1.743.
💎 For the astute Paradisers, timing is key. It's important to identify the right moments for entering the trade during this rise, steering clear of buying at the peak. Moreover, be prepared for the possibility of RLC dropping below the $1.331 mark. In such a case, we could expect a bullish resurgence from the support level of $1.138. However, a fall below this support might question the sustainability of the uptrend.
💎 In these market conditions, choosing the right entry and exit points becomes crucial. Implementing a sound trading strategy, with a focus on money management and clear understanding of support and resistance levels, is essential for successful trading outcomes. 🌴💰

RLC/USDT It required Break out the resistance or rejected ??💎 RLC has undeniably garnered significant attention in the market. Currently facing resistance, RLC needs to break out of this level to sustain its upward trajectory. The perfect bounce observed from the demand area suggests a potential breakout of the resistance in the near future, the probability an easy movement toward our target area.
💎 However, if RLC struggles to break the resistance, there's a possibility of a retracement, with RLC returning to test the demand area multiple times.
💎 The bad scenario is confirmed if, during the retesting phase at the demand area, RLC fails to maintain its position and undergoes a breakdown. In such a case, RLC may shift to a bearish trend, potentially retracing to the strong support area.