ROSEUSDT trade ideas
ROSEUSDT-Falling Wedge Formation#ROSE/USDT
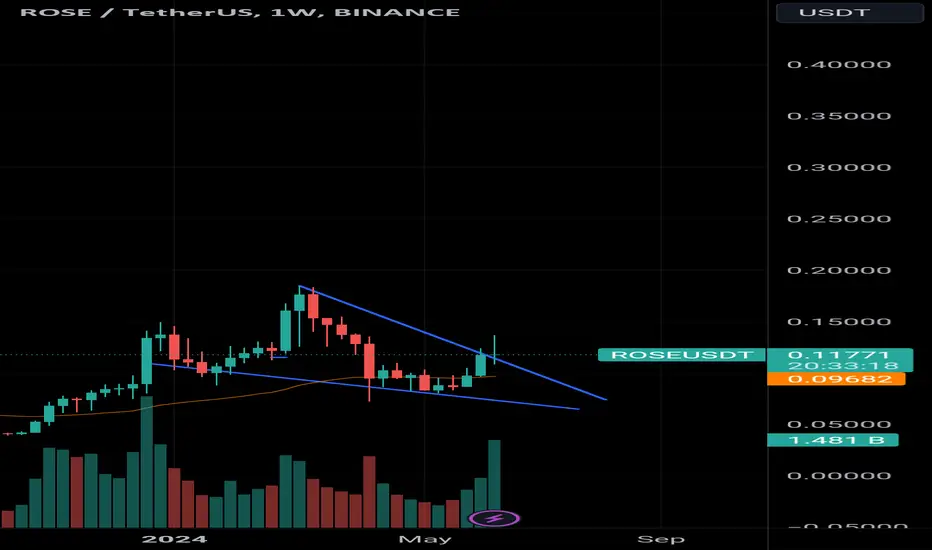
ROSE broke out of falling wedge formation to upside on daily timeframe😉
Bullish priority is intact🐃

ROSEUSDT - Bull Idea (Creating New ATH)ROSEUSDT has completed a first bull run move out of the recent falling wedge structure
I expect this move to continue as shown by the curved lines
Action in circles are what I expect to be similar and repeat
Bullish AI coin

$Rose retest, could it bounce?ROSE has retested back and looking strong after breaking a previous rectangular resistance.
It might still continue if price hold further on support.

ROSE Weekly Re-Accumulation / Macro EW ProjectionsROSE has a perfect looking daily re-accumulation going on here.
I have a macro Wave 5 target all the way up at $0.53 and beyond. Ideal entries & targets are highlighted in yellow, however I already took an entry lower. We may not see those levels for entry again.
This coin is currently trending on Twitter, and stayed strong during the big market dip. Once the market starts bouncing back, this will bounce back twice as hard.
Ideal Entries $0.1106, $0.10500, $0.08745
Long Term Wave 5 Targets $0.24293, $0.27873, $0.356, $0.53344 (and beyond)

#ROSE/USDT#ROSE
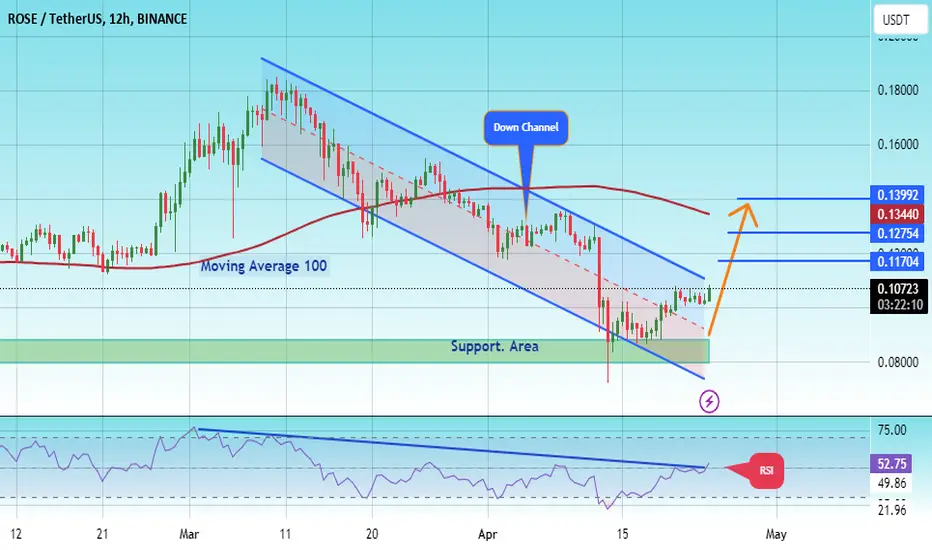
The price is moving in a bearish channel on the 12-hour frame and adheres to it well, and the price rebounded from the lower border of the channel at the green color at the price of $0.850.
We have a tendency to stabilize above the Moving Average 100
We have a downtrend on the RSI indicator that was broken to support the rise
Entry price is 0.100
The first target is 0.1170
The second target is 0.1275
The third goal is 0.1400
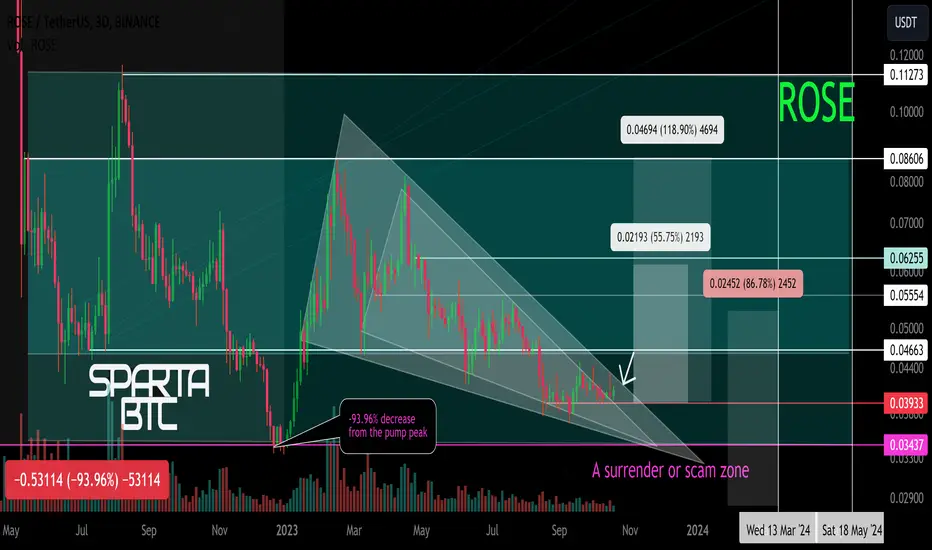
ROSE/USDT Secondary trend. Wedge in the horizontal channel.10 23Secondary trend, horizontal channel zone. Declines from the pumping maximum -93.96%
Local work with wedge breakout and channel range. In case of a negative scenario in the market - work from the capitulation zone. Allocate the position in advance. Percentages from this zone did not show, but take it into account in your risk management.
Line chart.
Main trend , to understand this zone for work.
About mani management in working now on similar medium and low liquidity cryptocurrencies, read the description of this trading idea:
RLC/USDT Secondary trend. Decline -63% Wedge. 10 2023
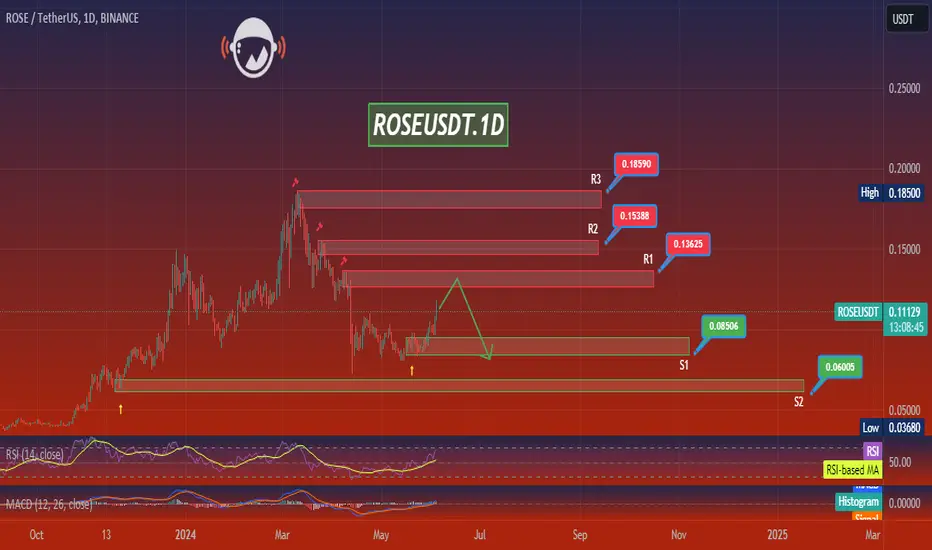
ROSEUSDT.1DIn reviewing the ROSE/USDT daily chart, I observe that the price has been attempting to recover after a significant drop. It recently bounced off the support level marked S1 and is now challenging the R1 resistance level. The trading volume appears to be steady, indicating sustained interest in this price zone.
The Moving Average Convergence Divergence (MACD) suggests a bullish momentum as the MACD line is above the signal line, which could be indicative of a continuation of the current upward trend if sustained. The Relative Strength Index (RSI) is currently at about 60, approaching overbought territory but still offering room for potential price increases before the market would typically consider it overextended.
From a strategic perspective, if the price successfully breaches the R1 level at 0.13625, it may open the path towards R2 at 0.15338. Should it fail to sustain this break, a retest of the S1 level could occur. Given the current indicators and price action, my inclination is to watch for a sustained break above R1 with potential profit targets near R2, while keeping a cautious eye on the RSI for signs of overbought conditions that could precede a retracement.

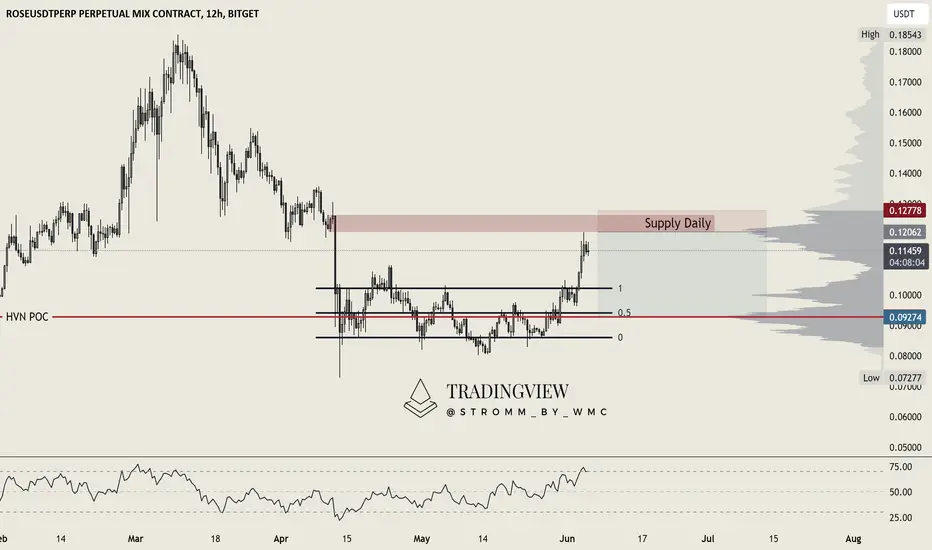
ROSE - Selling the TopWe have two setups here in either direction we have been screening ROSE and ONDO for quite a while now and we want to bid both this short and the long. We let those things run over the night, therefore we play it with a hard stop.
On ROSE we have been ranging for quite a while and we finally broke out and cleared out the imbalances that have settled on the sell off candle on the 12.04 the supply needs to be flipped in order to be bullish. Even tough BTC seems to hold it's level nicely we think this daily supply is too much for ROSE to flip. As a target we are eying the POC at $0.0927 but we are going to take profits on the way down.
You will find ONDO here -
ROSE - LongRose is showing multiple strong patterns for incoming strong impending bullish wave. The harmonic patterns, SMC and SK analysis is a potential target upside of 44%.
The entry is divided into two long position based expected move for the price, and don't forget to implement the stop-loss to manage risks effectively.

ROSEUSDT.1DLooking at the daily chart of ROSE/USDT, we can observe several technical elements that suggest potential future price movements.
Resistance Levels: The chart identifies three significant resistance levels at R1 ($0.13625), R2 ($0.15388), and R3 ($0.18590). These are the points where selling pressure has previously overcome buying momentum, leading to a price reversal.
Support Levels: Two key support levels are indicated as S1 ($0.08506) and S2 ($0.06005). These levels have historically provided a price floor, where buying interest has been strong enough to prevent further declines.
Price Trends: The price trend has shown a decline from the previous highs, followed by a period of consolidation. This consolidation phase is depicted with a predicted potential short-term bullish movement (as indicated by the green arrow), suggesting an anticipated retest of the R1 resistance level.
Trading Strategy:
Bullish Scenario: If the price breaks above the current consolidation phase and surpasses R1, there might be an opportunity to trade towards R2. Traders would consider buying on a confirmed break above R1 with stop losses set below this level to mitigate risk.
Bearish Scenario: Should the price fail to break above R1 and instead moves downward, breaking below S1 could open a path to S2. This would be a signal for a potential short trade or exiting long positions to minimize losses.
Volume and Volatility: While not explicitly shown on the chart, volume and volatility are important to watch. An increase in volume during a price breakout above resistance or below support can validate the move, suggesting a stronger momentum.
Conclusion: Current indicators suggest a cautious approach, watching for either a breakout above the consolidation to target R1 and potentially R2, or a breakdown below current levels towards S1. Setting appropriate stop losses and considering the broader market context will be crucial for trading decisions. Traders should remain adaptable to changes and keep an eye on volume as an additional confirmation for any moves.
ROSE/USDT showing sign of strong bullish move? 💎 Ladies and Gentlemen of ParadiseClub! Keep your eyes on #ROSEUSDT as it shows promising signs of a bullish continuation from the demand zone, following a breakout from descending resistance.
💎 A closer look reveals that the Bollinger Bands are tightening, typically a precursor to a significant upward movement. Currently, the price of #ROSE suggests an increased likelihood of a bullish trajectory from the demand zone at $0.08980. Should it maintain this momentum above the EMA 100, we could see a strong bullish push towards the next supply area.
💎 The ascent is likely to begin once the price successfully overcomes the supply area and sustains its upward momentum. However, it's crucial to consider alternative scenarios: if BCBA:ROSE cannot break the descending resistance and begins to fall, a bullish recovery from the lower support zone at $0.08003 might occur. Nevertheless, a fall below this level could undermine the bullish scenario, potentially leading to further declines.
MyCryptoParadise
iFeel the success🌴

ROSEUSDTWe can attempt to buy ROSEUSDT from specified level if it break LH , trendline resistance , also bullish divergence occur indicate that it move upward.
SL , TP mention in chart.
Rose Rose coin liquidatind daily candle and bouncing back from support ,
Perfect time to buy rose as bull run approaches 📈📈

$ROSE Limit longBCBA:ROSE limit long. As most of crypto is bottoming out, this looks like a very good RR. I suspect if this hits, it will be last time this price will ever be this low. Time for ATH
OASIS Rose Technical Analysis and Trade IdeaOn the daily timeframe, we observe a double bottom formation that has experienced a spike below into liquidity. This situation suggests the potential for a trend reversal. If this scenario unfolds, there's an opportunity to buy at a substantial discount and capitalize on an early entry before a bullish rally (assuming my analysis proves accurate). In the video, we delve into trend analysis, market structure, price action, and other critical aspects of technical analysis. I share my perspective on accumulating and entering this market, emphasizing the importance of prudent risk management. Remember, this content is purely educational and not financial advice. 📈🚀🔍

ROSEUSD 12HROSE ~ 12H
#ROSE We pay attention #ROSEUSD This chart looks interesting for the 12H time frame.
In terms of pattern, BCBA:ROSE has succeeded in breaking through the resistance of this pattern.

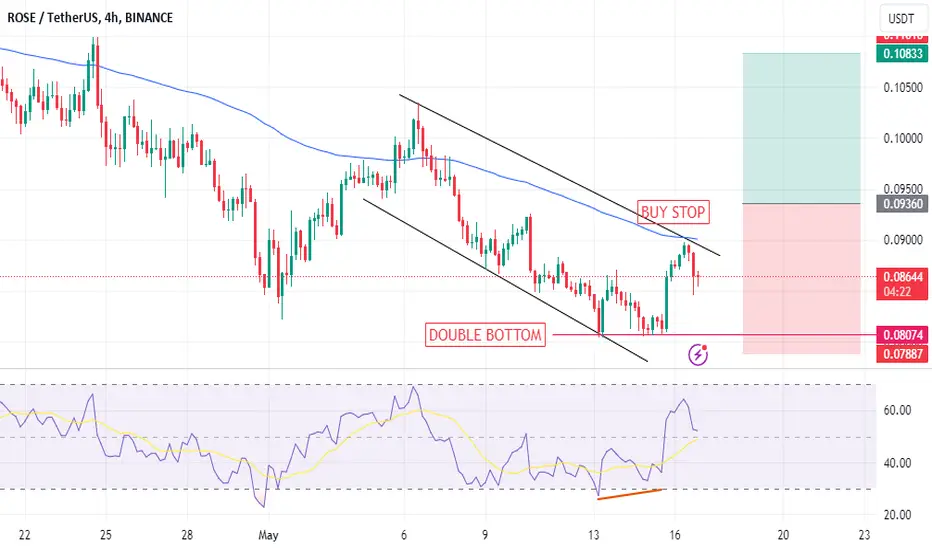
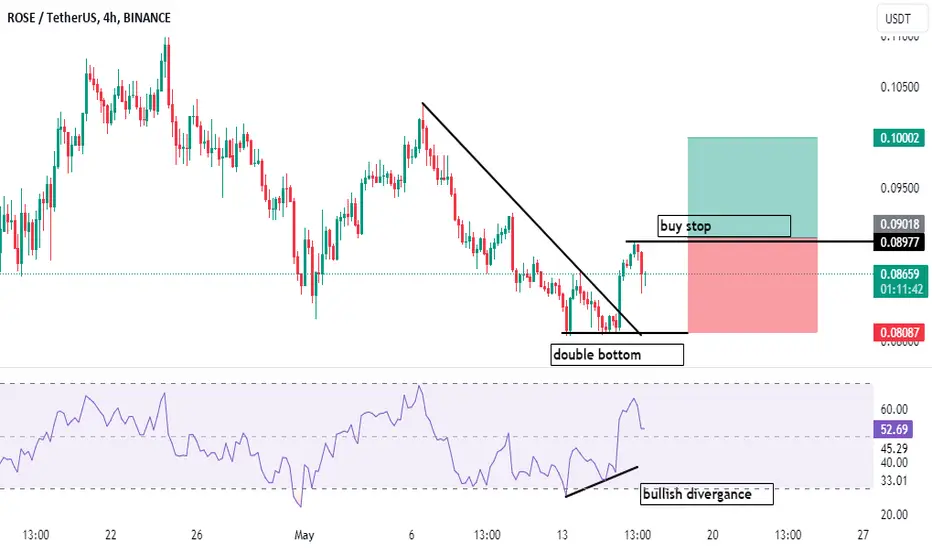
ROSEUSDT ROSEUSDT is showing bullish divergence place a buy stop at 0.09018 as it break its Last LH plus Double bottom pattern neckline along with trendline
ROSE, may target back above 0.080 soon after 61.8 FIB touch.ROSE on daily data is showing some significant accumulation / net buying after touching the 61.8 FIB LEVEL.
It clearly bounces off that significant level with accuracy. Expect a reversal to the upside from the current price range:
Spotted at 0.0620
TAYOR.

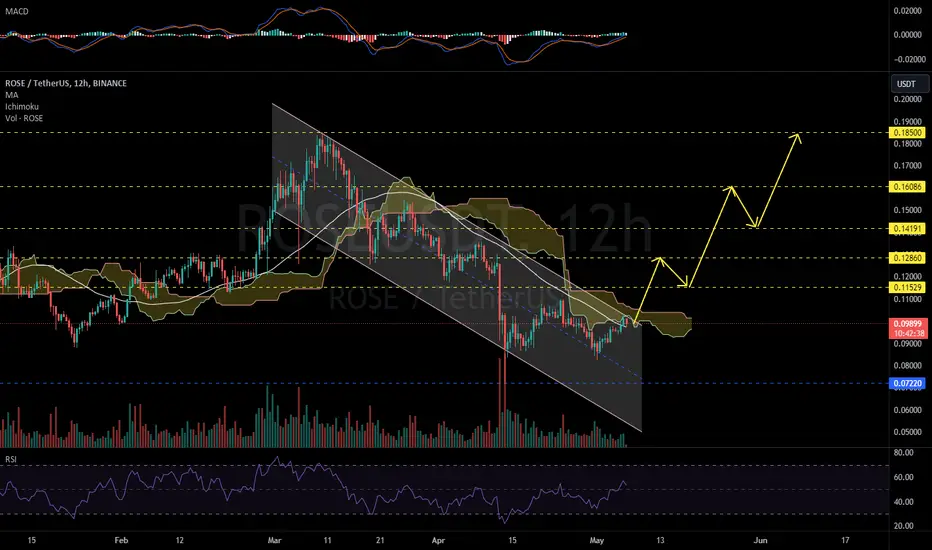
ROSEUSDT 12H#ROSE is moving above the MA50 on 12H timeframe. It is testing the descending channel resistance and Ichimoku cloud. In case of a breakout, the targets are:
$0.11529
$0.12860
$0.14191
$0.16086
$0.18500
Wait for the breakout and then enter.
🚩🚩Test only for studyTest chart for practice only
This chart not for entry only saving to see how wrong is my drew
Thanks

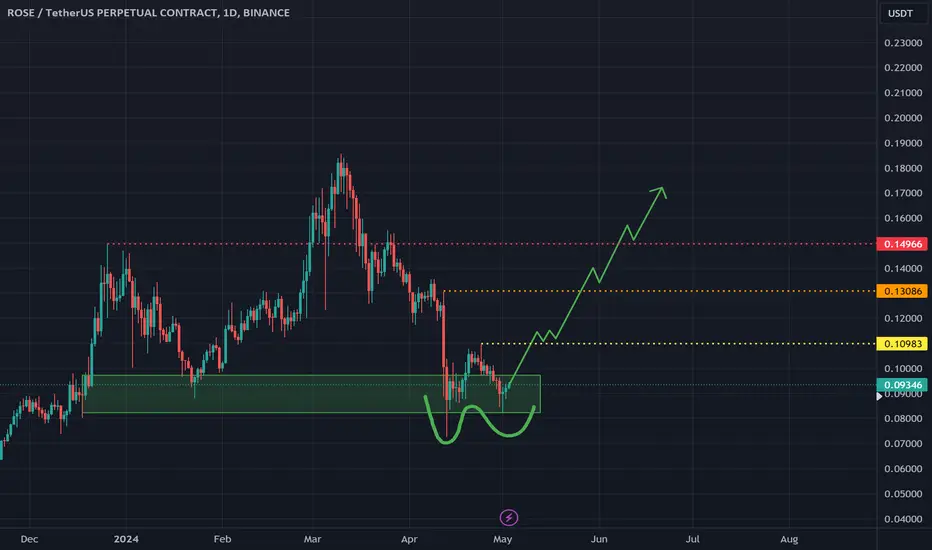
ROSE 1D Double bottom formingGreen box OB has held well
Double bottom forming
possible reversal toward the upside
Targeting key resistance levels marked out as yellow, orange and red dotted lines.
ROSE, Where are you going?Hello, guys.
This is ESS team.
Let's check the ROSE chart.
:::::::::::::::::
This is ROSEUSDT's 1H chart.
Now, ROSE is showing a falling Price Action while lowering the recent highs and lows.
If it breaks down the 4H's uptrend line or order block zone and is retested at these, You can expect candles make a new low.
If it is supported by 4H's uptrend line and rise up,
You can safely enter a long position when It breaks through the GREEN downtrend line.
Have a nice trading!
