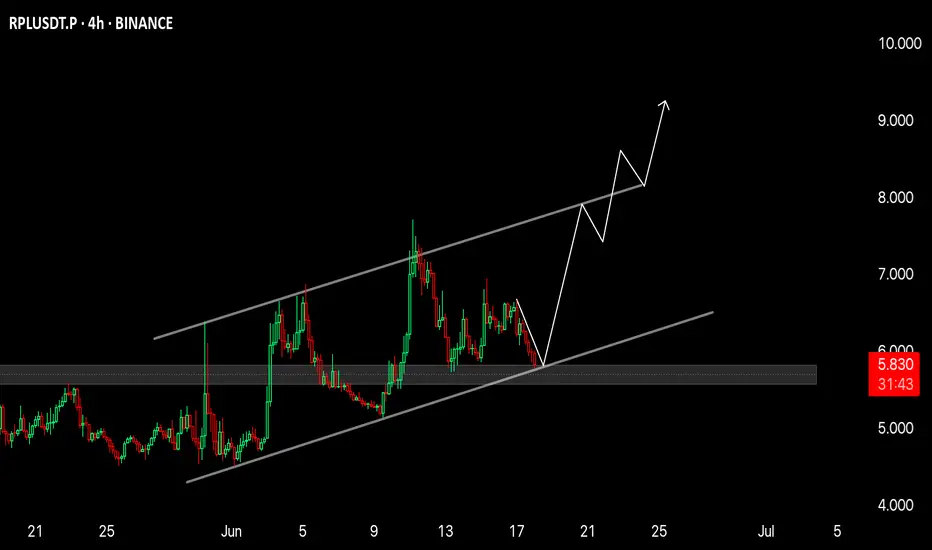
$RPL 4H AnalysisGETTEX:RPL 4H Analysis 🔥
RPL is currently trading at the lower boundary of a parallel ascending channel, which has acted as strong support multiple times in the past. The price action shows a clear higher high, higher low structure, indicating an ongoing uptrend.
Currently, the price is hovering a
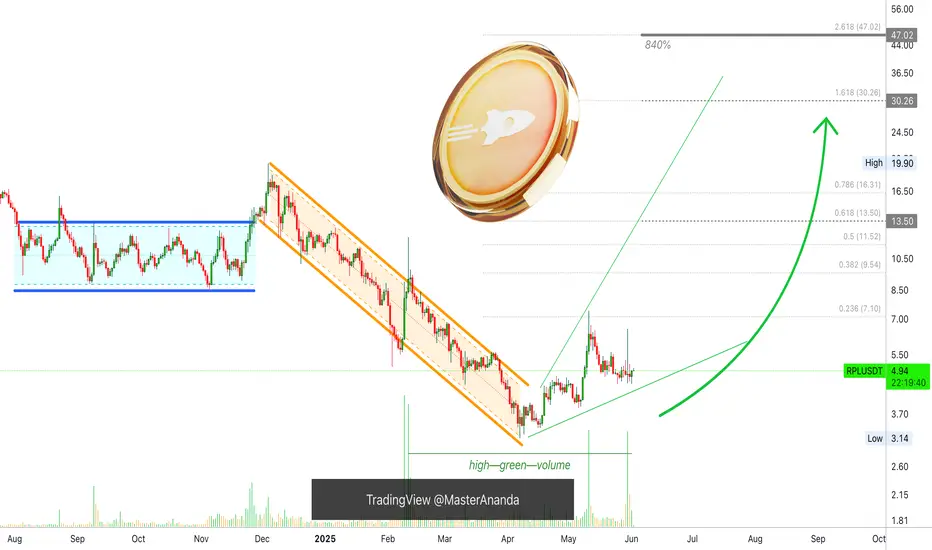
840% Rocket Pool—500% Potential Profits @$30 Conservative TargetI found a good chart setup. Rocket Pool peaked its initial bullish breakout 11-May and has been sideways for the past few weeks. The chart is showing that the retrace is over/complete.
The initial breakout, between 7-April and 11-May, produced a total of ~135% growth. This happened in a little over
$RPLUSDT broken out BINANCE:RPLUSDT has broken out! 🚀
Clean breakout from descending trendline triangle with volume.
Targeting $17.72 (+263%).
Retest zone: $4.60–$5.00
Momentum looks strong, don’t sleep on this move!
DYRO, NFA


RPLUSDT lucrative long opportunityRPLUSDT showing stong bullish momentum while others crypto asset didnt . this is the best point to jump on

Backtesting RPL Signal on Spot Trading by Rainbow MG3🔹 RPL is one of the signals generated from a TradingView watchlist, which sends alerts to Telegram.
🔹 After receiving the alerts, I used historical data to validate the indicator’s performance.
📈 Backtest Setup
✅ Pair: RPLUSDT (Spot)
✅ Timeframe 1: M15 (Entry)
✅ Timeframe 2: D1

RPLUSDT(RocketPool) Updated till 09-02-25RPLUSDT(RocketPool) Daily timeframe range. looks like PA build a recent support at 5.63. its better for holders if it stay above it. specially above price discovery level. below that is a void of course it can retrace when money comes.

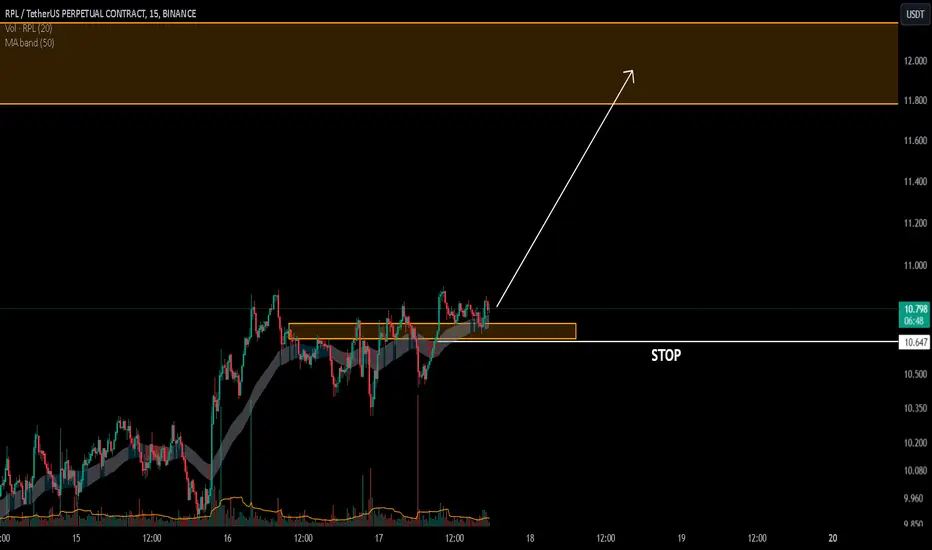
RPL/USDTKey Level Zone: 10.66 - 10.73
HMT v4.1 detected. The setup looks promising, supported by a previous upward/downward trend with increasing volume and momentum, presenting an excellent reward-to-risk opportunity.
HMT (High Momentum Trending):
HMT is based on trend, momentum, volume, and market struc
#RPL UPDATE 🌟#RPL Update 🌟
🛫 What an incredible journey it's been! 🛫
#RPL is on the verge of an exciting breakthrough! With strong support around $11.5 and an ambitious target of $19, we're witnessing impressive volume in this week's candle. If #RPL s to break above $19, we could be gearing up for a powerf

See all ideas
Summarizing what the indicators are suggesting.
Oscillators
Neutral
SellBuy
Strong sellStrong buy
Strong sellSellNeutralBuyStrong buy
Oscillators
Neutral
SellBuy
Strong sellStrong buy
Strong sellSellNeutralBuyStrong buy
Summary
Neutral
SellBuy
Strong sellStrong buy
Strong sellSellNeutralBuyStrong buy
Summary
Neutral
SellBuy
Strong sellStrong buy
Strong sellSellNeutralBuyStrong buy
Summary
Neutral
SellBuy
Strong sellStrong buy
Strong sellSellNeutralBuyStrong buy
Moving Averages
Neutral
SellBuy
Strong sellStrong buy
Strong sellSellNeutralBuyStrong buy
Moving Averages
Neutral
SellBuy
Strong sellStrong buy
Strong sellSellNeutralBuyStrong buy
Displays a symbol's price movements over previous years to identify recurring trends.