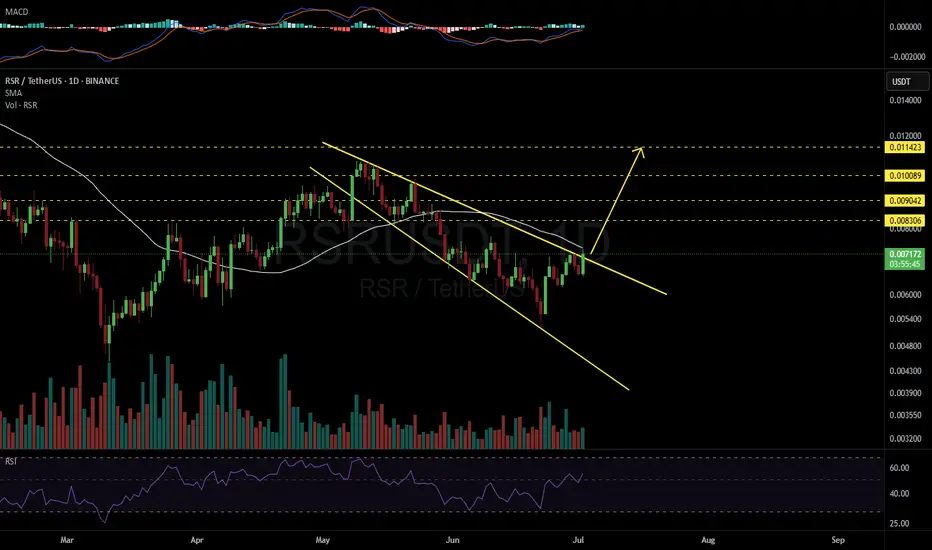
RSR/USDT Breakout Play – Approaching a Major Reversal
🧠 Full Technical Analysis (Timeframe: Daily)
RSR/USDT is at a crucial decision point after months of consolidation.
The price action has been forming a classic Descending Triangle pattern, a structure that often precedes major breakouts or breakdowns. As we approach the apex of the triangle, RSR
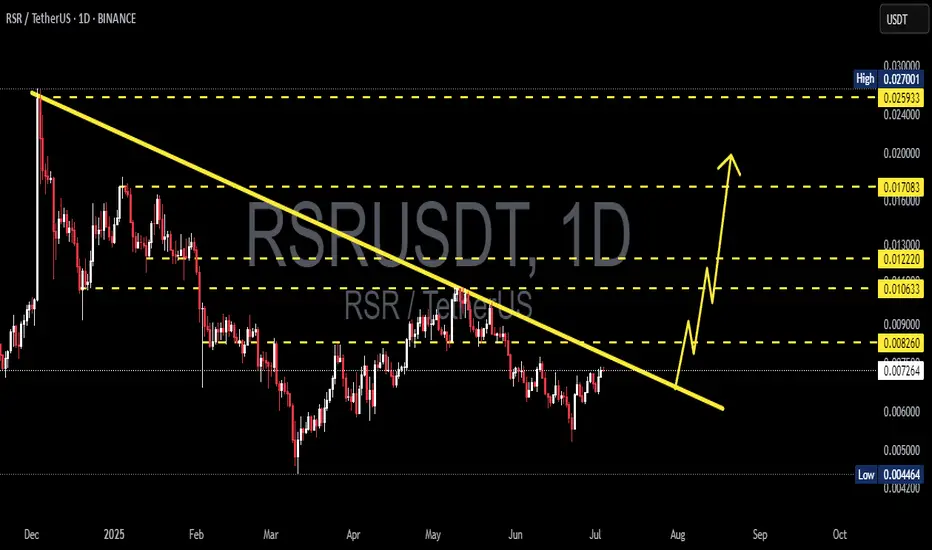
RSRUSDT 1D#RSR has broken above the Descending Broadening Wedge resistance on the daily chart.
If a successful retest of the pattern and a breakout above the daily SMA50 occur, the targets are:
🎯 $0.008306
🎯 $0.009042
🎯 $0.010089
🎯 $0.011423
⚠️ As always, use a tight stop-loss and apply proper risk manageme
RSR/USDT📊 RSR/USDT Trade Outlook
🟩 Bullish Window:
We're entering a potential bullish range during this period, based on Gann time cycle analysis.
📅 Key Dates to Watch:
🔸 June 1
🔸 June 2
🔸 June 5
🔸 June 9
These dates are likely to act as turning points or triggers for momentum shifts.
🔍 What to Watch:

RSR 1H chartThis chart features RSR on a 1-hour timeframe with a 50-period SMA, RSI(14), and trend lines. Created for technical analysis and personal reference. Shared for transferring to another account.

RSRThings are looking really bullish for RSR.with a lot buy volume coming with being added to Coinbase this will be a sleeper.
RSR Bearish Head and Shoulders Pattern Confirmed🚨 SEED_DONKEYDAN_MARKET_CAP:RSR Bearish Head and Shoulders Pattern Confirmed 🚨
SEED_DONKEYDAN_MARKET_CAP:RSR has formed a bearish head and shoulders pattern and has already broken below the purple neckline. This indicates a potential for further downside movement. However, if the price breaks o
RSRI Think RSR will be a great performer this cycle,one of the few that's back at its back out area once we work out of here onward!

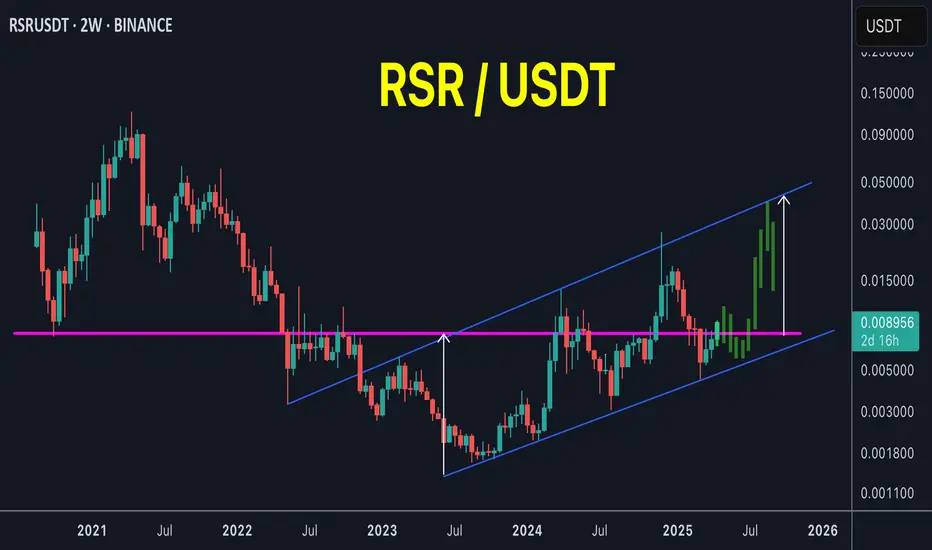
RSR possible playout in coming weeksRSR / USDT
It looks like it’s bottoming out
RSR is trying to breakout multi resistant levels on HTF
Lower trend line is acting as main support and must hold to keep its bullish sentiment
EYE ON IT
RSR Ready to big moveas you can see after he the bottom of trendline its towards to upper line and it's a big chance to break it and jump to so far

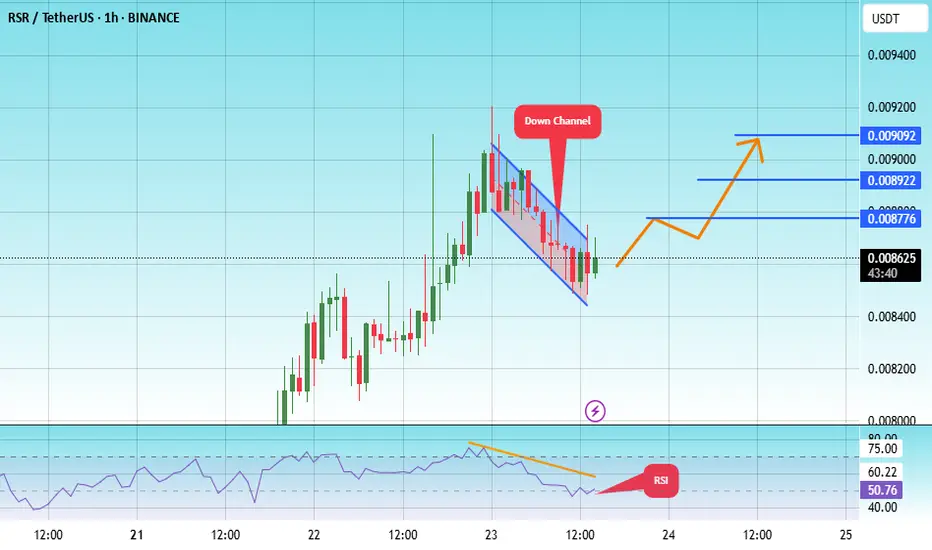
#RSR/USDT#RSR
The price is moving within a descending channel on the 1-hour frame, adhering well to it, and is on its way to breaking it strongly upwards and retesting it.
We are seeing a bounce from the lower boundary of the descending channel. This support is at 0.008441.
We have a downtrend on the RSI i
See all ideas
Summarizing what the indicators are suggesting.
Oscillators
Neutral
SellBuy
Strong sellStrong buy
Strong sellSellNeutralBuyStrong buy
Oscillators
Neutral
SellBuy
Strong sellStrong buy
Strong sellSellNeutralBuyStrong buy
Summary
Neutral
SellBuy
Strong sellStrong buy
Strong sellSellNeutralBuyStrong buy
Summary
Neutral
SellBuy
Strong sellStrong buy
Strong sellSellNeutralBuyStrong buy
Summary
Neutral
SellBuy
Strong sellStrong buy
Strong sellSellNeutralBuyStrong buy
Moving Averages
Neutral
SellBuy
Strong sellStrong buy
Strong sellSellNeutralBuyStrong buy
Moving Averages
Neutral
SellBuy
Strong sellStrong buy
Strong sellSellNeutralBuyStrong buy
Displays a symbol's price movements over previous years to identify recurring trends.