RSRUSDTHello Crypto Lovers,
Mars Signals team wishes you high profits.
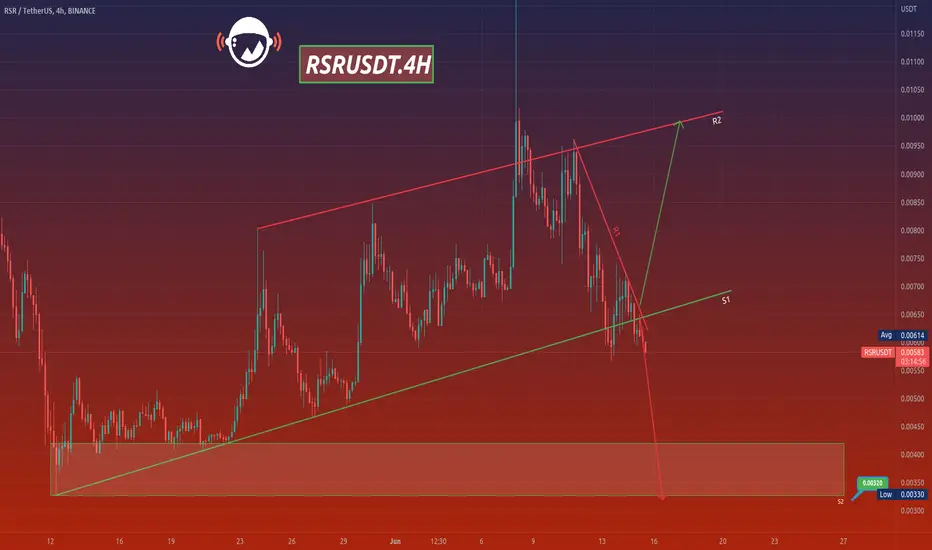
This is a 4-hour-time frame analysis for RSRUSDT
In our chart, R1 is a long-term resistance line and expresses the disability of the price to rise even though it had a failure in break. Then we have S1 as our long-term support line and shows the well support of the price at several points. Also R1 is another resistance line in our chart that represents the unsuccessful attempts of the price to rise. Now the price is fluctuating below S1 and we expect it to rise over this line and fluctuates in the channel and then continue its rising trend toward R2. Even it is possible for the price to lose the support and have a decline at this point toward S2.
Warning: This is just a suggestion and we do not guarantee profits. We advise you to analyze the chart before opening any positions.
Wish you luck
RSRUSDT trade ideas
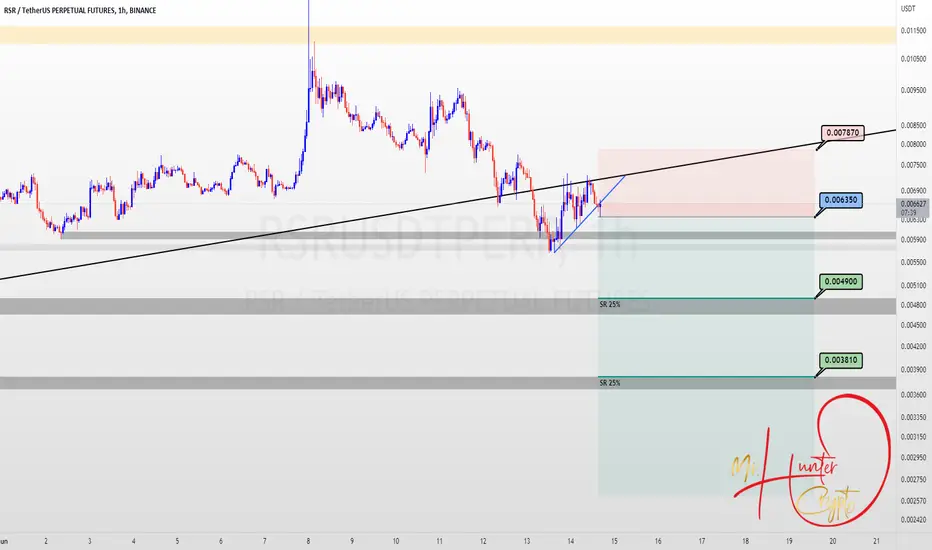
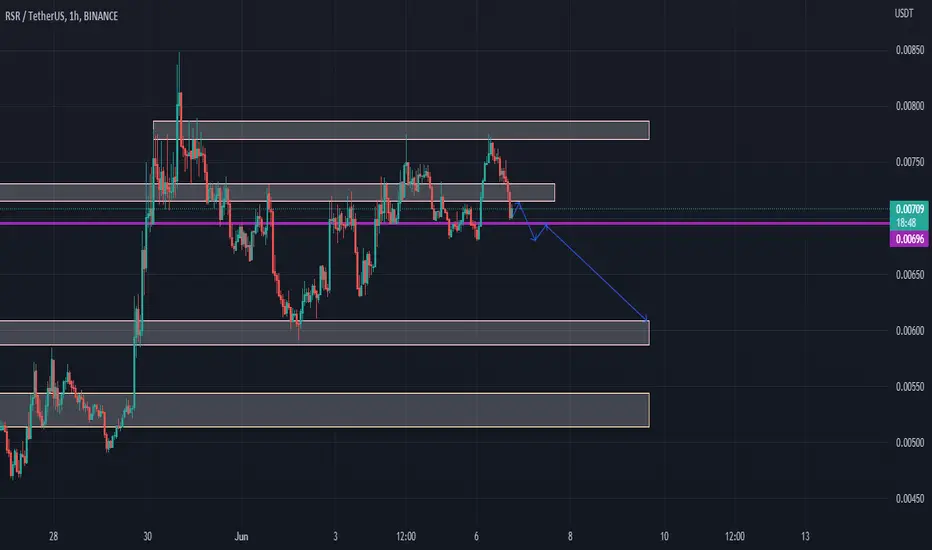
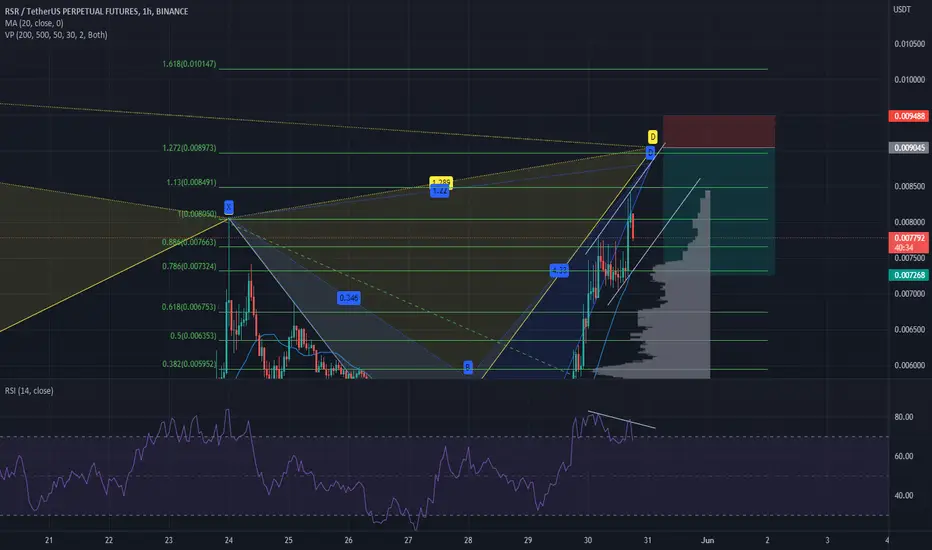
RSRUSDTPERPDue to the failure of the trendline in the 4-hour timeframe and the pullback to it and the creation of an ascending triangle pattern in the 1-hour timeframe, the price of this currency is likely to fall.
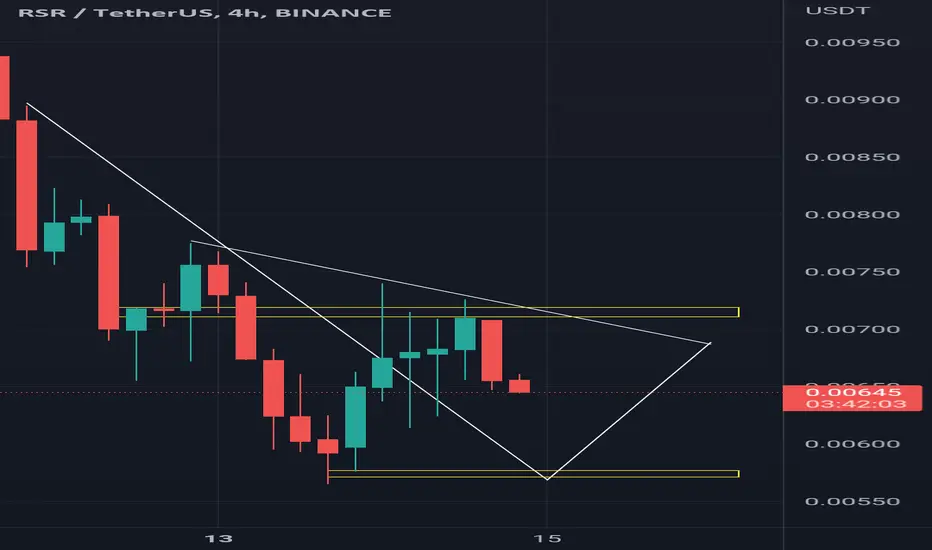
RSRUSDTDue to the declining situation of the market and bitcoin, with the failure of this supportive position, I will be selling in this currency.

Time to send RSR Back to Oblivion where it belongs.Everything that has a beginning has an end and unfortunately for rsr.......

RSRUSDTDue to the approach of the price of this currency to the daily time frame resistance, if we see a weakness in the price trend, we will be ready to sell the position.
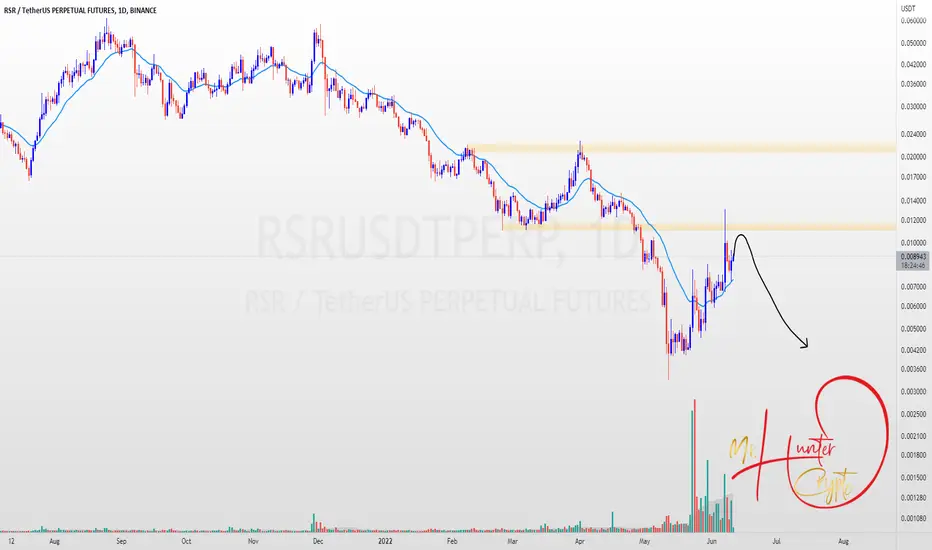

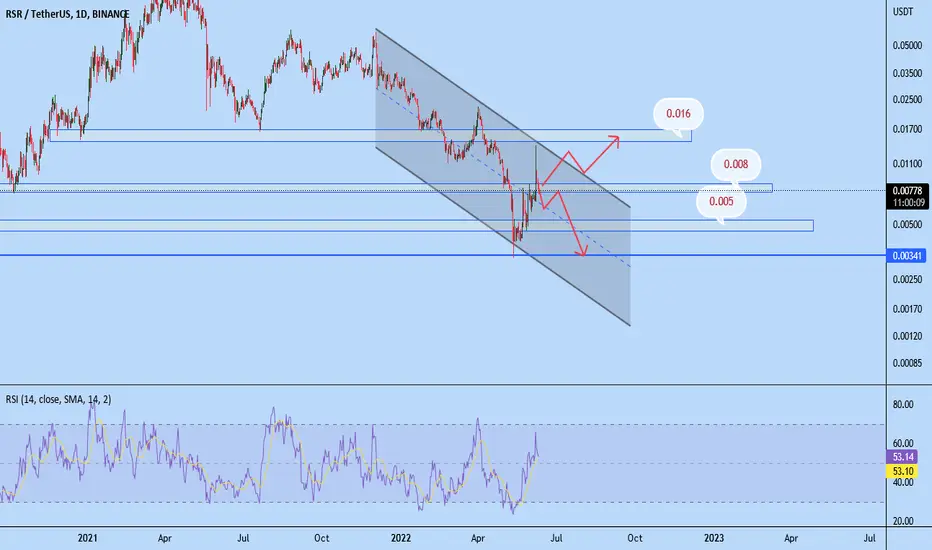
RSR/USDTRSR / USDT
Located in a descending channel.
Level 0.008 is a very important level.
If this level is supported, the price can increase up to 0.016, otherwise the level of 0.003 is available.
#RSR #RSRUSDT #BTC #BTCUSD #LUNA #LUNC #UST

RSRHello everyone. As the context of market is bearish then I can claim that trend of RSR tends to drop deeply and I personally set alarm for taking short position.
Have a profitable day
Mike Mardani ;)
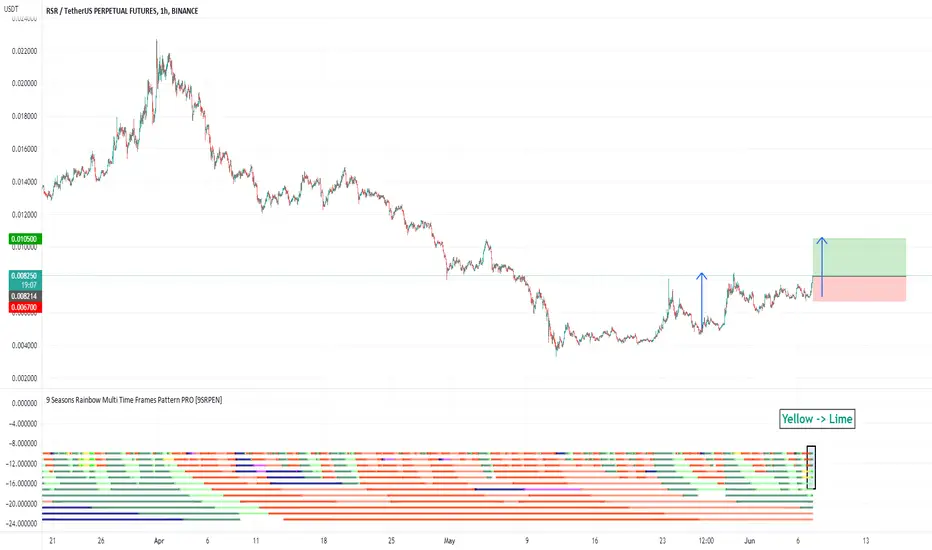
RSR Reserve Rights LONG TRADE 20220607Signal: Yellow -> Lime, Structure breakout
Risk Reward: 1.5
RSR, Reserve Rights, RSRUSD, RSRUSDT,RSRUSDTP, CRYPTO, CRYPTOCURRENCY
DISCLAIMER
This is only a personal opinion and does NOT serve as investing NOR trading advice.
Please make your own decisions and be responsible for your own investing and trading Activities.
short to mid term RSR prediction !Hello everybody
After hitting 2 short term targets of 50%+ , I feel confident that we could have another spike of 50%-100%. Price action bouncing of ema 20 zone successfully and most importantly selling volume while correcting is quite low. Which could mean that this coin is severely underpriced. Once the hype starts this beast may be unstoppable.
One possible setup
buy entry 0.0065-0.0075
possible targets 0.010-0.012(yes this is huge!)
sell under 0.000495

📊 RSR with the 15% pump. Overbought signals !Hello, dear TradingView members.
This idea is an RSR analysis.
RSR is moving up and had a 15% pump just now.
Since the price moved above the upper Bollinger Band, it might show overbought signals and cause sideway moves until the market gets enough strength for more pumps.
Scenario one:
A breakout:
The price will get more support and then pump to the higher resistance levels.
Scenario two:
the price will get rejected by the upper Bollinger Band and resistance #2 and then fall off to the support levels.
The Bollinger Bands are vast, meaning the price will get rejected or cause more psychological pumps.
Let me know if you guys have any questions;
I will be more than happy to help.
Good luck, and thank you.

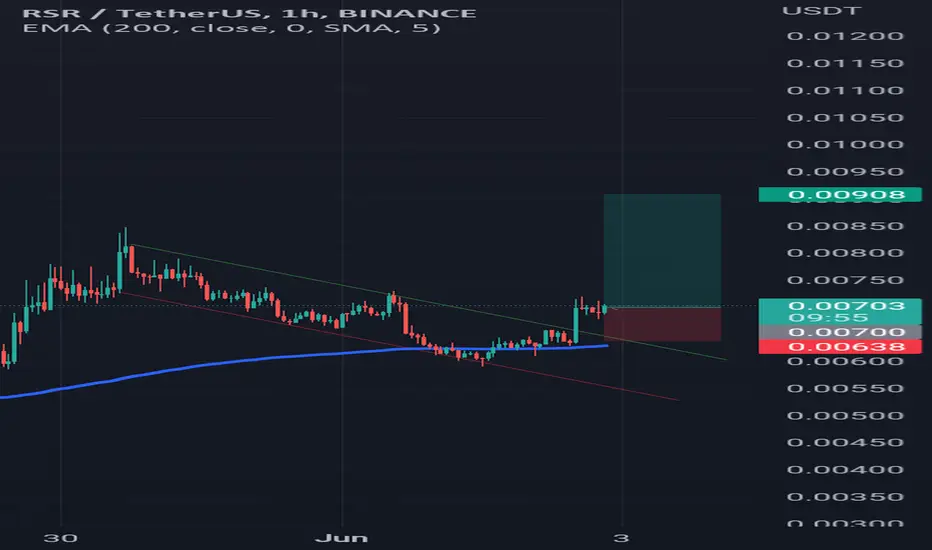
#RSR/USDT 1HR CHART UPDATE !!Hello, community members welcome to another RSR/USDT chart update.
If you find this update helpful, shoot the like button follow and share your views in the comment section.
As we can see in the above-mentioned chart that RSR/USDT broke the triangle pattern and currently trading above the green retest zone.
Here RSR/USDT looks promising, so we can long at :
ENTRY: CMP AND ADD MORE TILL $0.0073.50
TARGET : 15% TO 20%
LEVERAGE : USE LEVERAGE 5X - 10X
STOP LOSS : $0.006930
NOTE: This is not financial advice. This is for education purposes only. I am not responsible for the profits or losses you generate from your investments.
DO YOUR RESEARCH BEFORE MAKING ANY TRADES.
Thank you.

first mystical prediction any 12 year old with a smartphone could have come to this conclusion. just out of curiosity - i wonder what will happen now?


#RSRUSDT#RSR LONG
Lev20x
Entries: 0.00680
Target: 0.00720 - 0.00740 - 0.00758 - 0.00770
Extratp: 0.00786
Swing: 0.00810
Moon: 0.00830
Sl: 0.00639

RSR could hit the bottom againThis chart is based btc movement after btc fail to breakout important resistance

RSR
As you can see RSR is going to drop . well i think its good time for taking short position. i also showed my entry price . if you want you an follow my analysis.
Mike Mardani

Long on RSRits a great Wednesday to see what RSR has in stock for us,
Bitcoin was in a bear but RSR doing the opposite..
it formed a bear hanging man candle which confirms a bullish candle stick...
An Entry was made and trade was taken....lets go get it...

Another Short Term setup RSR! Possible 50%+ So yesterday my short term post was successful so I decided to give it another shot at this. It is not easy to find setups during the market conditions as such. If it does not correct to at least 0.0055 and retest the triangle break point, just too dangerous to stay in the trade for short term day traders. For long term investors it is safe to buy and hold at current level!
Current daily Volume is 2x> market cap✅!
Possible safer buying spot 0.00520-0.00560
Possible profit range 0.007- 0.001
sell below 0.00495
If it succeeds again possible 50% profit.
