#RUNEUSDT 4H Chart
Price is still moving down after missing the 4h supply zone shortly. MACD is showing bearish weakness, RSI is oversold and EMAs are turning bearish. I expect price to keep moving down towards the daily demand zone at $1.18.
RUNEUSDT trade ideas
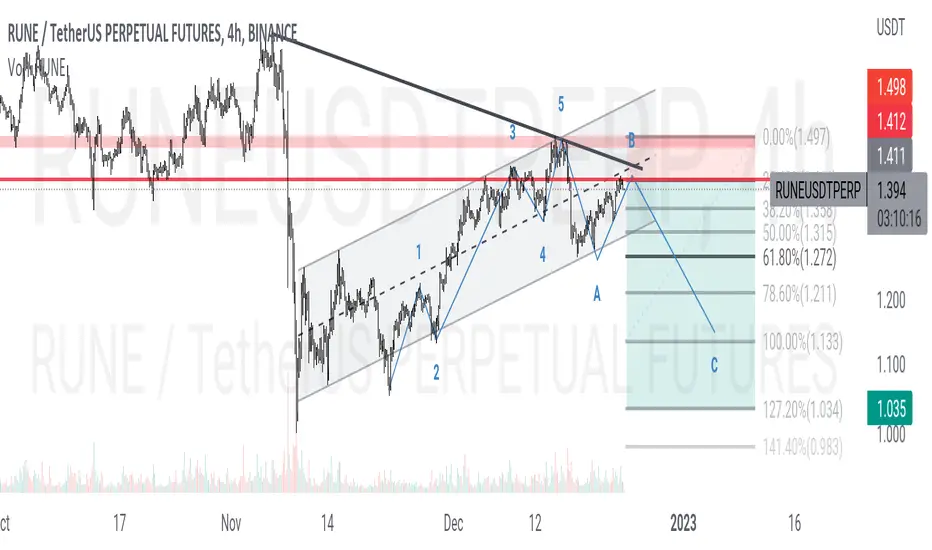
Rune will end wave 3 soonPrepare to short rune. you can play wave 4 and 5
"The risk is yours. manage it yourself"
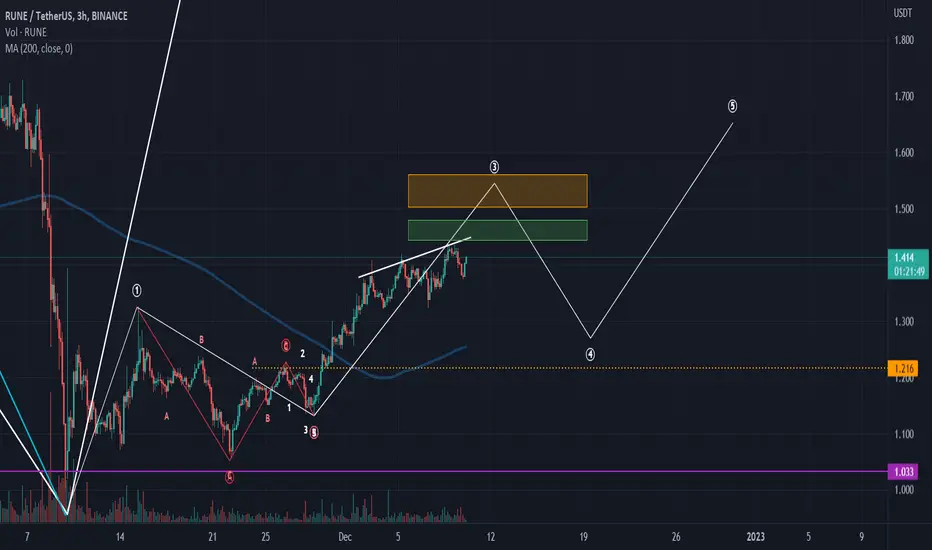
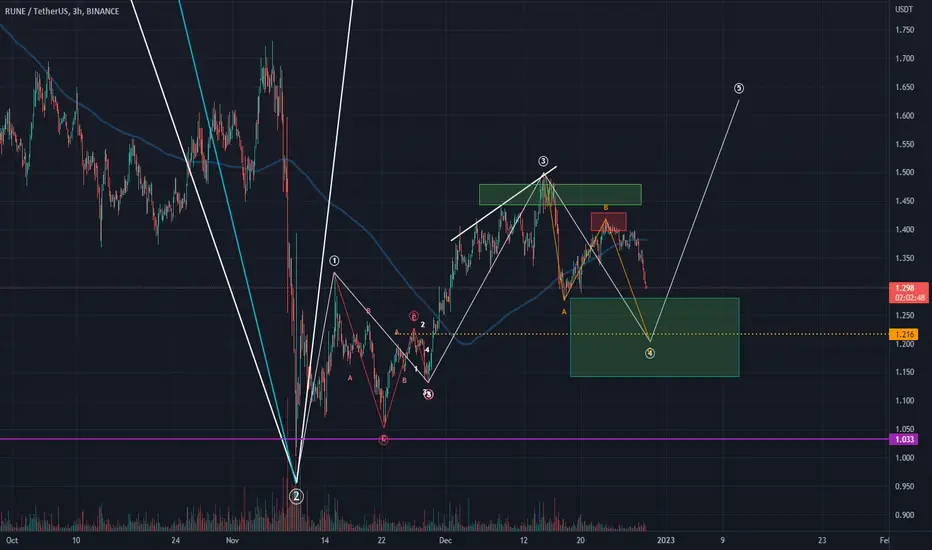
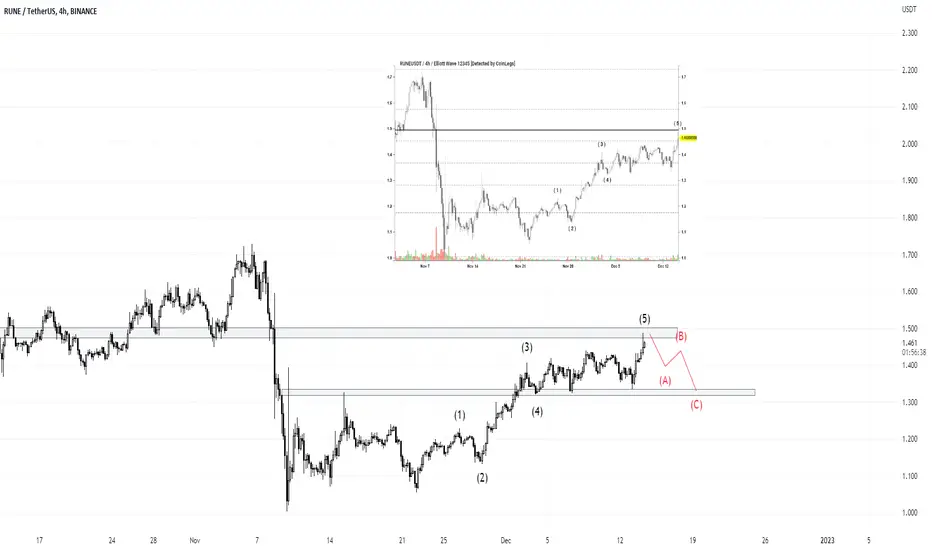
RuneI told you that "Rune will be end wave 3 and make wave 4 on next step" on 10 Dec in my idea and now rune will make wave 4 and wave 5 step by step
RUNE shortRUNE broke trough the ascending trendline. Asset broke trough the support level. Bearish movement to support level at 1.14 is possible.
RUNE On its way downRune has formed a bear flag on the daily chart. A downward break out of the flag and the nearby horizontal support would extend the descent of the Rune.
RUNEUSDT ABCDThe ABCD is a basic harmonic pattern. All other patterns derive from it. The pattern consists of 3 price swings. The lines AB and CD are called “legs”, while the line BC is referred to as a correction or a retracement. AB and CD tend to have approximately the same size.
A bullish ABCD pattern follows a downtrend and means that a reversal to the upside is likely. A bearish ABCD pattern is formed after an uptrend and signals a potential bearish reversal at a certain level. The rules for trading bullish and bearish ABCD patterns are the same, you will just need to take into account the direction of the pattern you trade and the movement of the market it predicts.
Likes and comments if you have questions! 🍌
Thanks!

Ichimoku Analysis for RUNEKumo bullish crossover happened, will wait for bullish tenkan/kijun crossover though for a good 20% Run.

RUNE: Approaching ResistanceTHORchain (RUNE) technical analysis:
Trade setup : Trends are mixed. Wait for price to 1) break above $1.50 resistance, with upside potential to $2.00, or 2) pull back near $1.00 support for swing entry.
Trend : Uptrend on Short-Term basis, Neutral on Medium-Term basis and Downtrend on Long-Term basis.
Momentum is Mixed as MACD Line is below MACD Signal Line (Bearish) but RSI ~ 50 (Neutral).
Support and Resistance : Nearest Support Zone is $1.00. The nearest Resistance Zone is $1.50 (previous support), then $2.50, and $3.00.

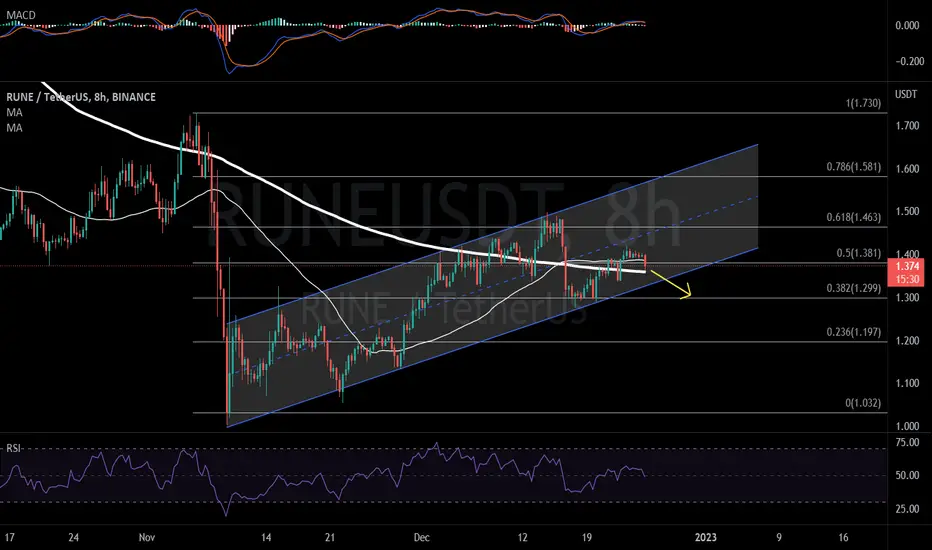
#RUNEUSDT 8HIf RUNE lose the 0.5 Fib level + MA200 then we go to $1.299
Mid term targets for this bearish flag: $1.197 and $1.032
Keep an eye on it and wait for confirmation.
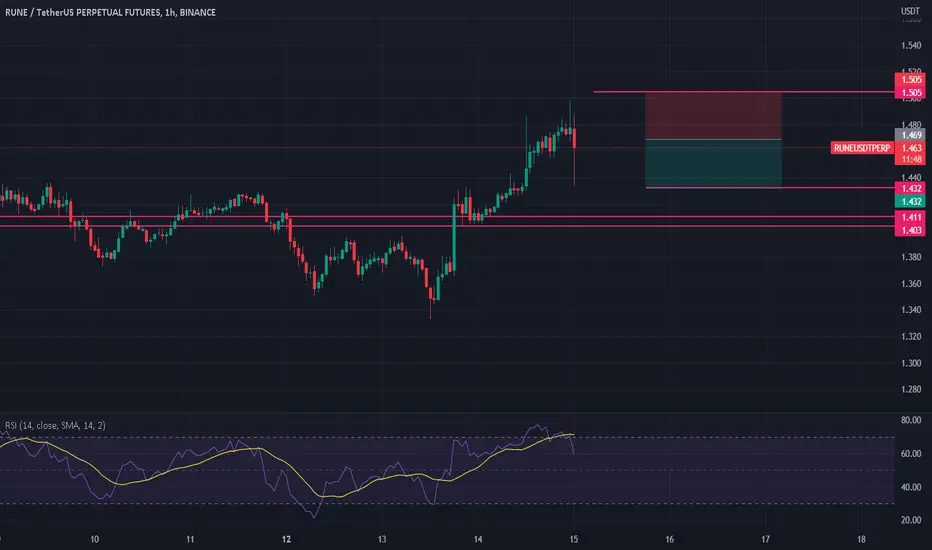
🔰#RUNE/USDT 🔴 SHORT SCALP 🔸 HighRisk🔰#RUNE/USDT
🔴 SHORT SCALP 🔸 HighRisk
🔘 Entry : 1.401 - 1.423 - 1.435 - 1.47 Mart
☑️ Take-Profit : 1.388 - 1.362 - 1.320 - 1.250 - 1.150
🏴☠ Stoploss: 1.5 4h Close Candle
✖️ Leverage 20x
💲 Margin: 2% Risk
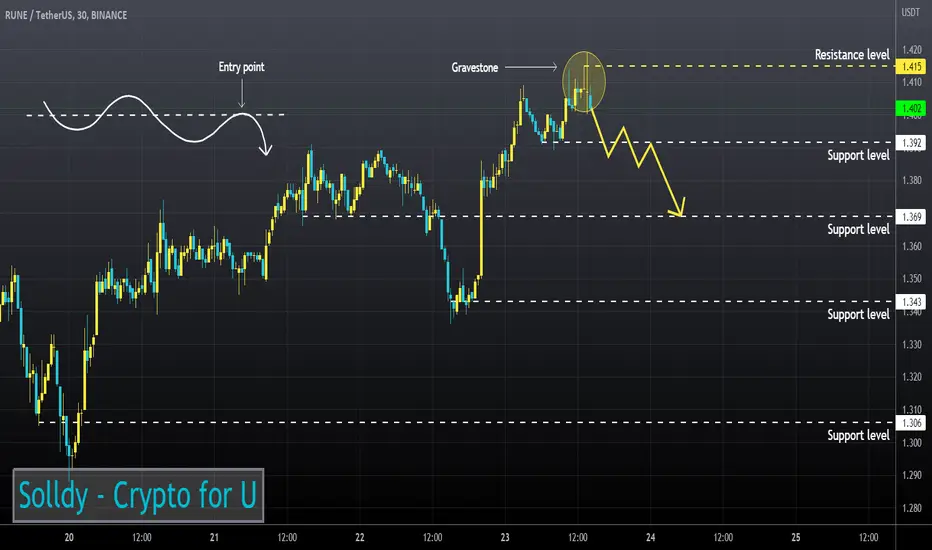
RUNEUSD ❕ gravestoneTrading volumes have declined, but RUNE continues to trade above liquidity.
On the 30m Timeframe the price and RSI chart are forming a bearish divergence and a gravestone has already been formed.
I expect a correction if the asset moves below the indicated support level.
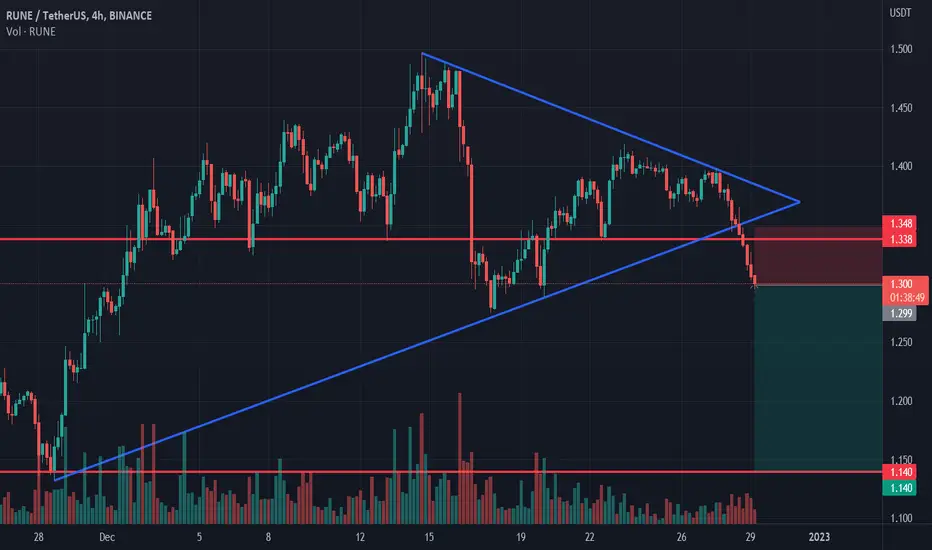
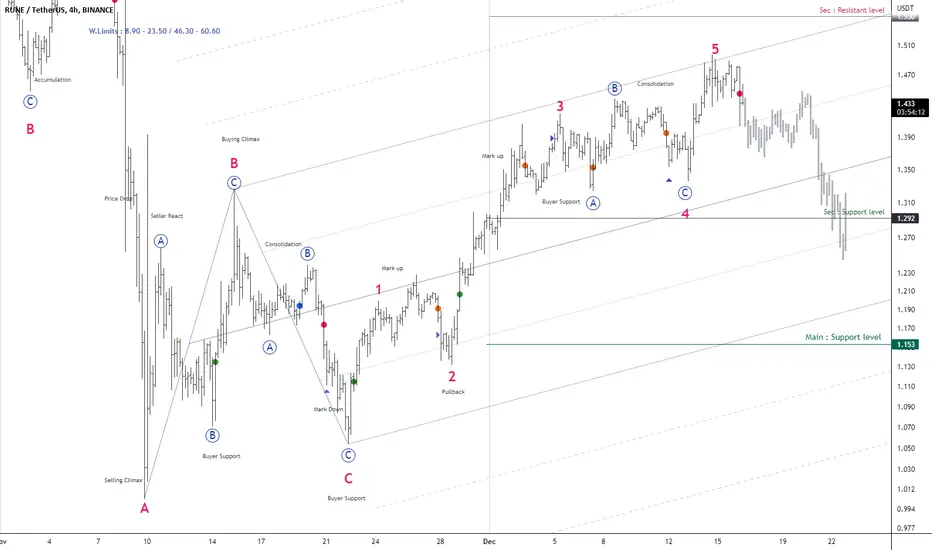
RLinda ! RUNEUSD-> Bulls break through resistance. What's next?RUNEUSDT shows the position of the bulls, who are trying to overcome the resistance of the bears. The price breaks through important resistance and moves into the long zone
On the chart we see the formed "descending wedge" pattern, a break of which resistance can activate quite a strong bullish impulse.
Now the price touches the resistance at 1.433 and is in the consolidation phase between 1.433 and 1.282.
I expect the formation of a local ascending triangle to the level of 1.433, breakthrough of which will send the price to 2.09 (medium-term target), and after that - to 3.04.
Regards, R. Linda!

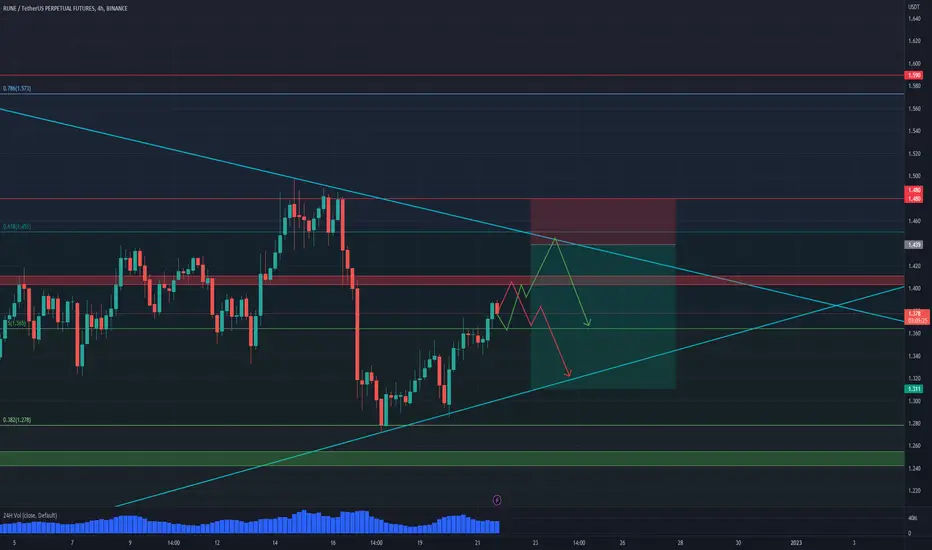
RUNE 21.12.22 (Short-Term)RUNE continues to move in the price range I expected. If it continues like this, it is likely to reach the price range of $1.44 - $1.45 , the upper level of the channel.
I'm thinking of making a short position from the area specified in the chart to the bottom of the channel. If the price comes to the $1.44 level, it should be watched carefully.
If there is a pump in BTC in terms of a possible liquidity cleanup, there is a possibility that RUNE will break the channel. Therefore, I will wait for the return indicator before opening a short.
What I write here serves as a note to myself. Does not include investment advice.
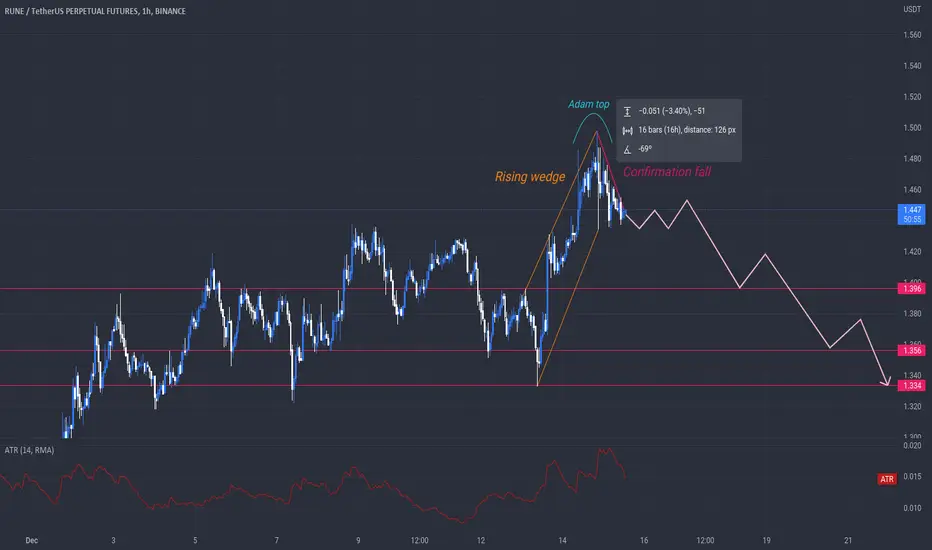
RUNE ready for a fall?RUNE has formed a rising wedge, after an adam top, what is expected now is falling rapidly, the market being kicked because of FOMC Rate Decision adds possibilities to position SHORTs.
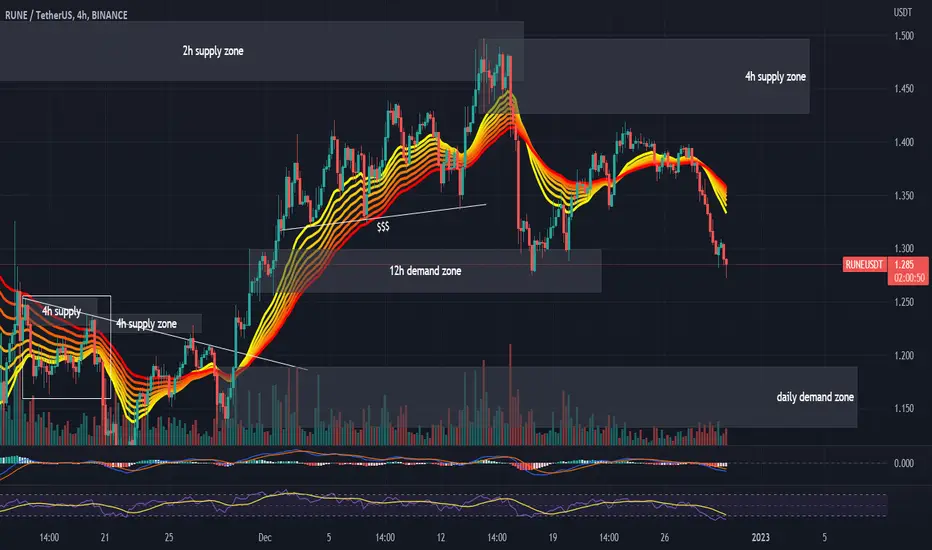
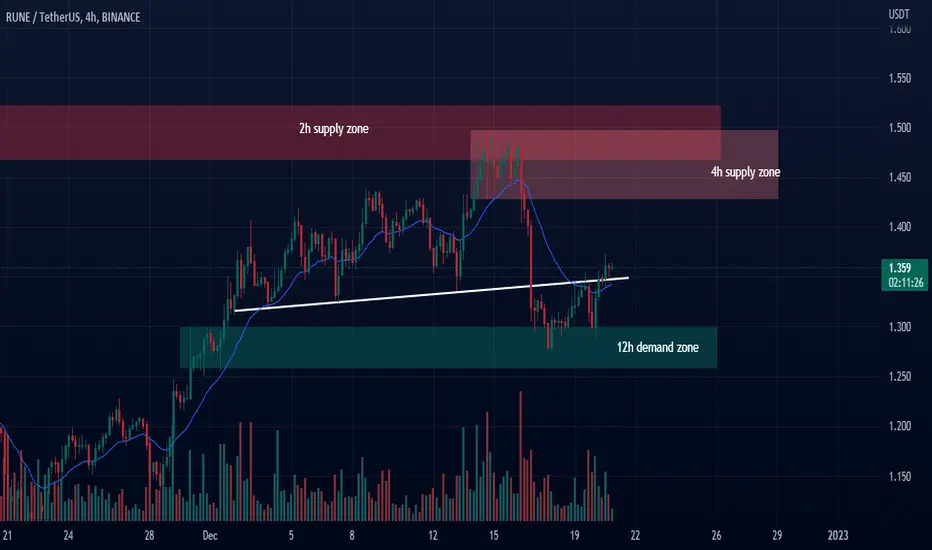
RUNE Technical analysisPrice tapped into a 12h demand zone from where it moved up from after liquidating the support line. I expect price to reach the 4h supply around $1.45 before potentially moving down again.
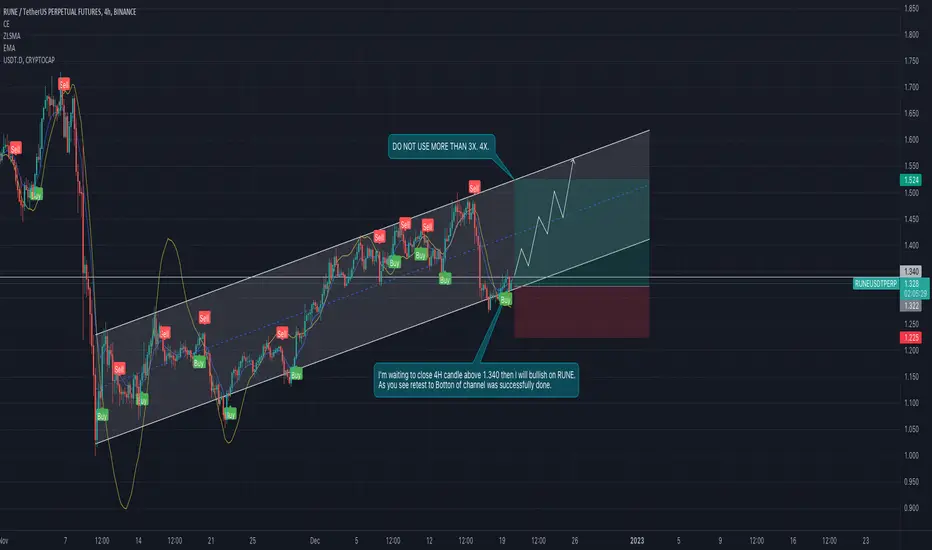
RUNE/USDT. I'm waiting to close 4H candle above 1.340 then I will bullish on BINANCE:RUNEUSDTPERP
As you see retest to Botton of channel was successfully done.
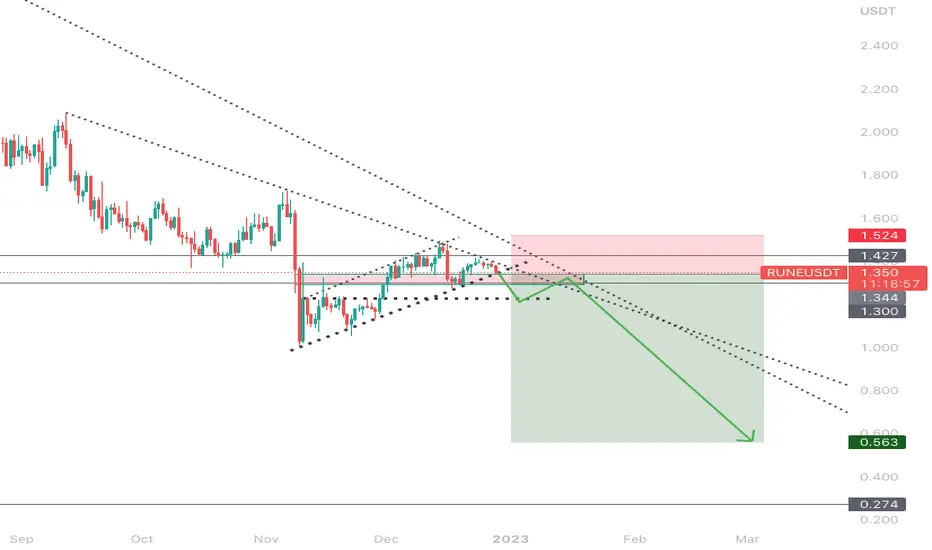
RUNEIdea: The price is trying to retest the resistance level within the ascending channel for the second time. Breakdown of the lower border of the pattern may be a signal to continue the global downtrend
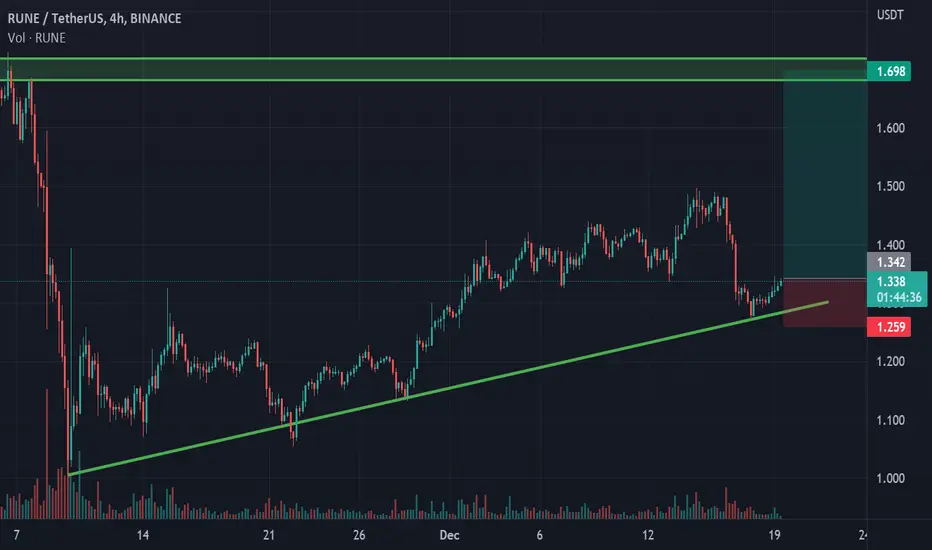
long RUNE$RUNE is bouncing off the bullish trendline. Bullish movement to the resistance level at 1.69$ is likely to happen.
Rune the end of Impulse wave Rune trade near the end of Impulse wave Break under 1.40 confirm this to start deep correction that target at least 1.210 close above 1.52 cancel this idea
RUNE touched the resistanceRUNE touched the resistance and Elliot wave formed. ABC correction move is possible
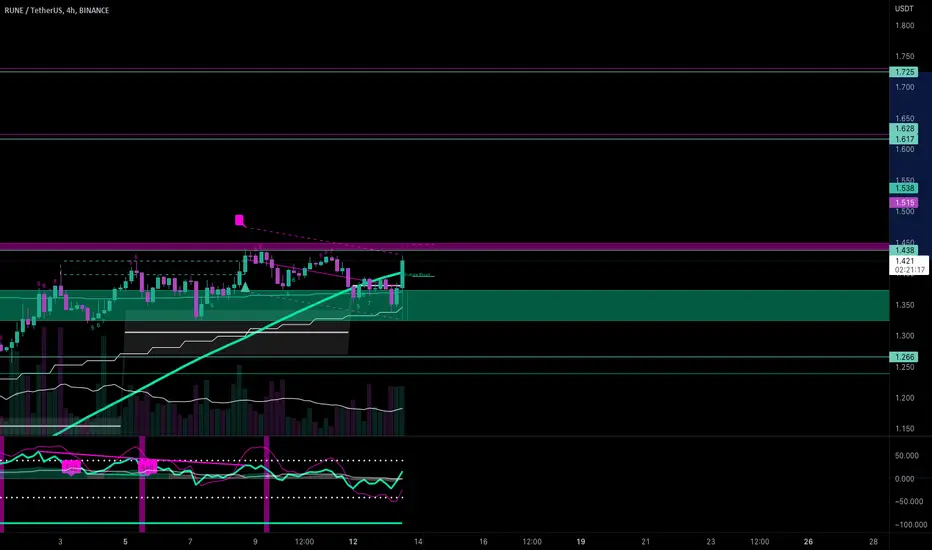
#RUNE/USDT - Long - Potential 21.35%#RUNE/USDT provided by the pro trader BlockParty SPOT|USDT
Strategy: Long
Exchange: Multi-Exchange
Account: Spot
Entry mode: Market order in range
Invest: 5%
Exit:
Target 3 : 1.725 22.25%
Target 2 : 1.617 14.6%
Target 1 : 1.438 1.91%
Entry: 1.365 ⌁ 1.422
Current market price: 1.419
Stop: 1.266 (-10.28%)
Technical indicators:
24h Volume: 5074936.3455
Satoshis: 1.411
Primed to pump from support following CPI data coming in bullish at 7.1% YOY
Trade: RUNEUSDT 13/12/2022 13:33
Account: SPOT
Volume last 24h: 5074936.35 USDT
Volume in buy range: 8147.63 USDT