M6A Looking for a ShortLooking on the short side given global economic conditions and Australia's first recession in a few decades.
AU1! trade ideas

AUSTRALIAN DOLLAR FUTURES (6A1!) Monthly, WeeklyDates in the future with the greatest probability for a price high or price low.
The Djinn Predictive Indicators are simple mathematical equations. Once an equation is given to Siri the algorithm provides the future price swing date. Djinn Indicators work on all charts, for any asset category and in all time frames. Occasionally a Djinn Predictive Indicator will miss its prediction date by one candlestick. If multiple Djinn prediction dates are missed and are plowed through by same color Henikin Ashi candles the asset is being "reset". The "reset" is complete when Henikin Ashi candles are back in sync with Djinn price high or low prediction dates.
One way the Djinn Indicator is used to enter and exit trades:
For best results trade in the direction of the trend.
The Linear Regression channel is used to determine trend direction. The Linear Regression is set at 2 -2 30.
When a green Henikin Ashi candle intersects with the linear regression upper deviation line (green line) and both indicators intersect with a Djinn prediction date a sell is triggered.
When a red Henikin Ashi candle intersects with the linear regression lower deviation line (red line) and both indicators intersect with a Djinn prediction date a buy is triggered.
This trading strategy works on daily, weekly and Monthly Djinn Predictive charts.
Trades made when the monthly and weekly arrows are pointing in the same direction are the most profitable.
This is not trading advice. Trade at your own risk.

E-Micro AUD/USD Futures LevelsHere are the levels I have for this future:
A. Light Blue: Weekly Levels (W)
B. Green: Daily Levels (D)
C. Purple: Monthly Levels and above (MO)
D. Orange: 3 day levels. (3D).
E. Red: (12 hour levels and below.)


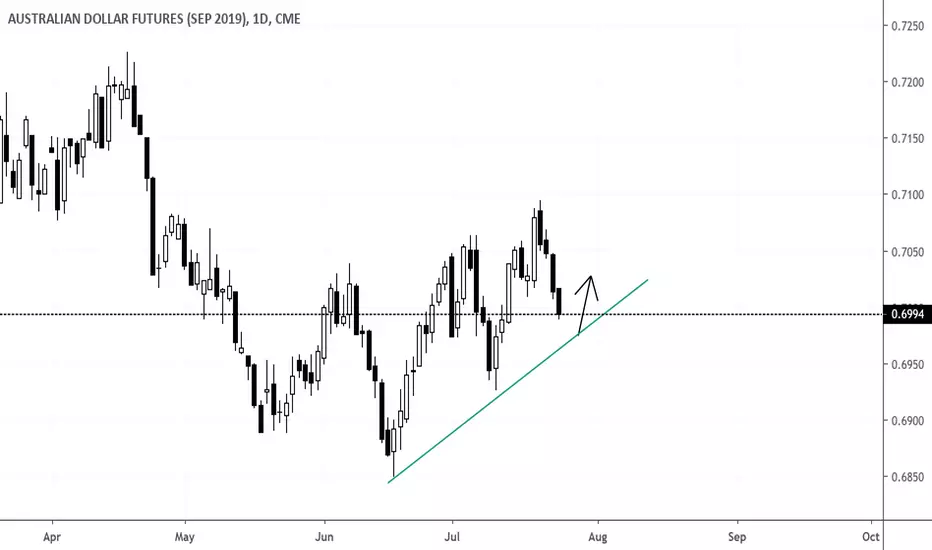
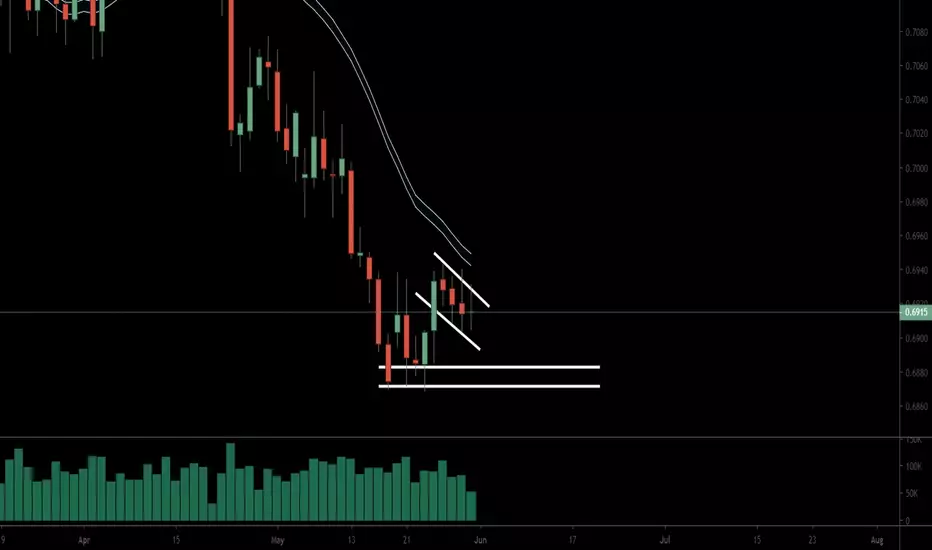
AUD futures possible inverse head and neck6A June looks like an inverse head and shoulders forming with the neckline nicely positioned. I would be watching for a break this week and I would be buying the retest of the most recent high prior to the breakout. It needs to break with some strength. I always watch for a fake break which might stitch up some bullishly biased traders. Target would be the highs reached earlier this week

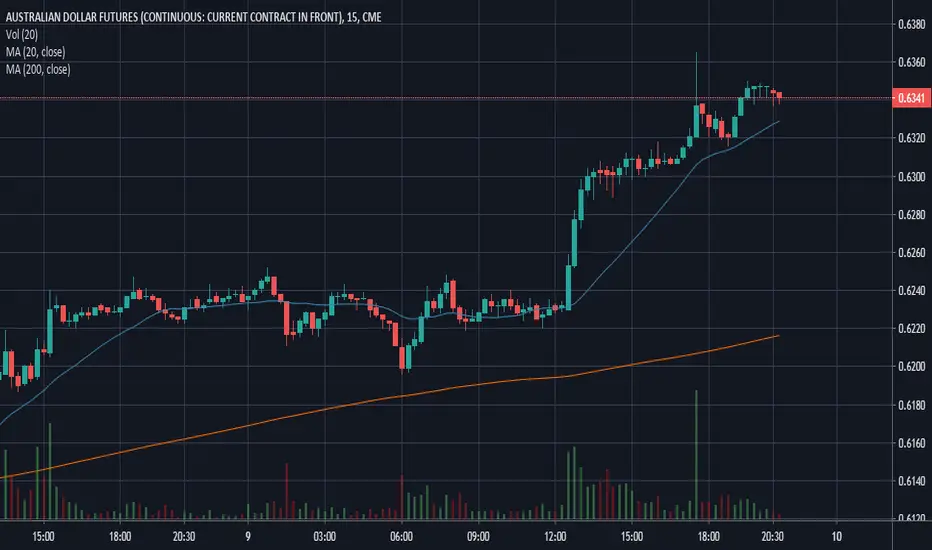
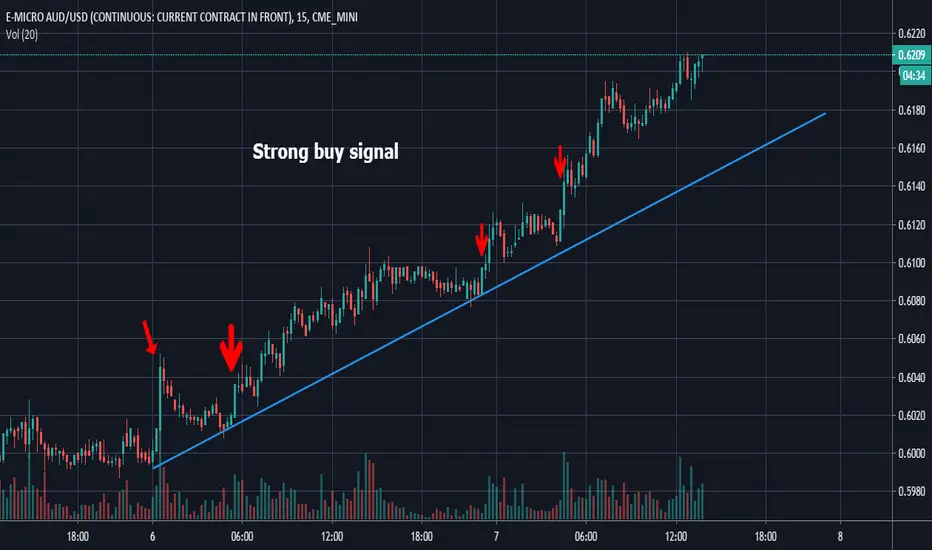
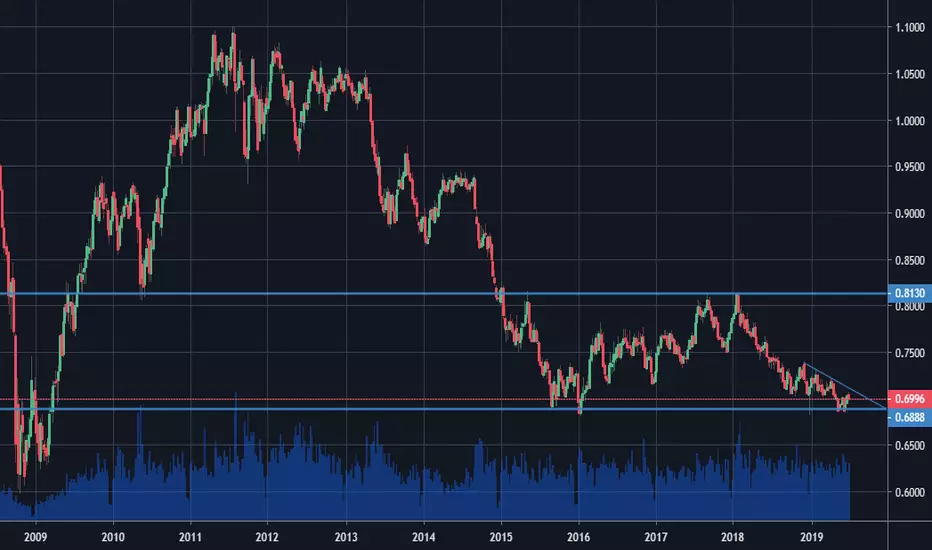
Chart pattern on AUD/USDBe careful, the pattern can fail, the resistance it's important. So you can work the double strategy.

will keep going upwill keep going up!
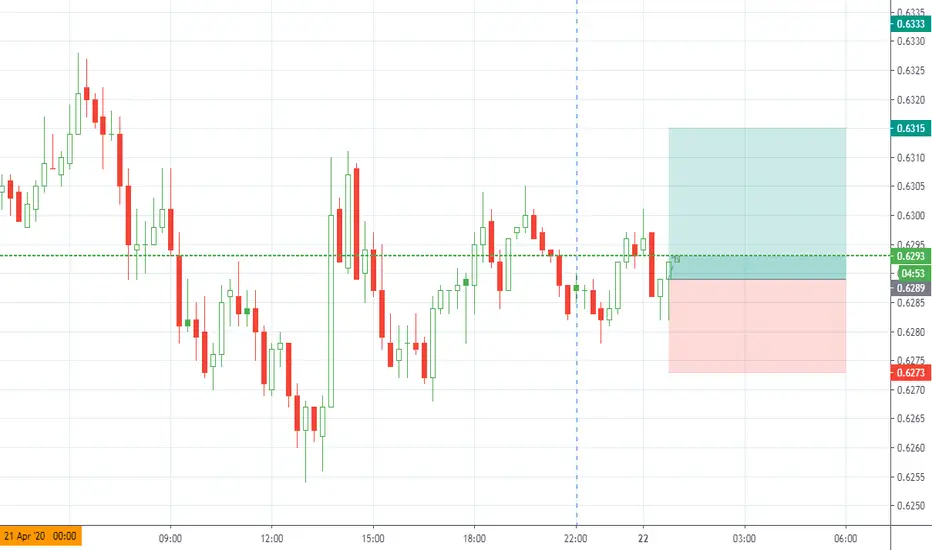
buyer stay buyer or take advantage and wait for another strong signal
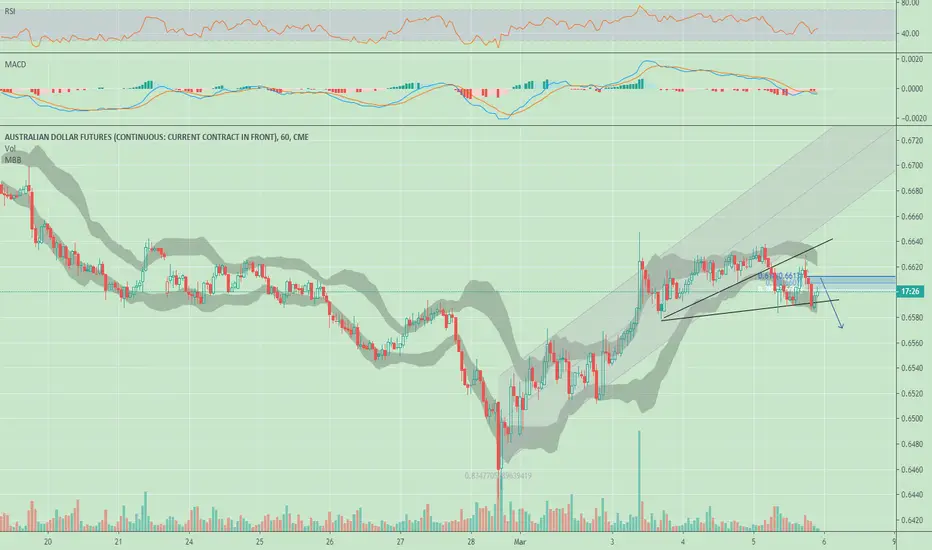
M6A shortShort M6A at 0.6633.
Stop/Loss: 0.6650
Target: 0.6139
Move S/L to break even at 0.6466.
Move S/L to 0.6466 at 0.6303.

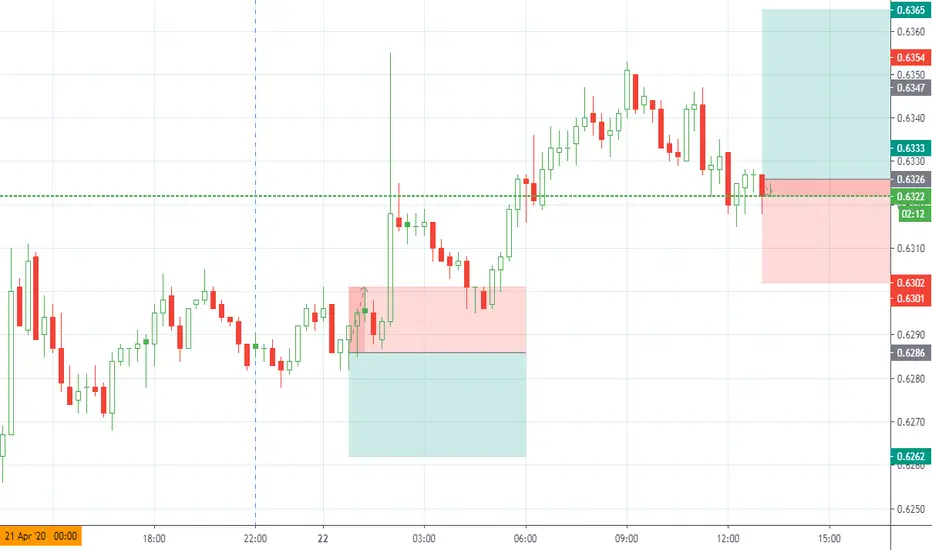
Aussie BuysHave been watching Aussie for a couple weeks waiting for it to return to my Moving Average Area I feel confident in buying as we seem to be holding that area well as of the moment, however if price breaks my blue rectangle area ill start to look for a tactical retreat ill keep you all updated as things change
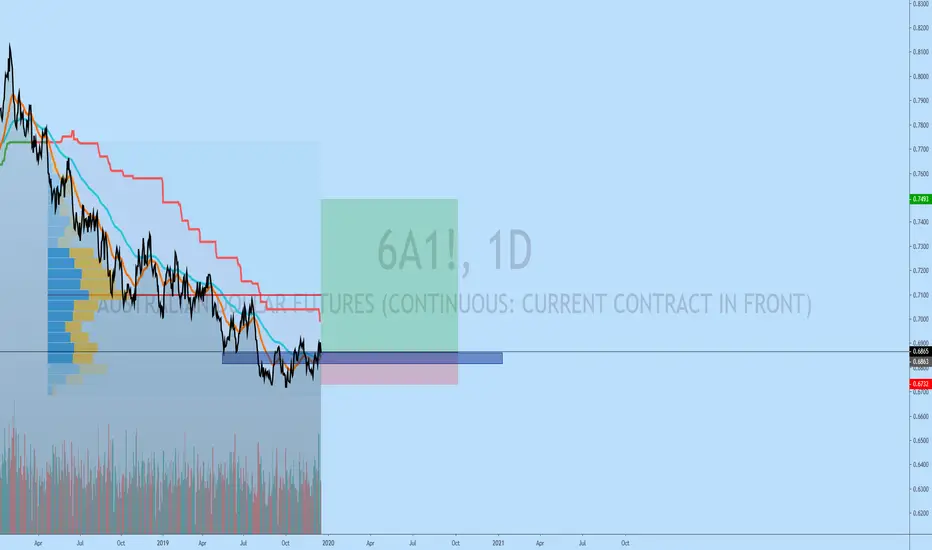

AUD/USD FUTURES. Double bottom.I think that everything is perfectly visible on the chart without any explanation. I would recommend to buy half anywhere between 0.68-0.7 and another half as soon as we break the downtrend on daily. SL near 0.67, TP 0.73-0.74. However, recent move on DXY might be a problem here cuz it's still in uptrend and looking very strong right now. so risk on ur own and don't forget to check DXY from time to time


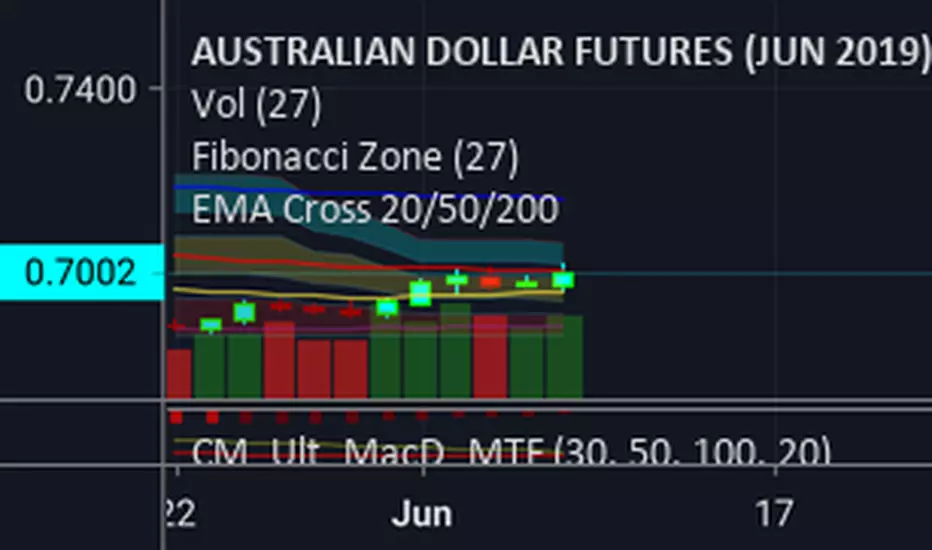
$Aud Aud has held strong despite the historical low interest rates from the recent .25 cut by the RBA. Unlike its fellow antipodean Nzd which took a major hit while risk sentiment was percieved to be much higher to investors last month.The past 2 months Gold is up 5.4% feeding the risk off sentiment and also iron ore contracts up 39% on the year helping the commodity currency keep stable. Daily there's a tight range of $.7010(50ema) - $.7020 (76.4%) that was rejected but held an engulfing candle above the prev daily high and the 61.8% retracement. Weekly price finished above the 23.6% retracement after a doji signaling continuation upwards. Should price break the weekly 20ema/32.8% ($.7070) then there is optimism for bulls to to test the 1D 200ema around $.7160. Note Business Confidence and Employment change i expect to be weaker later in the week so will keep you updated.

March Australian Dollar Head and Shoulders. AUD fell today after posting higher move last night for top of possible right shoulder. Nearing neckline at .7042. Tomorrow should show either a reversal or continued selling to neckline. Outside target for right shoulder height and fall if this does come due is S1 at .6953 and perhaps S2 at .6840. That would put it below a double bottom so not sure if would go that far.
