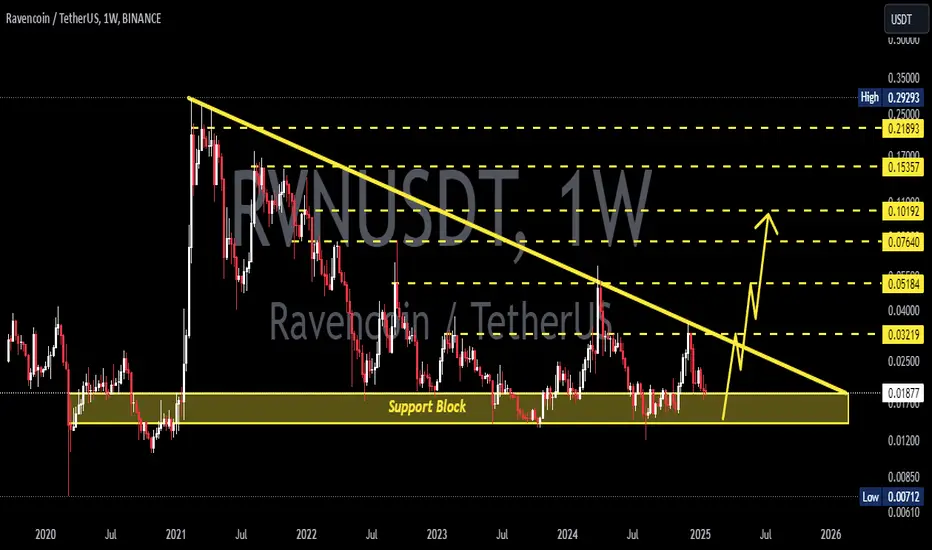
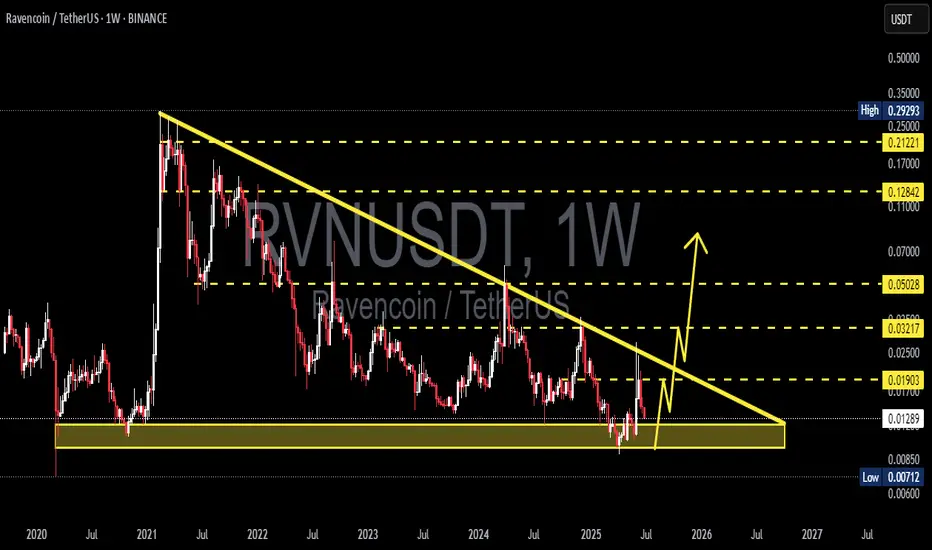
RVN/USDT — Descending Triangle: Breakout or Breakdown?Ravencoin (RVN) is now standing at one of its most critical levels since 2021. On the weekly chart, we clearly see a Descending Triangle pattern:
Lower Highs pressing the price down for years.
Strong demand zone around 0.00712 – 0.0130 USDT still holding as the last defense for buyers.
Price is now sitting right at the triangle’s apex, which means a major move is coming soon — either breakout or breakdown.
---
🔎 Technical Breakdown
Main pattern: Descending Triangle (statistically bearish, but positioned at strong demand).
Historical support: 0.00712 – 0.0130 (tested since 2021, sign of strong accumulation).
Descending trendline: rejected every rally since 2021, still intact.
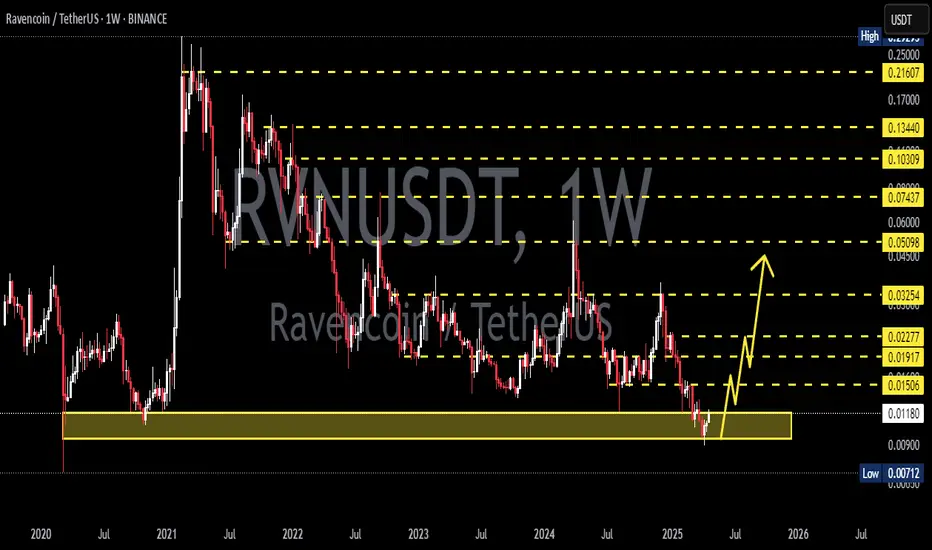
Key resistances ahead: 0.0190 → 0.0237 → 0.032 → 0.050 → 0.128.
Major high: 0.2929 (far above, but valid long-term target if structure flips bullish).
---
🟢 Bullish Scenario
Trigger: Weekly close above descending trendline + successful retest, or breakout above 0.0190 USDT.
Additional confirmation: Strong volume breakout + weekly RSI reclaiming 50 or showing bullish divergence.
Upside targets:
1. 0.0190 (first resistance)
2. 0.0237 (historical barrier)
3. 0.0322 (trend reversal confirmation)
4. 0.0503 (major breakout level)
If momentum holds → potential extension toward 0.128.
Takeaway: A clean breakout could mark the first long-term bullish trend reversal for RVN in years.
---
🔴 Bearish Scenario
Trigger: Weekly close below 0.00712 USDT with strong volume.
Consequence: Breakdown from multi-year support → “last fortress” of buyers destroyed.
Downside target:
Retest 0.0071 (historical low). If lost, RVN may enter deeper price discovery zones.
Invalidation of bearish case: Price reclaiming above 0.0190.
Takeaway: Losing this demand zone could trigger a strong continuation to the downside.
---
⚖️ Big Picture
RVN is at a make-or-break point:
Breakout above → long-term trend reversal and new bullish cycle.
Breakdown below → bearish continuation with risk of new lows.
This is not just a technical setup; it also reflects overall crypto market sentiment. Bitcoin’s next major move will heavily influence RVN.
---
🎯 Strategy
Conservative traders: Wait for weekly close confirmation (breakout or breakdown).
Aggressive traders: Consider entries inside the demand zone with tight stops below 0.0070.
Risk management: Crucial! Weekly setups often bring big moves.
---
📌 Conclusion
RVN/USDT is “squeezed” at the apex of a descending triangle right on a multi-year demand zone.
Bullish case: breakout → 0.019 → 0.023.
Bearish case: breakdown < 0.0071 → opens the door for new lows.
Whichever direction plays out, a major RVN move seems very close.
---
#RVN #Ravencoin #RVNUSDT #CryptoAnalysis #TechnicalAnalysis #DescendingTriangle #Altcoin #PriceAction #ChartPattern #CryptoTrading
RVNUSDT trade ideas
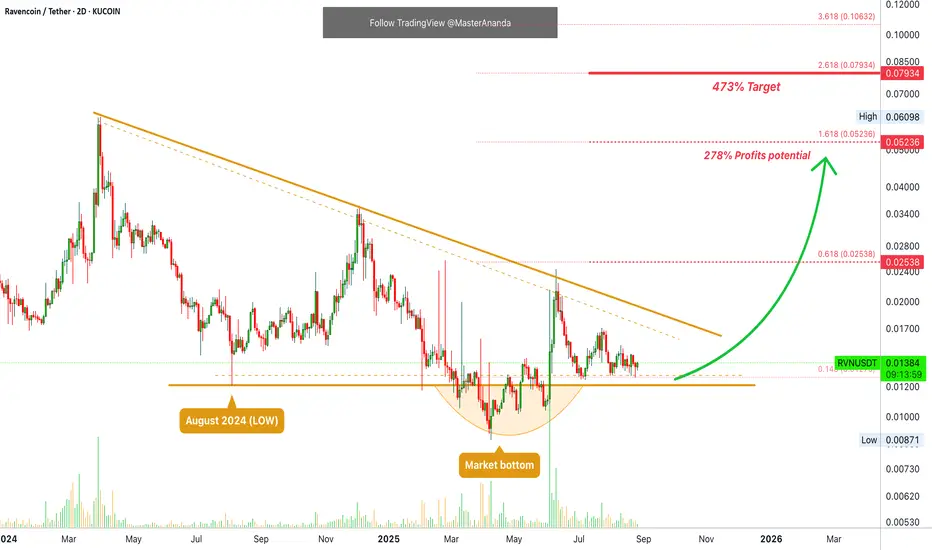
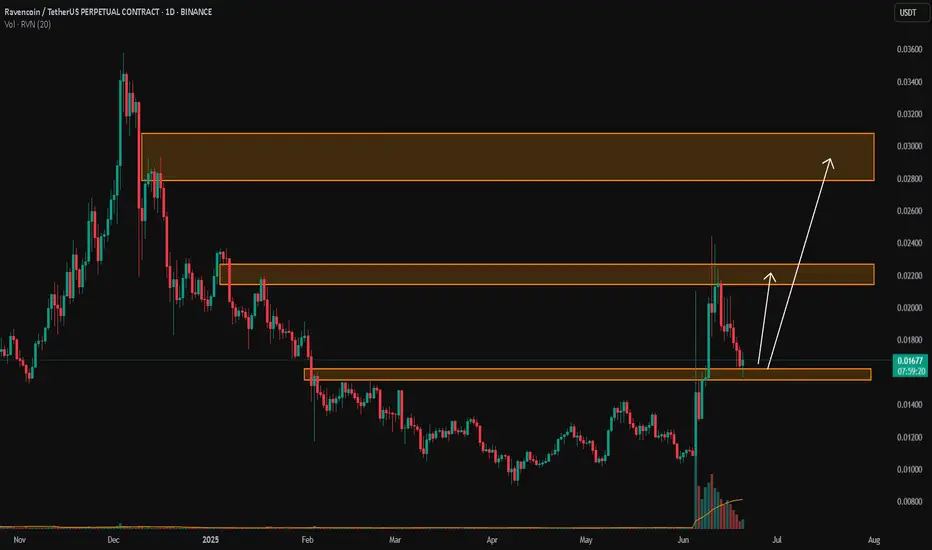
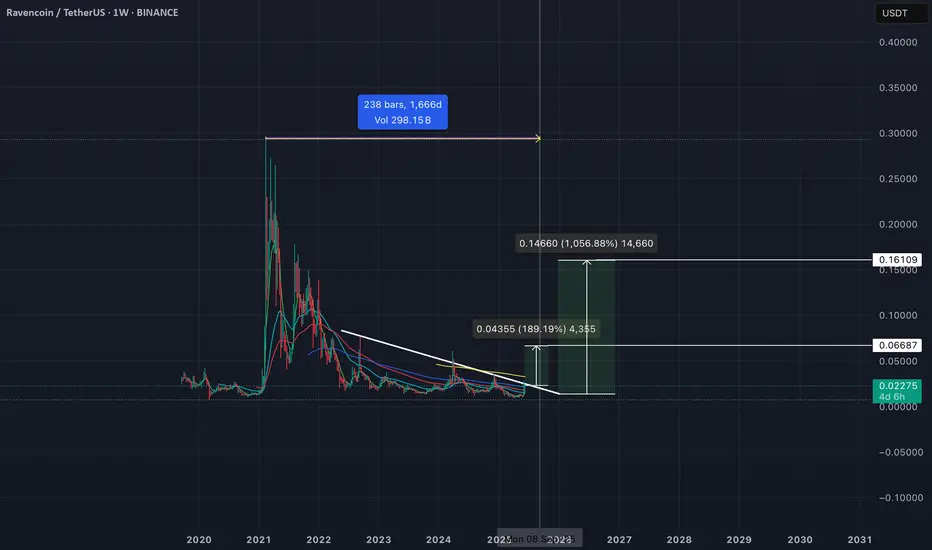
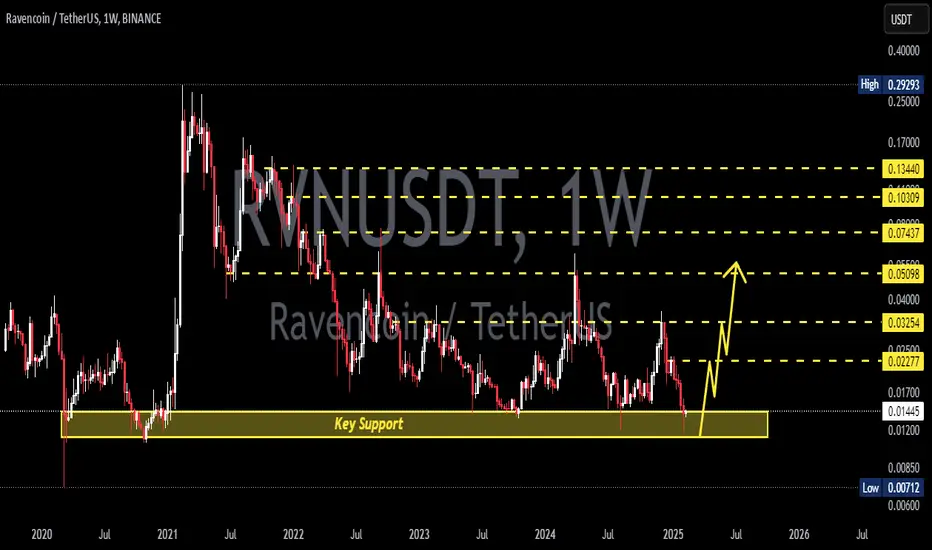
Ravencoin · Bullish Altcoins & Futures Trading Trade-NumbersRemember Ravencoin? At one point this project worked as a very strong signal and confirmation in support of our late 2025 altcoins market bull market thesis. The strong bullish jump and high volume in early June reveals a bottom, and a bottom reveals the end of a bearish period, and the end of a bearish period is followed by the inverse, a bullish cycle.
These pairs that move strongly in this way tend to perform strongly during the entire cycle. That is, RVNUSDT already produced a strong bullish breakout, which is nothing more than a whale purchase, and afterward went sideways.
People forget about it, excitement dies down and we move on to other things, hotter pairs let's say. After the consolidation is over, comes a new jump. This is the situation with RVNUSDT. I cannot make enough emphasis on another secure bet/chart setup/trade. This one will grow and we have proof already, the thing is that I think it is next in line. Not only RVNUSDT but I am also tracking and trading RVNBTC. They are both going up.
Technical analysis
Notice the main low and support around August 2024, a year ago. Now notice how all the bearish action tends to stall around this level. Brown line on the chart.
In April the market moves below—break of support—just to recover with high volume after a few days. This break below support is the market bottom and the move is called "an excess." When the momentum goes beyond on one side. Excesses always tend to be corrected.
The triangular pattern with the lower highs is also interesting. This pattern points to a breakout happening soon. When the action reaches the apex, or gets close to it, the market booms.
The theory is that any direction is possible. In theory, people say the market can move down just as it can move up.
In actuallity, the market only can move up because the bearish wave is already over. Night follows day. After going down, the market grows. You cannot get night after night. You cannot get a bear market followed by a bear market.
In practice, we are set for a very strong bullish wave and breakout in the coming months. Short-term it can move, but we are always prepared to wait long.
Ravencoin is about to produce a bullish breakout. This is a friendly reminder.
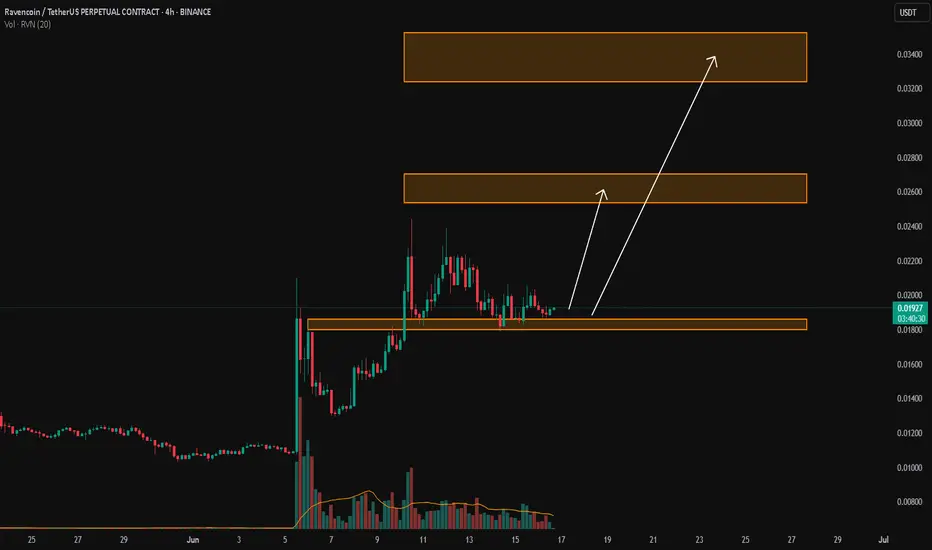
Full Futures Trading Trade-Numbers below:
________
LONG RVNUSDT
ENTRY: 0.01250 - 0.01460 (STOP: 0.01240)
TARGETS: 0.01902, 0.02538, 0.03569, 0.04600, 0.05236
________
These setups can be approached with leverage up to 20X. If the stop-loss ranges around 3-5%, 20X is possible. If the stop-loss is 5-8%, then 10X is possible, etc.
A chart setup with 20X lev. potential can be extremely safe when approached with 2-3X. There are many ways to approach the market; opportunities are endless.
Thanks a lot for your continued support.
Namaste.
Ravencoin ( RVN)RVN usdt Daily analysis
Time frame 4hours
Risk rewards ratio >1.5
Target = 0.01133
Short position for short time

#RVN RavencoinThere are two targets showns above:
1st one correction 0.5 Fibo retracement
2d one -0.618 Fibo retracement!
RVNUSDT Massive Breakout Loading? After 2 Years of Compression!
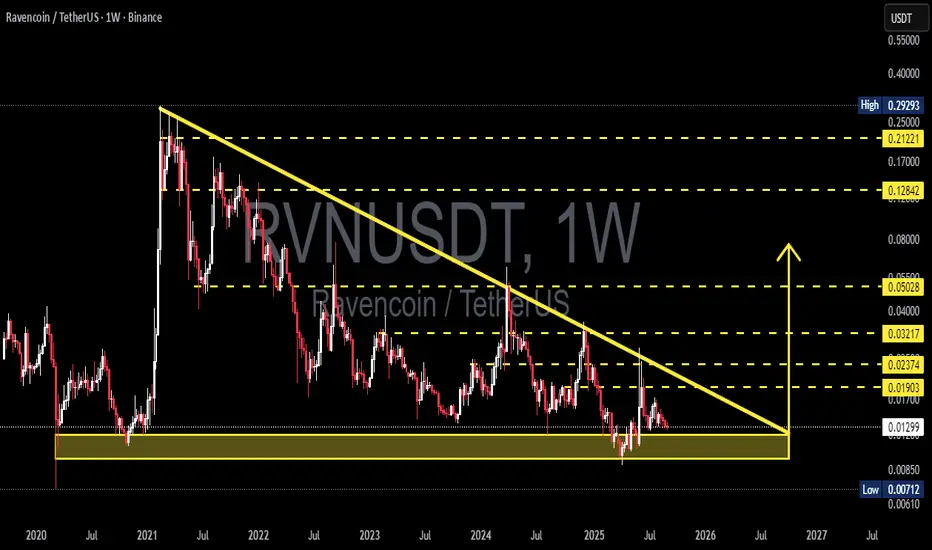
📈 Weekly Technical Analysis: Ravencoin (RVN/USDT)
🧠 Main Pattern: Descending Triangle ⚠️
Ravencoin has been consolidating within a Descending Triangle since early 2021 — typically a bearish continuation pattern, but one that can lead to a massive trend reversal if the upper boundary is broken.
🟨 Key Accumulation Zone:
📍 Support Area: $0.01280 – $0.01080
This zone has been tested multiple times and has shown strong buyer defense since 2022.
📏 Dynamic Resistance:
📍 Downward sloping trendline from the 2021 peak — currently acting as major resistance.
🟢 Bullish Scenario: Breakout Ahead? 🌕🚀
If RVN breaks above the descending trendline (~$0.01903) and closes strongly on the weekly chart, we could see a major uptrend unfold.
🎯 Bullish Targets:
🪙 $0.03217 — Minor horizontal resistance
🪙 $0.05028 — Key psychological level
🪙 $0.12842 — Major historical resistance
🪙 $0.21221 — Long-term bullish target
🔍 Breakout Confirmation Checklist: ✅ Weekly candle close above resistance
✅ Strong volume spike
✅ RSI rebound from oversold territory
🔴 Bearish Scenario: Breakdown Warning ⚠️📉
If price fails to hold the support zone at $0.01280:
❌ First target: $0.01080
❌ Breakdown risk: $0.00712
❌ Breakdown from triangle may confirm long-term bearish continuation
🎯 Conclusion & Strategy:
📌 Price is nearing the apex of a multi-year compression pattern
📌 A breakout could lead to exponential upside potential
📌 Great setup for swing or position traders
📌 Wait for confirmed breakout with volume before entry
#RVNUSDT #Ravencoin #CryptoBreakout #TechnicalAnalysis #AltcoinSeason #DescendingTriangle #BinanceTrading #BreakoutSignal
RVN/USDTKey Level Zone: 0.01550 - 0.01620
LMT v2.0 detected.
The setup looks promising—price previously trended upward with rising volume and momentum, then retested this zone cleanly. This presents an excellent reward-to-risk opportunity if momentum continues to align.
Introducing LMT (Levels & Momentum Trading)
- Over the past 3 years, I’ve refined my approach to focus more sharply on the single most important element in any trade: the KEY LEVEL.
- While HMT (High Momentum Trading) served me well—combining trend, momentum, volume, and structure across multiple timeframes—I realized that consistently identifying and respecting these critical price zones is what truly separates good trades from great ones.
- That insight led to the evolution of HMT into LMT – Levels & Momentum Trading.
Why the Change? (From HMT to LMT)
Switching from High Momentum Trading (HMT) to Levels & Momentum Trading (LMT) improves precision, risk control, and confidence by:
- Clearer Entries & Stops: Defined key levels make it easier to plan entries, stop-losses, and position sizing—no more guesswork.
- Better Signal Quality: Momentum is now always checked against a support or resistance zone—if it aligns, it's a stronger setup.
- Improved Reward-to-Risk: All trades are anchored to key levels, making it easier to calculate and manage risk effectively.
- Stronger Confidence: With clear invalidation points beyond key levels, it's easier to trust the plan and stay disciplined—even in tough markets.
Whenever I share a signal, it’s because:
- A high‐probability key level has been identified on a higher timeframe.
- Lower‐timeframe momentum, market structure and volume suggest continuation or reversal is imminent.
- The reward‐to‐risk (based on that key level) meets my criteria for a disciplined entry.
***Please note that conducting a comprehensive analysis on a single timeframe chart can be quite challenging and sometimes confusing. I appreciate your understanding of the effort involved.
Important Note: The Role of Key Levels
- Holding a key level zone: If price respects the key level zone, momentum often carries the trend in the expected direction. That’s when we look to enter, with stop-loss placed just beyond the zone with some buffer.
- Breaking a key level zone: A definitive break signals a potential stop‐out for trend traders. For reversal traders, it’s a cue to consider switching direction—price often retests broken zones as new support or resistance.
My Trading Rules (Unchanged)
Risk Management
- Maximum risk per trade: 2.5%
- Leverage: 5x
Exit Strategy / Profit Taking
- Sell at least 70% on the 3rd wave up (LTF Wave 5).
- Typically sell 50% during a high‐volume spike.
- Move stop‐loss to breakeven once the trade achieves a 1.5:1 R:R.
- Exit at breakeven if momentum fades or divergence appears.
The market is highly dynamic and constantly changing. LMT signals and target profit (TP) levels are based on the current price and movement, but market conditions can shift instantly, so it is crucial to remain adaptable and follow the market's movement.
If you find this signal/analysis meaningful, kindly like and share it.
Thank you for your support~
Sharing this with love!
From HMT to LMT: A Brief Version History
HM Signal :
Date: 17/08/2023
- Early concept identifying high momentum pullbacks within strong uptrends
- Triggered after a prior wave up with rising volume and momentum
- Focused on healthy retracements into support for optimal reward-to-risk setups
HMT v1.0:
Date: 18/10/2024
- Initial release of the High Momentum Trading framework
- Combined multi-timeframe trend, volume, and momentum analysis.
- Focused on identifying strong trending moves high momentum
HMT v2.0:
Date: 17/12/2024
- Major update to the Momentum indicator
- Reduced false signals from inaccurate momentum detection
- New screener with improved accuracy and fewer signals
HMT v3.0:
Date: 23/12/2024
- Added liquidity factor to enhance trend continuation
- Improved potential for momentum-based plays
- Increased winning probability by reducing entries during peaks
HMT v3.1:
Date: 31/12/2024
- Enhanced entry confirmation for improved reward-to-risk ratios
HMT v4.0:
Date: 05/01/2025
- Incorporated buying and selling pressure in lower timeframes to enhance the probability of trending moves while optimizing entry timing and scaling
HMT v4.1:
Date: 06/01/2025
- Enhanced take-profit (TP) target by incorporating market structure analysis
HMT v5 :
Date: 23/01/2025
- Refined wave analysis for trending conditions
- Incorporated lower timeframe (LTF) momentum to strengthen trend reliability
- Re-aligned and re-balanced entry conditions for improved accuracy
HMT v6 :
Date : 15/02/2025
- Integrated strong accumulation activity into in-depth wave analysis
HMT v7 :
Date : 20/03/2025
- Refined wave analysis along with accumulation and market sentiment
HMT v8 :
Date : 16/04/2025
- Fully restructured strategy logic
HMT v8.1 :
Date : 18/04/2025
- Refined Take Profit (TP) logic to be more conservative for improved win consistency
LMT v1.0 :
Date : 06/06/2025
- Rebranded to emphasize key levels + momentum as the core framework
LMT v2.0
Date: 11/06/2025
- Fully restructured lower timeframe (LTF) momentum logic
RVN/USDTKey Level Zone: 0.01800 - 0.01860
LMT v2.0 detected.
The setup looks promising—price previously trended upward with rising volume and momentum, then retested this zone cleanly. This presents an excellent reward-to-risk opportunity if momentum continues to align.
Introducing LMT (Levels & Momentum Trading)
- Over the past 3 years, I’ve refined my approach to focus more sharply on the single most important element in any trade: the KEY LEVEL.
- While HMT (High Momentum Trading) served me well—combining trend, momentum, volume, and structure across multiple timeframes—I realized that consistently identifying and respecting these critical price zones is what truly separates good trades from great ones.
- That insight led to the evolution of HMT into LMT – Levels & Momentum Trading.
Why the Change? (From HMT to LMT)
Switching from High Momentum Trading (HMT) to Levels & Momentum Trading (LMT) improves precision, risk control, and confidence by:
- Clearer Entries & Stops: Defined key levels make it easier to plan entries, stop-losses, and position sizing—no more guesswork.
- Better Signal Quality: Momentum is now always checked against a support or resistance zone—if it aligns, it's a stronger setup.
- Improved Reward-to-Risk: All trades are anchored to key levels, making it easier to calculate and manage risk effectively.
- Stronger Confidence: With clear invalidation points beyond key levels, it's easier to trust the plan and stay disciplined—even in tough markets.
Whenever I share a signal, it’s because:
- A high‐probability key level has been identified on a higher timeframe.
- Lower‐timeframe momentum, market structure and volume suggest continuation or reversal is imminent.
- The reward‐to‐risk (based on that key level) meets my criteria for a disciplined entry.
***Please note that conducting a comprehensive analysis on a single timeframe chart can be quite challenging and sometimes confusing. I appreciate your understanding of the effort involved.
Important Note: The Role of Key Levels
- Holding a key level zone: If price respects the key level zone, momentum often carries the trend in the expected direction. That’s when we look to enter, with stop-loss placed just beyond the zone with some buffer.
- Breaking a key level zone: A definitive break signals a potential stop‐out for trend traders. For reversal traders, it’s a cue to consider switching direction—price often retests broken zones as new support or resistance.
My Trading Rules (Unchanged)
Risk Management
- Maximum risk per trade: 2.5%
- Leverage: 5x
Exit Strategy / Profit Taking
- Sell at least 70% on the 3rd wave up (LTF Wave 5).
- Typically sell 50% during a high‐volume spike.
- Move stop‐loss to breakeven once the trade achieves a 1.5:1 R:R.
- Exit at breakeven if momentum fades or divergence appears.
The market is highly dynamic and constantly changing. LMT signals and target profit (TP) levels are based on the current price and movement, but market conditions can shift instantly, so it is crucial to remain adaptable and follow the market's movement.
If you find this signal/analysis meaningful, kindly like and share it.
Thank you for your support~
Sharing this with love!
From HMT to LMT: A Brief Version History
HM Signal :
Date: 17/08/2023
- Early concept identifying high momentum pullbacks within strong uptrends
- Triggered after a prior wave up with rising volume and momentum
- Focused on healthy retracements into support for optimal reward-to-risk setups
HMT v1.0:
Date: 18/10/2024
- Initial release of the High Momentum Trading framework
- Combined multi-timeframe trend, volume, and momentum analysis.
- Focused on identifying strong trending moves high momentum
HMT v2.0:
Date: 17/12/2024
- Major update to the Momentum indicator
- Reduced false signals from inaccurate momentum detection
- New screener with improved accuracy and fewer signals
HMT v3.0:
Date: 23/12/2024
- Added liquidity factor to enhance trend continuation
- Improved potential for momentum-based plays
- Increased winning probability by reducing entries during peaks
HMT v3.1:
Date: 31/12/2024
- Enhanced entry confirmation for improved reward-to-risk ratios
HMT v4.0:
Date: 05/01/2025
- Incorporated buying and selling pressure in lower timeframes to enhance the probability of trending moves while optimizing entry timing and scaling
HMT v4.1:
Date: 06/01/2025
- Enhanced take-profit (TP) target by incorporating market structure analysis
HMT v5 :
Date: 23/01/2025
- Refined wave analysis for trending conditions
- Incorporated lower timeframe (LTF) momentum to strengthen trend reliability
- Re-aligned and re-balanced entry conditions for improved accuracy
HMT v6 :
Date : 15/02/2025
- Integrated strong accumulation activity into in-depth wave analysis
HMT v7 :
Date : 20/03/2025
- Refined wave analysis along with accumulation and market sentiment
HMT v8 :
Date : 16/04/2025
- Fully restructured strategy logic
HMT v8.1 :
Date : 18/04/2025
- Refined Take Profit (TP) logic to be more conservative for improved win consistency
LMT v1.0 :
Date : 06/06/2025
- Rebranded to emphasize key levels + momentum as the core framework
LMT v2.0
Date: 11/06/2025
- Fully restructured lower timeframe (LTF) momentum logic
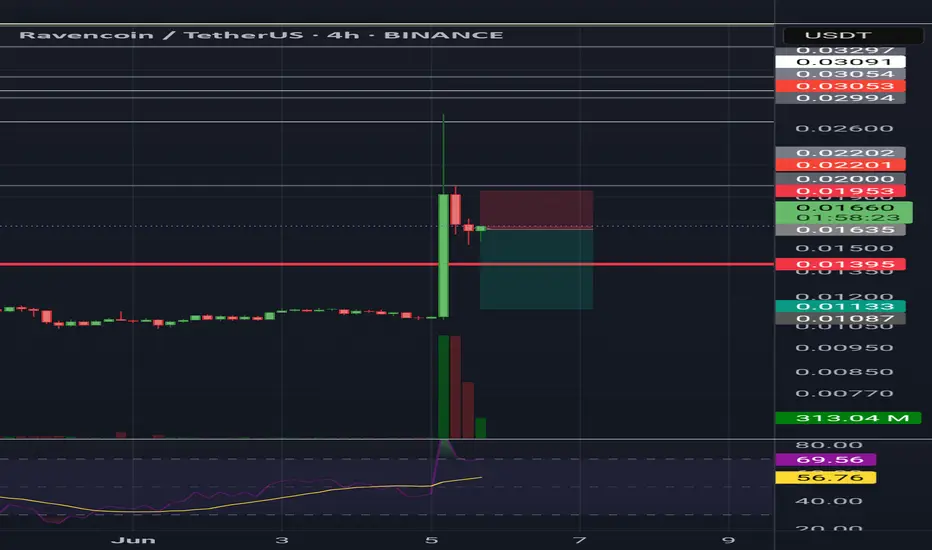
Ravencoin Bullish Continuation, Altcoins Bull Market ConfirmedRavencoin produced a major bullish breakout, we've seen many of those. It happens that you get one of these breakouts but the following week bullish action is dead. That was all, end of story. This isn't the case here and this is truly great news.
First, Ravencoin produced some of the biggest volume ever, only once was there a week with higher volume and the volume in the last two weeks is higher even than in the 2021 bull market. This clearly reveals the start of the next bullish phase, at least for this pair, but never in the history of Crypto has this project or any other gone on a bull market on its own, not in 2021 and not in 2025. What one does, the rest follows.
So we have a bullish continuation. Really high volume to break above EMA34 followed by additional growth. We can expect this trend to continue. These weekly candles are the biggest since 2021.
Get ready, because the same will happen across hundreds of altcoins.
Here is the daily timeframe:
Two days red and it is clear that this project is creating a new uptrend... Thank you for reading.
Namaste.

RVN/USDT – Ascending Trendline Breakdown in Play
**Pair:** RVN/USDT 💱
**Timeframe:** 1H ⏱️
**Pattern:** Ascending Trendline Breakdown Attempt ⚠️
RVN is currently attempting to break below a key ascending trendline near **0.0209**. This level has held several times, but selling pressure is increasing 📉.
**Bearish Scenario ❌**
A confirmed 1H close below **0.0205** could trigger downside momentum:
🎯 Target 1: 0.0195
🎯 Target 2: 0.0180
📉 Breakdown may accelerate if volume increases.
**Bullish Defense ✅**
If bulls reclaim **0.0220** and defend the trendline again, upside continuation remains possible.
🛑 SL (for shorts): above 0.0225
🔍 Wait for confirmation — fakeouts are common near support zones.

RVN USDTCAR car car is the one I sent to the house now to the one in front seat the house and we will go and we will have our first date and time for you guys I know I sent it the house and I know I sent
Altcoins Market Bull Market Confirmed, RavencoinI have something very, very interesting here, and it has two parts.
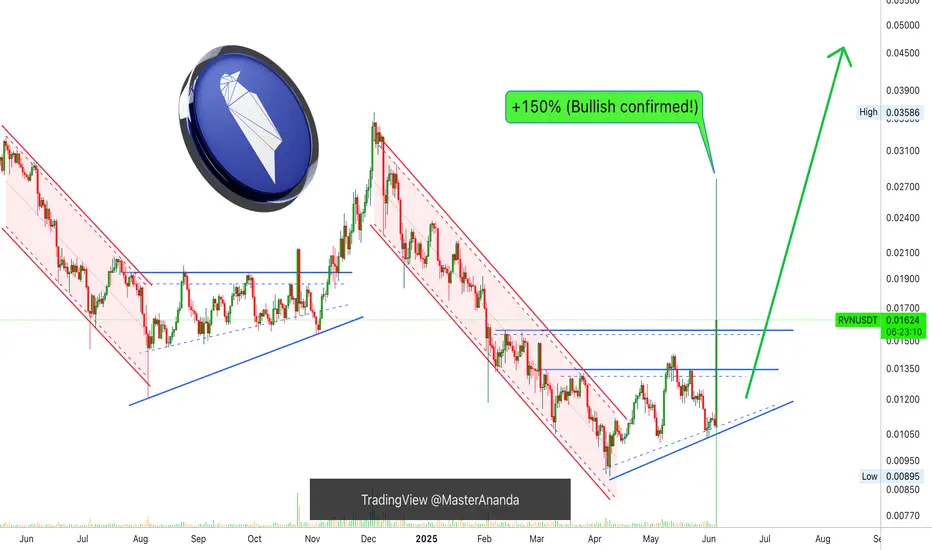
1) Ravencoin is breaking out with three digits green, +150% within today's candle.
2) This is very interesting because this is the exact same chart as all the other major and minor altcoins —What one does, the rest follows. It confirms the altcoins market bull market is here.
First, let me ask you something; Would an altcoin breakup by 150% in a single day in a correction or bear market? This only happens preceding a major bullish phase.
Ravencoin hit bottom early April, the low first happened on the 7th followed by double-bottom on the 9th. This led to a small recovery and now a massive bullish breakout.
All the altcoins we've been seeing, most of them, bottomed early April as well. All of these produced some growth between April and May. All of these went into a retrace late May to early June, and all those will start to break up soon.
The altcoins market bull market is already confirmed, this is proof.
Prepare for massive growth.
Thanks a lot for your continued support.
Namaste.
RVNUSDT Forming Bullish ReversalsRVNUSDT is currently showing a promising technical setup after an extended period of consolidation. The price has formed a strong base, supported by steady volume growth, which indicates renewed interest from both retail and institutional traders. This consolidation phase appears to be nearing completion, and a breakout from this level could trigger a powerful bullish rally. Based on the current structure and market momentum, a 70% to 80% gain is anticipated in the upcoming weeks.
Ravencoin (RVN) has maintained relevance in the blockchain space due to its unique focus on asset tokenization. It enables the creation and transfer of real-world assets on the blockchain, which is a growing narrative in the Web3 and DeFi sectors. As more investors seek alternative platforms to tokenize assets and explore decentralized finance, RVN is positioned to benefit from the increased use case demand and adoption.
Technically, RVNUSDT has respected key support zones, and the price action suggests accumulation by long-term holders. A confirmed breakout above recent resistance could catalyze the start of a bullish wave, with price targets aligning around historical resistance levels. The volume uptick further validates the possibility of a breakout, hinting at increased buyer activity and confidence in the project’s future.
Overall, RVNUSDT presents a compelling risk-reward setup for traders and investors watching altcoins with real utility and strong community backing. With the chart structure, fundamentals, and volume all aligning, this crypto pair could be preparing for a significant upward movement.
✅ Show your support by hitting the like button and
✅ Leaving a comment below! (What is You opinion about this Coin)
Your feedback and engagement keep me inspired to share more insightful market analysis with you!

RVN Breaks Out of Falling Wedge — Short-Term Reversal Incoming?NGM:RVN has just broken out of a Falling Wedge pattern on the 30-minute chart — a classic bullish reversal signal.
Price is currently testing the breakout level around 0.0132 with early signs of increasing volume. If support holds, RVN may continue toward the following upside targets:
📍 Target 1: 0.01471
📍 Target 2: 0.01595
📍 Target 3: 0.01682
🛡️ Invalidation level (stop loss): below 0.01287, which marks the previous local low before the breakout.
Volume is picking up during the breakout phase, suggesting that bearish pressure may be easing.
This setup is ideal for scalp or intraday traders looking for a healthy risk-reward ratio near the breakout support zone.

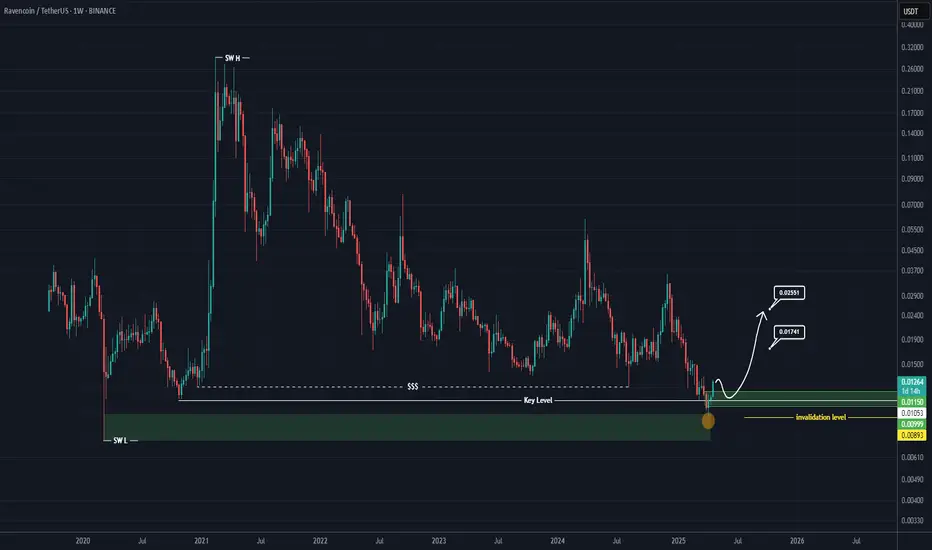
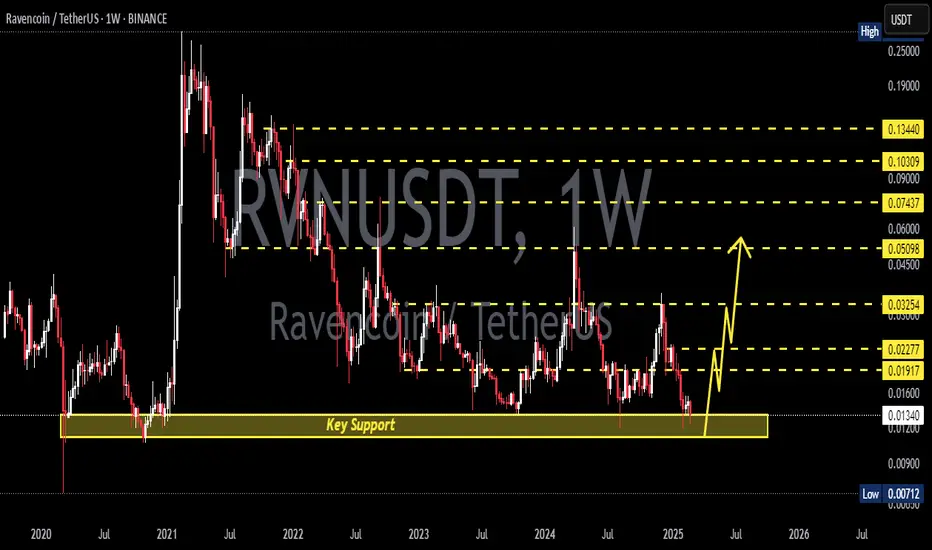
RVN Looks Bullish (1W)It’s one of the coins we are highly bullish on.
A major liquidity pool has been swept, and the price has hit an important origin level.
As long as the upper green zone holds, it can move toward the targets on the daily and weekly timeframes. The targets are marked on the chart.
A weekly candle close below the invalidation level would invalidate this analysis.
For risk management, please don't forget stop loss and capital management
Comment if you have any questions
Thank You
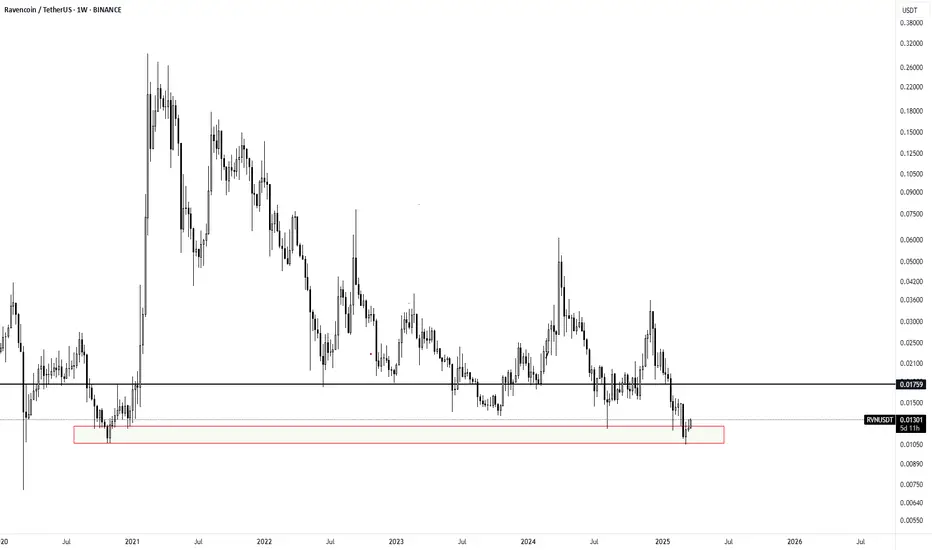
RVNUSDT 1D AnalysisRVN ~ 1D Analysis
#RVN If you still have confidence in this coin, perhaps you can consider this support to start buying back with a short-term target of at least 10%+ from here.

RVNUSDT 1W AnalysisRVN ~ 1W Analysis
#RVN Buy gradually from here if you still have a Conviction on this coin with a short -term target of at least 20%+.
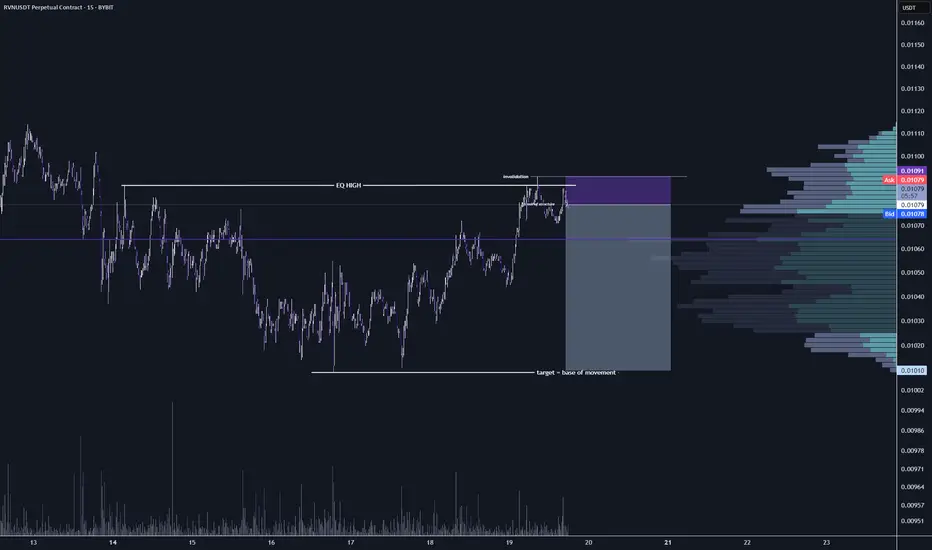
Short on RVN coin - Equal highs taken, target is the base of the movement.
Inspired in the ict mentorship, just an idea of a trade
RVN is about to fly.All altcoins are looking beautiful, Expecting a 2x move for RVN Coin.
Weekly support hit, Send it
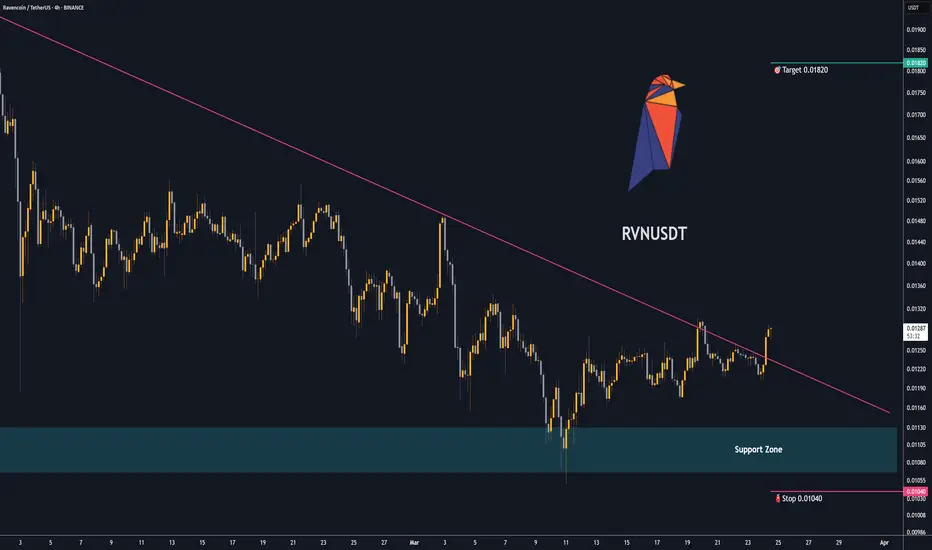
Trading opportunity for Ravencoin RVNUSDTBased on technical factors there is a Buy position in :
📊 RVNUSDT
🔵 Buy Now
🪫Stop loss 0.01040
🔋Target 0.01820
📏 R/R 2,2
💸RISK : 1%
We hope it is profitable for you ❤️
Please support our activity with your likes👍 and comments📝
RVNUSDT 1WRVN ~ 1W Analysis
#RVN Buy gradually from here with a short -term target of at least 20%+.
Reason, This is the lowest support block for now.
RVNUSDT 1WRVN ~ 1W Analysis
#RVN This is the lowest support for now. Buy from here if you still have a Conviction on this coin.
RVNUSDT 1WRVN ~ 1W Analysis
#RVN So far continues to maintain this support block. Buy from here if you still have a Conviction on this coin with a minimum target of 20%+